
An official website of the United States government
An official website of the United States government
The .gov means it's official.
Federal government websites often end in .gov or .mil. Before sharing sensitive information,
make sure you're on a federal government site.
The site is secure.
The
https:// ensures that you are connecting to the official website and that any
information you provide is encrypted and transmitted securely.
Supervise and coordinate activities of crew engaged in operating and maintaining engines, boilers, deck machinery, and electrical, sanitary, and refrigeration equipment aboard ship. Excludes �Engineers� (17-2000).
Employment estimate and mean wage estimates for Ship Engineers:
| Employment (1) | Employment RSE (3) |
Mean hourly wage |
Mean annual wage (2) |
Wage RSE (3) |
|---|---|---|---|---|
| 8,860 | 3.4 % | $ 48.34 | $ 100,550 | 1.1 % |
Percentile wage estimates for Ship Engineers:
| Percentile | 10% | 25% | 50% (Median) |
75% | 90% |
|---|---|---|---|---|---|
| Hourly Wage | $ 27.47 | $ 33.12 | $ 45.32 | $ 58.84 | $ 68.23 |
| Annual Wage (2) | $ 57,140 | $ 68,880 | $ 94,270 | $ 122,390 | $ 141,910 |
Industries with the highest published employment and wages for Ship Engineers are provided. For a list of all industries with employment in Ship Engineers, see the Create Customized Tables function.
Industries with the highest levels of employment in Ship Engineers:
| Industry | Employment (1) | Percent of industry employment | Hourly mean wage | Annual mean wage (2) |
|---|---|---|---|---|
| Support Activities for Water Transportation | 2,260 | 2.37 | $ 47.58 | $ 98,970 |
| Deep Sea, Coastal, and Great Lakes Water Transportation | 1,910 | 4.86 | $ 58.06 | $ 120,770 |
| Inland Water Transportation | 1,320 | 5.09 | $ 50.24 | $ 104,490 |
| Federal, State, and Local Government, excluding State and Local Government Schools and Hospitals and the U.S. Postal Service (OEWS Designation) | 1,080 | 0.05 | $ 41.80 | $ 86,950 |
| State Government, excluding Schools and Hospitals (OEWS Designation) | 370 | 0.02 | $ 42.79 | $ 88,990 |
Industries with the highest concentration of employment in Ship Engineers:
| Industry | Employment (1) | Percent of industry employment | Hourly mean wage | Annual mean wage (2) |
|---|---|---|---|---|
| Inland Water Transportation | 1,320 | 5.09 | $ 50.24 | $ 104,490 |
| Deep Sea, Coastal, and Great Lakes Water Transportation | 1,910 | 4.86 | $ 58.06 | $ 120,770 |
| Support Activities for Water Transportation | 2,260 | 2.37 | $ 47.58 | $ 98,970 |
| Scenic and Sightseeing Transportation, Water | 140 | 0.84 | $ 33.93 | $ 70,570 |
| Other Heavy and Civil Engineering Construction | 150 | 0.12 | $ 40.52 | $ 84,280 |
Top paying industries for Ship Engineers:
| Industry | Employment (1) | Percent of industry employment | Hourly mean wage | Annual mean wage (2) |
|---|---|---|---|---|
| Gambling Industries | 40 | 0.02 | $ 64.60 | $ 134,370 |
| Deep Sea, Coastal, and Great Lakes Water Transportation | 1,910 | 4.86 | $ 58.06 | $ 120,770 |
| Inland Water Transportation | 1,320 | 5.09 | $ 50.24 | $ 104,490 |
| Support Activities for Water Transportation | 2,260 | 2.37 | $ 47.58 | $ 98,970 |
| Colleges, Universities, and Professional Schools | 100 | (7) | $ 46.53 | $ 96,790 |
States and areas with the highest published employment, location quotients, and wages for Ship Engineers are provided. For a list of all areas with employment in Ship Engineers, see the Create Customized Tables function.
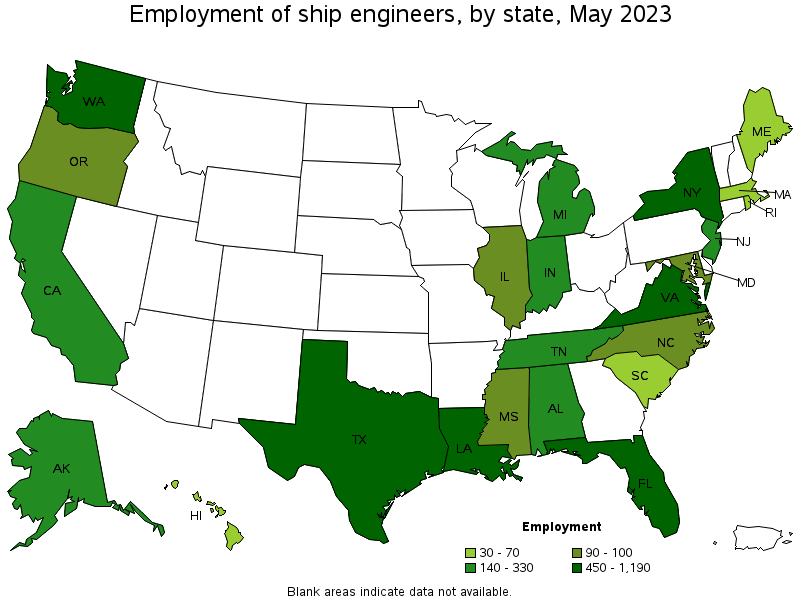
States with the highest employment level in Ship Engineers:
| State | Employment (1) | Employment per thousand jobs | Location quotient (9) | Hourly mean wage | Annual mean wage (2) |
|---|---|---|---|---|---|
| Virginia | 1,190 | 0.30 | 5.11 | $ 42.44 | $ 88,270 |
| Texas | 1,190 | 0.09 | 1.50 | $ 55.49 | $ 115,430 |
| Louisiana | 930 | 0.50 | 8.63 | $ 51.35 | $ 106,810 |
| Florida | 840 | 0.09 | 1.51 | $ 48.88 | $ 101,680 |
| Washington | 780 | 0.22 | 3.82 | $ 45.82 | $ 95,300 |
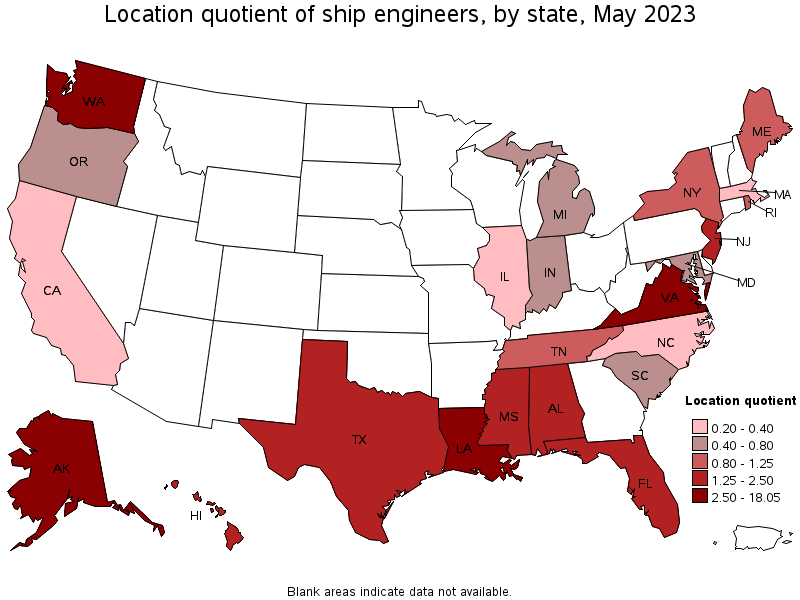
States with the highest concentration of jobs and location quotients in Ship Engineers:
| State | Employment (1) | Employment per thousand jobs | Location quotient (9) | Hourly mean wage | Annual mean wage (2) |
|---|---|---|---|---|---|
| Alaska | 330 | 1.05 | 18.05 | $ 41.92 | $ 87,190 |
| Louisiana | 930 | 0.50 | 8.63 | $ 51.35 | $ 106,810 |
| Virginia | 1,190 | 0.30 | 5.11 | $ 42.44 | $ 88,270 |
| Washington | 780 | 0.22 | 3.82 | $ 45.82 | $ 95,300 |
| Hawaii | 70 | 0.12 | 2.02 | $ 53.81 | $ 111,930 |
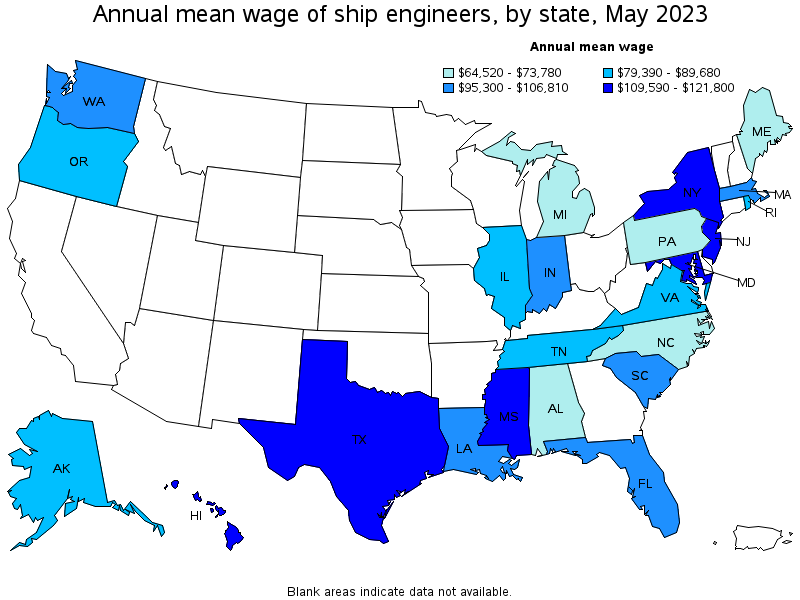
Top paying states for Ship Engineers:
| State | Employment (1) | Employment per thousand jobs | Location quotient (9) | Hourly mean wage | Annual mean wage (2) |
|---|---|---|---|---|---|
| Mississippi | 90 | 0.08 | 1.38 | $ 58.56 | $ 121,800 |
| New York | 450 | 0.05 | 0.82 | $ 56.94 | $ 118,430 |
| Maryland | 90 | 0.03 | 0.55 | $ 56.33 | $ 117,170 |
| Texas | 1,190 | 0.09 | 1.50 | $ 55.49 | $ 115,430 |
| Hawaii | 70 | 0.12 | 2.02 | $ 53.81 | $ 111,930 |
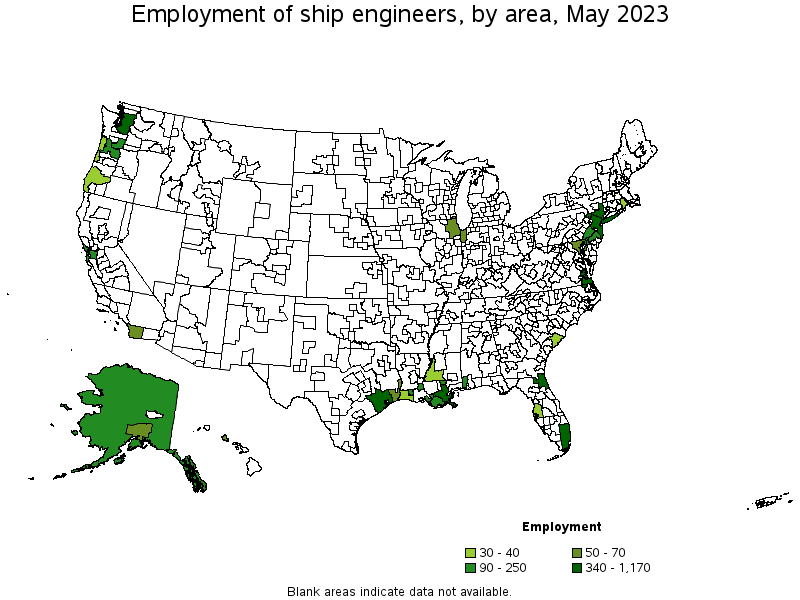
Metropolitan areas with the highest employment level in Ship Engineers:
| Metropolitan area | Employment (1) | Employment per thousand jobs | Location quotient (9) | Hourly mean wage | Annual mean wage (2) |
|---|---|---|---|---|---|
| Virginia Beach-Norfolk-Newport News, VA-NC | 1,170 | 1.59 | 27.24 | $ 42.28 | $ 87,940 |
| Houston-The Woodlands-Sugar Land, TX | 900 | 0.28 | 4.84 | $ 56.64 | $ 117,820 |
| Seattle-Tacoma-Bellevue, WA | 660 | 0.32 | 5.42 | $ 45.64 | $ 94,930 |
| New York-Newark-Jersey City, NY-NJ-PA | 640 | 0.07 | 1.15 | $ 57.57 | $ 119,740 |
| New Orleans-Metairie, LA | 450 | 0.88 | 15.05 | $ 50.89 | $ 105,850 |
| Jacksonville, FL | 420 | 0.56 | 9.67 | $ 48.38 | $ 100,630 |
| Miami-Fort Lauderdale-West Palm Beach, FL | 340 | 0.12 | 2.12 | $ 49.10 | $ 102,140 |
| San Francisco-Oakland-Hayward, CA | 180 | 0.07 | 1.27 | $ 121.96 | $ 253,690 |
| Houma-Thibodaux, LA | 160 | 2.01 | 34.44 | $ 48.22 | $ 100,290 |
| Philadelphia-Camden-Wilmington, PA-NJ-DE-MD | 110 | 0.04 | 0.70 | $ 41.78 | $ 86,900 |
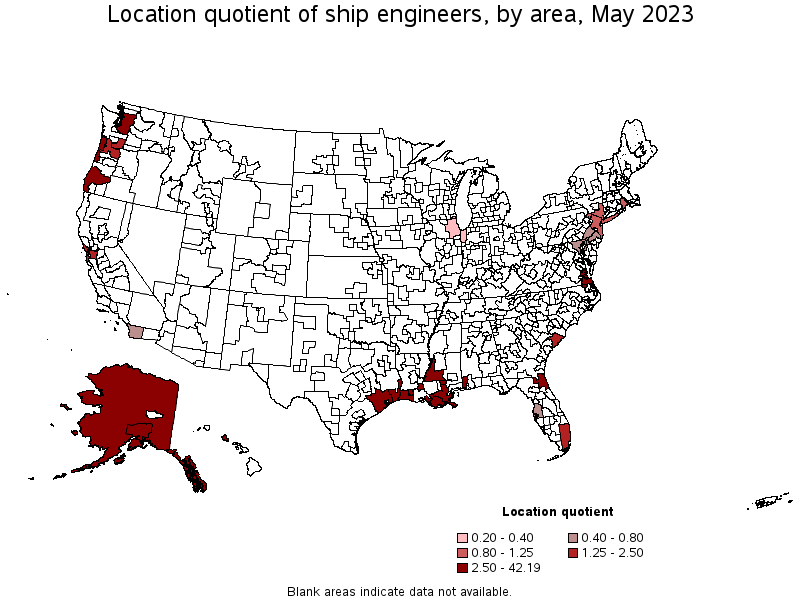
Metropolitan areas with the highest concentration of jobs and location quotients in Ship Engineers:
| Metropolitan area | Employment (1) | Employment per thousand jobs | Location quotient (9) | Hourly mean wage | Annual mean wage (2) |
|---|---|---|---|---|---|
| Houma-Thibodaux, LA | 160 | 2.01 | 34.44 | $ 48.22 | $ 100,290 |
| Virginia Beach-Norfolk-Newport News, VA-NC | 1,170 | 1.59 | 27.24 | $ 42.28 | $ 87,940 |
| New Orleans-Metairie, LA | 450 | 0.88 | 15.05 | $ 50.89 | $ 105,850 |
| Mobile, AL | 100 | 0.61 | 10.42 | $ 34.31 | $ 71,360 |
| Jacksonville, FL | 420 | 0.56 | 9.67 | $ 48.38 | $ 100,630 |
| Anchorage, AK | 70 | 0.39 | 6.64 | $ 42.93 | $ 89,290 |
| Beaumont-Port Arthur, TX | 60 | 0.36 | 6.18 | $ 45.31 | $ 94,240 |
| Lake Charles, LA | 30 | 0.35 | 5.97 | $ 42.02 | $ 87,410 |
| Seattle-Tacoma-Bellevue, WA | 660 | 0.32 | 5.42 | $ 45.64 | $ 94,930 |
| Houston-The Woodlands-Sugar Land, TX | 900 | 0.28 | 4.84 | $ 56.64 | $ 117,820 |
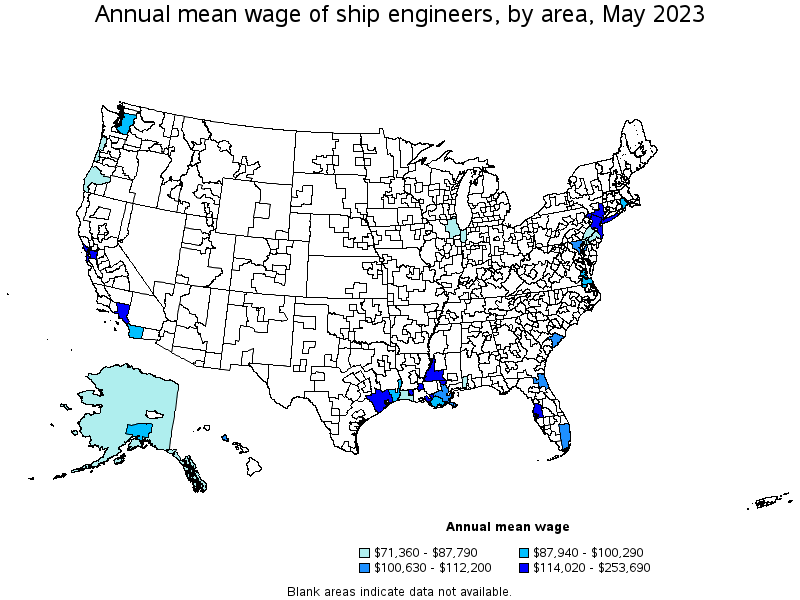
Top paying metropolitan areas for Ship Engineers:
| Metropolitan area | Employment (1) | Employment per thousand jobs | Location quotient (9) | Hourly mean wage | Annual mean wage (2) |
|---|---|---|---|---|---|
| San Francisco-Oakland-Hayward, CA | 180 | 0.07 | 1.27 | $ 121.96 | $ 253,690 |
| New York-Newark-Jersey City, NY-NJ-PA | 640 | 0.07 | 1.15 | $ 57.57 | $ 119,740 |
| Los Angeles-Long Beach-Anaheim, CA | (8) | (8) | (8) | $ 57.00 | $ 118,550 |
| Houston-The Woodlands-Sugar Land, TX | 900 | 0.28 | 4.84 | $ 56.64 | $ 117,820 |
| Tampa-St. Petersburg-Clearwater, FL | 40 | 0.03 | 0.54 | $ 55.63 | $ 115,700 |
| Baltimore-Columbia-Towson, MD | 50 | 0.04 | 0.69 | $ 53.94 | $ 112,200 |
| Urban Honolulu, HI | 70 | 0.16 | 2.77 | $ 52.88 | $ 110,000 |
| New Orleans-Metairie, LA | 450 | 0.88 | 15.05 | $ 50.89 | $ 105,850 |
| Miami-Fort Lauderdale-West Palm Beach, FL | 340 | 0.12 | 2.12 | $ 49.10 | $ 102,140 |
| Charleston-North Charleston, SC | 40 | 0.12 | 2.05 | $ 48.75 | $ 101,390 |
Nonmetropolitan areas with the highest employment in Ship Engineers:
| Nonmetropolitan area | Employment (1) | Employment per thousand jobs | Location quotient (9) | Hourly mean wage | Annual mean wage (2) |
|---|---|---|---|---|---|
| Alaska nonmetropolitan area | 250 | 2.46 | 42.19 | $ 41.80 | $ 86,940 |
| Southwest Louisiana nonmetropolitan area | 90 | 1.39 | 23.74 | $ 54.82 | $ 114,020 |
| Coast Oregon nonmetropolitan area | 40 | 0.36 | 6.13 | $ 39.73 | $ 82,640 |
| Southwest Mississippi nonmetropolitan area | 40 | 0.57 | 9.80 | $ 55.86 | $ 116,200 |
Nonmetropolitan areas with the highest concentration of jobs and location quotients in Ship Engineers:
| Nonmetropolitan area | Employment (1) | Employment per thousand jobs | Location quotient (9) | Hourly mean wage | Annual mean wage (2) |
|---|---|---|---|---|---|
| Alaska nonmetropolitan area | 250 | 2.46 | 42.19 | $ 41.80 | $ 86,940 |
| Southwest Louisiana nonmetropolitan area | 90 | 1.39 | 23.74 | $ 54.82 | $ 114,020 |
| Southwest Mississippi nonmetropolitan area | 40 | 0.57 | 9.80 | $ 55.86 | $ 116,200 |
| Coast Oregon nonmetropolitan area | 40 | 0.36 | 6.13 | $ 39.73 | $ 82,640 |
Top paying nonmetropolitan areas for Ship Engineers:
| Nonmetropolitan area | Employment (1) | Employment per thousand jobs | Location quotient (9) | Hourly mean wage | Annual mean wage (2) |
|---|---|---|---|---|---|
| Southwest Mississippi nonmetropolitan area | 40 | 0.57 | 9.80 | $ 55.86 | $ 116,200 |
| Southwest Louisiana nonmetropolitan area | 90 | 1.39 | 23.74 | $ 54.82 | $ 114,020 |
| Alaska nonmetropolitan area | 250 | 2.46 | 42.19 | $ 41.80 | $ 86,940 |
| Coast Oregon nonmetropolitan area | 40 | 0.36 | 6.13 | $ 39.73 | $ 82,640 |
These estimates are calculated with data collected from employers in all industry sectors, all metropolitan and nonmetropolitan areas, and all states and the District of Columbia. The top employment and wage figures are provided above. The complete list is available in the downloadable XLS files.
The percentile wage estimate is the value of a wage below which a certain percent of workers fall. The median wage is the 50th percentile wage estimate—50 percent of workers earn less than the median and 50 percent of workers earn more than the median. More about percentile wages.
(1) Estimates for detailed occupations do not sum to the totals because the totals include occupations not shown separately. Estimates do not include self-employed workers.
(2) Annual wages have been calculated by multiplying the hourly mean wage by a "year-round, full-time" hours figure of 2,080 hours; for those occupations where there is not an hourly wage published, the annual wage has been directly calculated from the reported survey data.
(3) The relative standard error (RSE) is a measure of the reliability of a survey statistic. The smaller the relative standard error, the more precise the estimate.
(7) The value is less than .005 percent of industry employment.
(8) Estimate not released.
(9) The location quotient is the ratio of the area concentration of occupational employment to the national average concentration. A location quotient greater than one indicates the occupation has a higher share of employment than average, and a location quotient less than one indicates the occupation is less prevalent in the area than average.
Other OEWS estimates and related information:
May 2023 National Occupational Employment and Wage Estimates
May 2023 State Occupational Employment and Wage Estimates
May 2023 Metropolitan and Nonmetropolitan Area Occupational Employment and Wage Estimates
May 2023 National Industry-Specific Occupational Employment and Wage Estimates
Last Modified Date: April 3, 2024