
An official website of the United States government
An official website of the United States government
The .gov means it's official.
Federal government websites often end in .gov or .mil. Before sharing sensitive information,
make sure you're on a federal government site.
The site is secure.
The
https:// ensures that you are connecting to the official website and that any
information you provide is encrypted and transmitted securely.
Control or tend conveyors or conveyor systems that move materials or products to and from stockpiles, processing stations, departments, or vehicles. May control speed and routing of materials or products.
Employment estimate and mean wage estimates for Conveyor Operators and Tenders:
| Employment (1) | Employment RSE (3) |
Mean hourly wage |
Mean annual wage (2) |
Wage RSE (3) |
|---|---|---|---|---|
| 24,660 | 2.6 % | $ 20.63 | $ 42,900 | 0.5 % |
Percentile wage estimates for Conveyor Operators and Tenders:
| Percentile | 10% | 25% | 50% (Median) |
75% | 90% |
|---|---|---|---|---|---|
| Hourly Wage | $ 15.75 | $ 16.97 | $ 18.88 | $ 22.60 | $ 28.80 |
| Annual Wage (2) | $ 32,770 | $ 35,290 | $ 39,260 | $ 47,000 | $ 59,910 |
Industries with the highest published employment and wages for Conveyor Operators and Tenders are provided. For a list of all industries with employment in Conveyor Operators and Tenders, see the Create Customized Tables function.
Industries with the highest levels of employment in Conveyor Operators and Tenders:
| Industry | Employment (1) | Percent of industry employment | Hourly mean wage | Annual mean wage (2) |
|---|---|---|---|---|
| Couriers and Express Delivery Services | 9,930 | 1.07 | $ 18.38 | $ 38,230 |
| Farm Product Raw Material Merchant Wholesalers | 2,950 | 4.19 | $ 19.14 | $ 39,810 |
| Coal Mining | 1,050 | 2.49 | $ 30.74 | $ 63,930 |
| Warehousing and Storage | 950 | 0.05 | $ 20.65 | $ 42,950 |
| Merchant Wholesalers, Durable Goods (4232, 4233, 4235, 4236, 4237, and 4239 only) | 770 | 0.05 | $ 19.16 | $ 39,860 |
Industries with the highest concentration of employment in Conveyor Operators and Tenders:
| Industry | Employment (1) | Percent of industry employment | Hourly mean wage | Annual mean wage (2) |
|---|---|---|---|---|
| Farm Product Raw Material Merchant Wholesalers | 2,950 | 4.19 | $ 19.14 | $ 39,810 |
| Coal Mining | 1,050 | 2.49 | $ 30.74 | $ 63,930 |
| Grain and Oilseed Milling | 740 | 1.13 | $ 24.13 | $ 50,190 |
| Couriers and Express Delivery Services | 9,930 | 1.07 | $ 18.38 | $ 38,230 |
| Sawmills and Wood Preservation | 250 | 0.27 | $ 21.30 | $ 44,300 |
Top paying industries for Conveyor Operators and Tenders:
| Industry | Employment (1) | Percent of industry employment | Hourly mean wage | Annual mean wage (2) |
|---|---|---|---|---|
| Electric Power Generation, Transmission and Distribution | 160 | 0.04 | $ 44.01 | $ 91,540 |
| Federal, State, and Local Government, excluding State and Local Government Schools and Hospitals and the U.S. Postal Service (OEWS Designation) | 30 | (7) | $ 34.99 | $ 72,780 |
| Nonmetallic Mineral Mining and Quarrying | 190 | 0.19 | $ 32.25 | $ 67,090 |
| Pulp, Paper, and Paperboard Mills | 80 | 0.09 | $ 31.62 | $ 65,760 |
| Coal Mining | 1,050 | 2.49 | $ 30.74 | $ 63,930 |
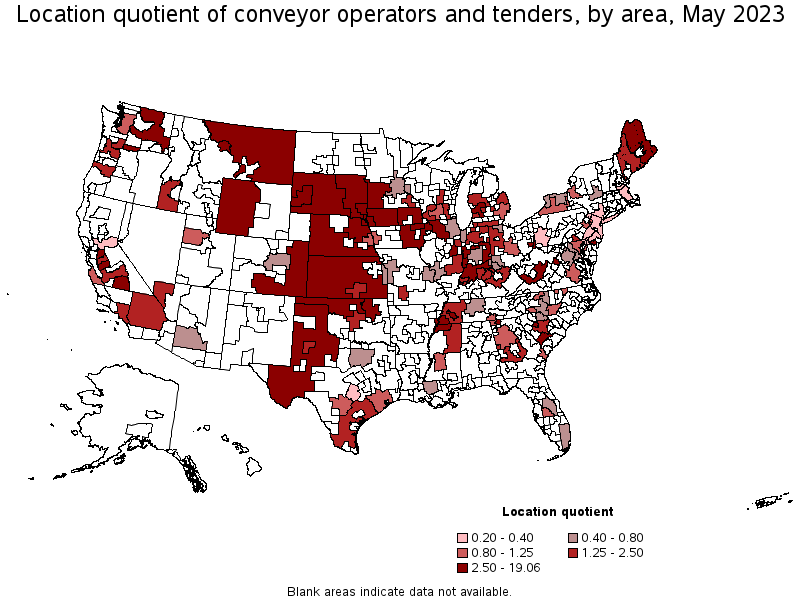
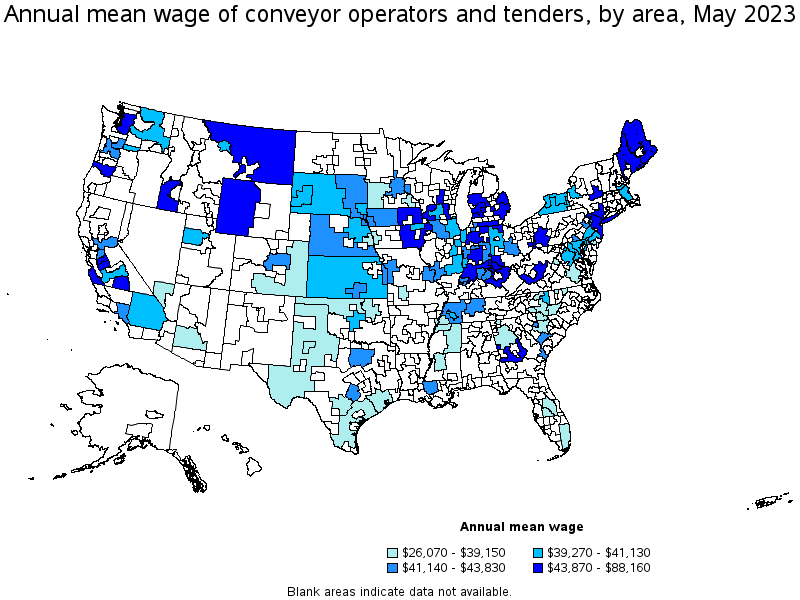
States and areas with the highest published employment, location quotients, and wages for Conveyor Operators and Tenders are provided. For a list of all areas with employment in Conveyor Operators and Tenders, see the Create Customized Tables function.
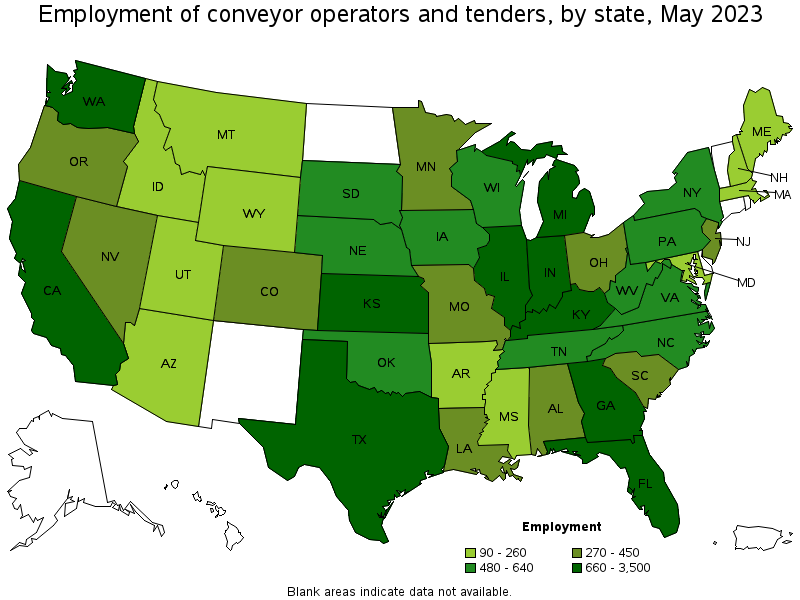
States with the highest employment level in Conveyor Operators and Tenders:
| State | Employment (1) | Employment per thousand jobs | Location quotient (9) | Hourly mean wage | Annual mean wage (2) |
|---|---|---|---|---|---|
| California | 3,500 | 0.19 | 1.20 | $ 20.47 | $ 42,580 |
| Texas | 2,030 | 0.15 | 0.92 | $ 18.12 | $ 37,690 |
| Kentucky | 1,190 | 0.60 | 3.72 | $ 28.15 | $ 58,550 |
| Michigan | 950 | 0.22 | 1.34 | $ 23.79 | $ 49,480 |
| Kansas | 910 | 0.65 | 3.99 | $ 19.31 | $ 40,160 |
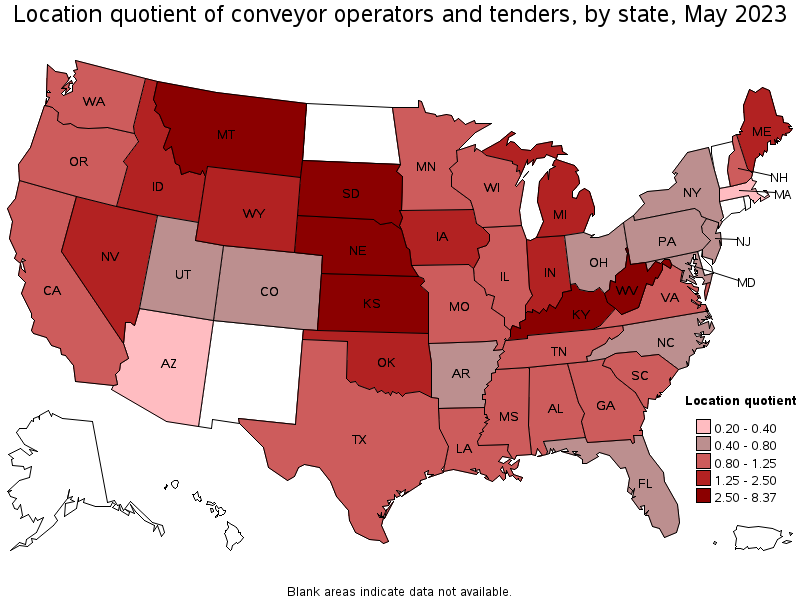
States with the highest concentration of jobs and location quotients in Conveyor Operators and Tenders:
| State | Employment (1) | Employment per thousand jobs | Location quotient (9) | Hourly mean wage | Annual mean wage (2) |
|---|---|---|---|---|---|
| South Dakota | 600 | 1.36 | 8.37 | $ 19.56 | $ 40,680 |
| West Virginia | 610 | 0.89 | 5.48 | $ 29.64 | $ 61,660 |
| Kansas | 910 | 0.65 | 3.99 | $ 19.31 | $ 40,160 |
| Kentucky | 1,190 | 0.60 | 3.72 | $ 28.15 | $ 58,550 |
| Nebraska | 510 | 0.51 | 3.11 | $ 19.59 | $ 40,740 |
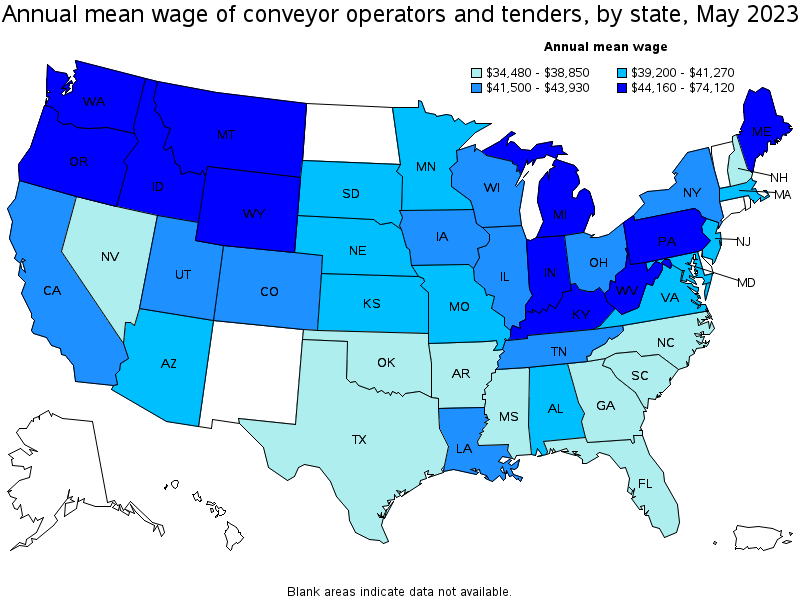
Top paying states for Conveyor Operators and Tenders:
| State | Employment (1) | Employment per thousand jobs | Location quotient (9) | Hourly mean wage | Annual mean wage (2) |
|---|---|---|---|---|---|
| Wyoming | 90 | 0.34 | 2.09 | $ 35.63 | $ 74,120 |
| West Virginia | 610 | 0.89 | 5.48 | $ 29.64 | $ 61,660 |
| Kentucky | 1,190 | 0.60 | 3.72 | $ 28.15 | $ 58,550 |
| Michigan | 950 | 0.22 | 1.34 | $ 23.79 | $ 49,480 |
| Idaho | 260 | 0.32 | 1.95 | $ 22.34 | $ 46,470 |
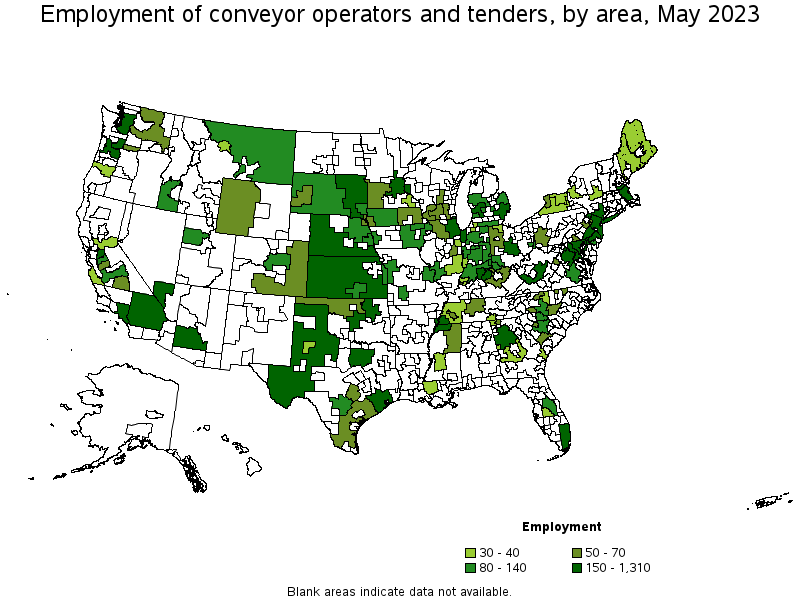
Metropolitan areas with the highest employment level in Conveyor Operators and Tenders:
| Metropolitan area | Employment (1) | Employment per thousand jobs | Location quotient (9) | Hourly mean wage | Annual mean wage (2) |
|---|---|---|---|---|---|
| Los Angeles-Long Beach-Anaheim, CA | 1,310 | 0.21 | 1.30 | $ 19.78 | $ 41,140 |
| Atlanta-Sandy Springs-Roswell, GA | 550 | 0.19 | 1.20 | $ 18.40 | $ 38,270 |
| New York-Newark-Jersey City, NY-NJ-PA | 470 | 0.05 | 0.30 | $ 21.89 | $ 45,520 |
| Dallas-Fort Worth-Arlington, TX | 440 | 0.11 | 0.69 | $ 20.81 | $ 43,280 |
| Riverside-San Bernardino-Ontario, CA | 420 | 0.25 | 1.55 | $ 18.88 | $ 39,270 |
| Houston-The Woodlands-Sugar Land, TX | 420 | 0.13 | 0.81 | $ 17.39 | $ 36,180 |
| Memphis, TN-MS-AR | 410 | 0.65 | 4.03 | $ 18.11 | $ 37,660 |
| Chicago-Naperville-Elgin, IL-IN-WI | 360 | 0.08 | 0.49 | $ 19.69 | $ 40,960 |
| Seattle-Tacoma-Bellevue, WA | 340 | 0.16 | 1.01 | $ 21.80 | $ 45,340 |
| Detroit-Warren-Dearborn, MI | 300 | 0.16 | 0.97 | $ 22.10 | $ 45,960 |
Metropolitan areas with the highest concentration of jobs and location quotients in Conveyor Operators and Tenders:
| Metropolitan area | Employment (1) | Employment per thousand jobs | Location quotient (9) | Hourly mean wage | Annual mean wage (2) |
|---|---|---|---|---|---|
| Wheeling, WV-OH | 110 | 1.95 | 11.99 | $ 29.96 | $ 62,310 |
| Vineland-Bridgeton, NJ | 120 | 1.85 | 11.40 | $ 16.53 | $ 34,390 |
| Great Falls, MT | 40 | 1.03 | 6.36 | $ 19.52 | $ 40,600 |
| Dalton, GA | 60 | 0.87 | 5.36 | $ 16.33 | $ 33,960 |
| Sioux Falls, SD | 140 | 0.85 | 5.21 | $ 19.19 | $ 39,910 |
| Stockton-Lodi, CA | 230 | 0.81 | 4.99 | $ 20.71 | $ 43,080 |
| Merced, CA | 60 | 0.78 | 4.81 | $ 24.98 | $ 51,960 |
| Sioux City, IA-NE-SD | 70 | 0.76 | 4.67 | $ 20.86 | $ 43,380 |
| Jackson, TN | 50 | 0.75 | 4.63 | $ 18.98 | $ 39,490 |
| Harrisonburg, VA | 50 | 0.72 | 4.44 | $ 17.83 | $ 37,080 |
Top paying metropolitan areas for Conveyor Operators and Tenders:
| Metropolitan area | Employment (1) | Employment per thousand jobs | Location quotient (9) | Hourly mean wage | Annual mean wage (2) |
|---|---|---|---|---|---|
| Wheeling, WV-OH | 110 | 1.95 | 11.99 | $ 29.96 | $ 62,310 |
| Merced, CA | 60 | 0.78 | 4.81 | $ 24.98 | $ 51,960 |
| Grand Rapids-Wyoming, MI | 240 | 0.44 | 2.73 | $ 24.53 | $ 51,020 |
| Pittsburgh, PA | 60 | 0.06 | 0.35 | $ 23.74 | $ 49,380 |
| Eugene, OR | 40 | 0.25 | 1.51 | $ 23.09 | $ 48,030 |
| Albany-Schenectady-Troy, NY | 40 | 0.09 | 0.56 | $ 22.62 | $ 47,040 |
| Cincinnati, OH-KY-IN | 90 | 0.08 | 0.52 | $ 22.36 | $ 46,510 |
| Boise City, ID | 100 | 0.27 | 1.66 | $ 22.29 | $ 46,370 |
| Indianapolis-Carmel-Anderson, IN | 100 | 0.10 | 0.60 | $ 22.19 | $ 46,160 |
| Detroit-Warren-Dearborn, MI | 300 | 0.16 | 0.97 | $ 22.10 | $ 45,960 |
Nonmetropolitan areas with the highest employment in Conveyor Operators and Tenders:
| Nonmetropolitan area | Employment (1) | Employment per thousand jobs | Location quotient (9) | Hourly mean wage | Annual mean wage (2) |
|---|---|---|---|---|---|
| Kansas nonmetropolitan area | 760 | 1.96 | 12.04 | $ 19.00 | $ 39,530 |
| East South Dakota nonmetropolitan area | 280 | 2.16 | 13.28 | $ 19.85 | $ 41,300 |
| Southern West Virginia nonmetropolitan area | 220 | 3.10 | 19.06 | $ 30.98 | $ 64,450 |
| West Texas Region of Texas nonmetropolitan area | 200 | 1.01 | 6.20 | $ 17.05 | $ 35,470 |
| South Nebraska nonmetropolitan area | 180 | 1.20 | 7.38 | $ 20.18 | $ 41,970 |
Nonmetropolitan areas with the highest concentration of jobs and location quotients in Conveyor Operators and Tenders:
| Nonmetropolitan area | Employment (1) | Employment per thousand jobs | Location quotient (9) | Hourly mean wage | Annual mean wage (2) |
|---|---|---|---|---|---|
| Southern West Virginia nonmetropolitan area | 220 | 3.10 | 19.06 | $ 30.98 | $ 64,450 |
| East South Dakota nonmetropolitan area | 280 | 2.16 | 13.28 | $ 19.85 | $ 41,300 |
| West South Dakota nonmetropolitan area | 120 | 2.00 | 12.33 | $ 19.36 | $ 40,260 |
| Kansas nonmetropolitan area | 760 | 1.96 | 12.04 | $ 19.00 | $ 39,530 |
| Northeast Nebraska nonmetropolitan area | 130 | 1.43 | 8.80 | $ 19.56 | $ 40,670 |
Top paying nonmetropolitan areas for Conveyor Operators and Tenders:
| Nonmetropolitan area | Employment (1) | Employment per thousand jobs | Location quotient (9) | Hourly mean wage | Annual mean wage (2) |
|---|---|---|---|---|---|
| Western Wyoming nonmetropolitan area | 70 | 0.66 | 4.04 | $ 42.38 | $ 88,160 |
| Southern West Virginia nonmetropolitan area | 220 | 3.10 | 19.06 | $ 30.98 | $ 64,450 |
| Southwest Maine nonmetropolitan area | 40 | 0.22 | 1.34 | $ 29.97 | $ 62,330 |
| East-Central Montana nonmetropolitan area | 80 | 1.27 | 7.85 | $ 25.65 | $ 53,350 |
| Southern Indiana nonmetropolitan area | 80 | 0.41 | 2.53 | $ 25.39 | $ 52,810 |
These estimates are calculated with data collected from employers in all industry sectors, all metropolitan and nonmetropolitan areas, and all states and the District of Columbia. The top employment and wage figures are provided above. The complete list is available in the downloadable XLS files.
The percentile wage estimate is the value of a wage below which a certain percent of workers fall. The median wage is the 50th percentile wage estimate—50 percent of workers earn less than the median and 50 percent of workers earn more than the median. More about percentile wages.
(1) Estimates for detailed occupations do not sum to the totals because the totals include occupations not shown separately. Estimates do not include self-employed workers.
(2) Annual wages have been calculated by multiplying the hourly mean wage by a "year-round, full-time" hours figure of 2,080 hours; for those occupations where there is not an hourly wage published, the annual wage has been directly calculated from the reported survey data.
(3) The relative standard error (RSE) is a measure of the reliability of a survey statistic. The smaller the relative standard error, the more precise the estimate.
(7) The value is less than .005 percent of industry employment.
(9) The location quotient is the ratio of the area concentration of occupational employment to the national average concentration. A location quotient greater than one indicates the occupation has a higher share of employment than average, and a location quotient less than one indicates the occupation is less prevalent in the area than average.
Other OEWS estimates and related information:
May 2023 National Occupational Employment and Wage Estimates
May 2023 State Occupational Employment and Wage Estimates
May 2023 Metropolitan and Nonmetropolitan Area Occupational Employment and Wage Estimates
May 2023 National Industry-Specific Occupational Employment and Wage Estimates
Last Modified Date: April 3, 2024