
An official website of the United States government
An official website of the United States government
The .gov means it's official.
Federal government websites often end in .gov or .mil. Before sharing sensitive information,
make sure you're on a federal government site.
The site is secure.
The
https:// ensures that you are connecting to the official website and that any
information you provide is encrypted and transmitted securely.
Plan, direct, or coordinate entertainment and recreational activities and operations of a recreational facility, including cruise ships and parks.
Employment estimate and mean wage estimates for Entertainment and Recreation Managers, Except Gambling:
| Employment (1) | Employment RSE (3) |
Mean hourly wage |
Mean annual wage (2) |
Wage RSE (3) |
|---|---|---|---|---|
| 29,690 | 2.1 % | $ 40.42 | $ 84,080 | 1.2 % |
Percentile wage estimates for Entertainment and Recreation Managers, Except Gambling:
| Percentile | 10% | 25% | 50% (Median) |
75% | 90% |
|---|---|---|---|---|---|
| Hourly Wage | $ 20.54 | $ 25.71 | $ 35.32 | $ 47.68 | $ 64.27 |
| Annual Wage (2) | $ 42,730 | $ 53,480 | $ 73,460 | $ 99,170 | $ 133,680 |
Industries with the highest published employment and wages for Entertainment and Recreation Managers, Except Gambling are provided. For a list of all industries with employment in Entertainment and Recreation Managers, Except Gambling, see the Create Customized Tables function.
Industries with the highest levels of employment in Entertainment and Recreation Managers, Except Gambling:
| Industry | Employment (1) | Percent of industry employment | Hourly mean wage | Annual mean wage (2) |
|---|---|---|---|---|
| Other Amusement and Recreation Industries | 11,070 | 0.81 | $ 37.51 | $ 78,020 |
| Local Government, excluding Schools and Hospitals (OEWS Designation) | 5,960 | 0.11 | $ 45.67 | $ 95,000 |
| Amusement Parks and Arcades | 1,340 | 0.59 | $ 43.57 | $ 90,620 |
| Other Schools and Instruction | 1,000 | 0.20 | $ 30.38 | $ 63,190 |
| Traveler Accommodation | 1,000 | 0.05 | $ 44.83 | $ 93,250 |
Industries with the highest concentration of employment in Entertainment and Recreation Managers, Except Gambling:
| Industry | Employment (1) | Percent of industry employment | Hourly mean wage | Annual mean wage (2) |
|---|---|---|---|---|
| RV (Recreational Vehicle) Parks and Recreational Camps | 680 | 1.05 | $ 40.00 | $ 83,210 |
| Other Amusement and Recreation Industries | 11,070 | 0.81 | $ 37.51 | $ 78,020 |
| Amusement Parks and Arcades | 1,340 | 0.59 | $ 43.57 | $ 90,620 |
| Promoters of Performing Arts, Sports, and Similar Events | 910 | 0.56 | $ 52.41 | $ 109,020 |
| Spectator Sports | 800 | 0.53 | $ 48.64 | $ 101,170 |
Top paying industries for Entertainment and Recreation Managers, Except Gambling:
| Industry | Employment (1) | Percent of industry employment | Hourly mean wage | Annual mean wage (2) |
|---|---|---|---|---|
| Deep Sea, Coastal, and Great Lakes Water Transportation | 30 | 0.09 | $ 74.76 | $ 155,500 |
| Management of Companies and Enterprises | 130 | (7) | $ 73.17 | $ 152,180 |
| Rental and Leasing Services (5322, 5323, and 5324 only) | 40 | 0.01 | $ 54.26 | $ 112,870 |
| Promoters of Performing Arts, Sports, and Similar Events | 910 | 0.56 | $ 52.41 | $ 109,020 |
| Spectator Sports | 800 | 0.53 | $ 48.64 | $ 101,170 |
States and areas with the highest published employment, location quotients, and wages for Entertainment and Recreation Managers, Except Gambling are provided. For a list of all areas with employment in Entertainment and Recreation Managers, Except Gambling, see the Create Customized Tables function.

States with the highest employment level in Entertainment and Recreation Managers, Except Gambling:
| State | Employment (1) | Employment per thousand jobs | Location quotient (9) | Hourly mean wage | Annual mean wage (2) |
|---|---|---|---|---|---|
| California | 8,240 | 0.46 | 2.35 | $ 44.82 | $ 93,220 |
| Illinois | 2,270 | 0.38 | 1.93 | $ 35.88 | $ 74,630 |
| Texas | 2,220 | 0.16 | 0.84 | $ 37.41 | $ 77,810 |
| Florida | 2,170 | 0.23 | 1.16 | $ 41.13 | $ 85,550 |
| New Jersey | 1,670 | 0.40 | 2.03 | $ 44.90 | $ 93,390 |
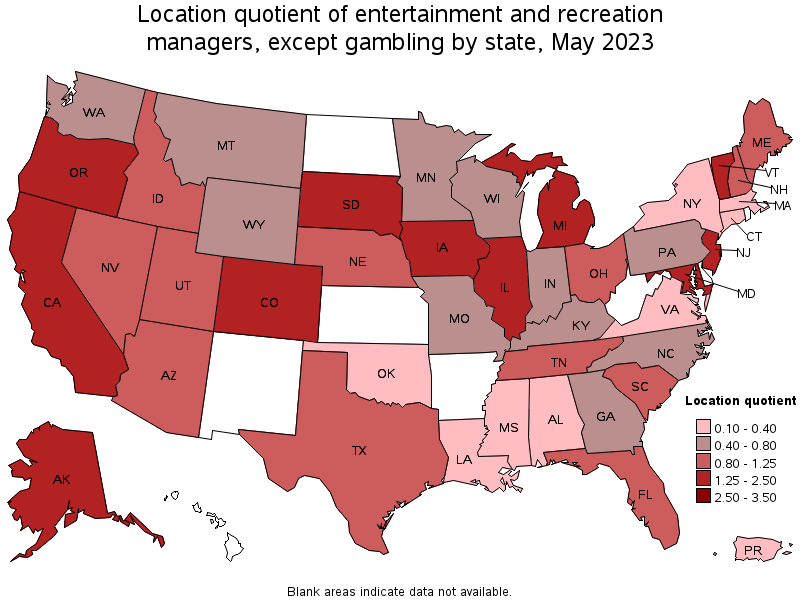
States with the highest concentration of jobs and location quotients in Entertainment and Recreation Managers, Except Gambling:
| State | Employment (1) | Employment per thousand jobs | Location quotient (9) | Hourly mean wage | Annual mean wage (2) |
|---|---|---|---|---|---|
| California | 8,240 | 0.46 | 2.35 | $ 44.82 | $ 93,220 |
| Vermont | 130 | 0.44 | 2.25 | $ 38.03 | $ 79,090 |
| New Jersey | 1,670 | 0.40 | 2.03 | $ 44.90 | $ 93,390 |
| Oregon | 740 | 0.38 | 1.95 | $ 36.58 | $ 76,090 |
| Illinois | 2,270 | 0.38 | 1.93 | $ 35.88 | $ 74,630 |
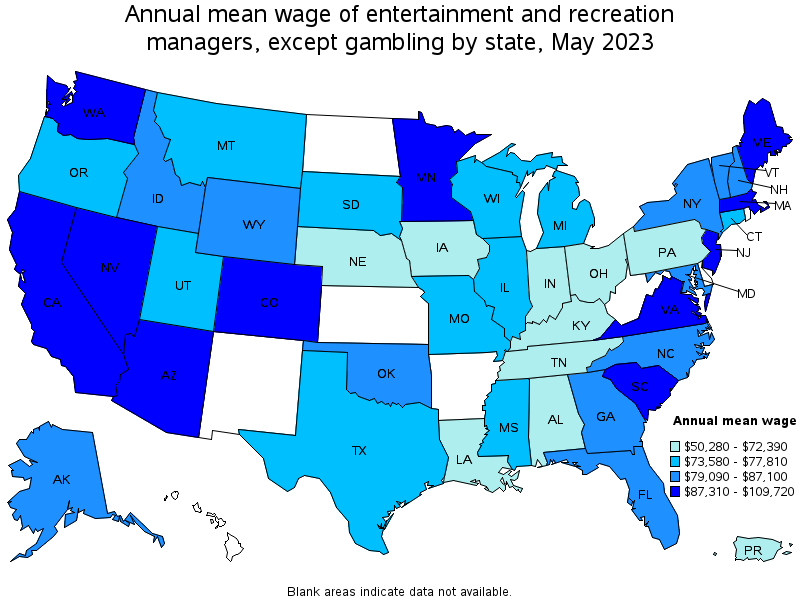
Top paying states for Entertainment and Recreation Managers, Except Gambling:
| State | Employment (1) | Employment per thousand jobs | Location quotient (9) | Hourly mean wage | Annual mean wage (2) |
|---|---|---|---|---|---|
| Nevada | 260 | 0.18 | 0.90 | $ 52.75 | $ 109,720 |
| Washington | 440 | 0.12 | 0.64 | $ 51.33 | $ 106,770 |
| Virginia | 100 | 0.03 | 0.13 | $ 48.90 | $ 101,720 |
| Minnesota | 310 | 0.11 | 0.55 | $ 48.58 | $ 101,050 |
| Colorado | 690 | 0.24 | 1.25 | $ 46.34 | $ 96,380 |
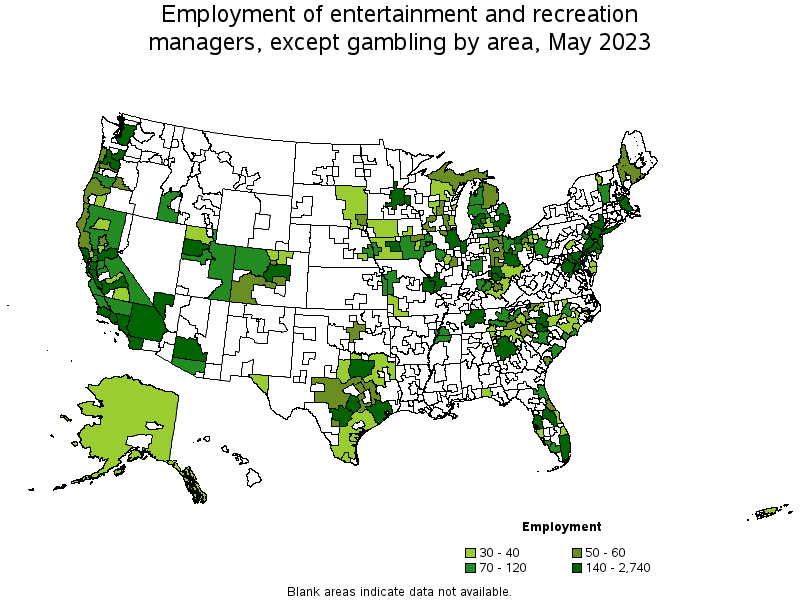
Metropolitan areas with the highest employment level in Entertainment and Recreation Managers, Except Gambling:
| Metropolitan area | Employment (1) | Employment per thousand jobs | Location quotient (9) | Hourly mean wage | Annual mean wage (2) |
|---|---|---|---|---|---|
| Los Angeles-Long Beach-Anaheim, CA | 2,740 | 0.44 | 2.27 | $ 46.71 | $ 97,160 |
| Chicago-Naperville-Elgin, IL-IN-WI | 1,770 | 0.39 | 2.01 | $ 36.86 | $ 76,660 |
| New York-Newark-Jersey City, NY-NJ-PA | 1,690 | 0.18 | 0.91 | $ 45.20 | $ 94,010 |
| San Francisco-Oakland-Hayward, CA | 1,070 | 0.44 | 2.27 | $ 52.41 | $ 109,000 |
| Miami-Fort Lauderdale-West Palm Beach, FL | 900 | 0.33 | 1.69 | $ 40.01 | $ 83,220 |
| San Diego-Carlsbad, CA | 850 | 0.56 | 2.85 | $ 43.46 | $ 90,400 |
| Riverside-San Bernardino-Ontario, CA | 710 | 0.43 | 2.18 | $ 40.23 | $ 83,690 |
| Dallas-Fort Worth-Arlington, TX | 700 | 0.18 | 0.90 | $ 41.78 | $ 86,910 |
| Sacramento--Roseville--Arden-Arcade, CA | 620 | 0.60 | 3.04 | $ 42.34 | $ 88,070 |
| Houston-The Woodlands-Sugar Land, TX | 510 | 0.16 | 0.82 | $ 36.03 | $ 74,940 |
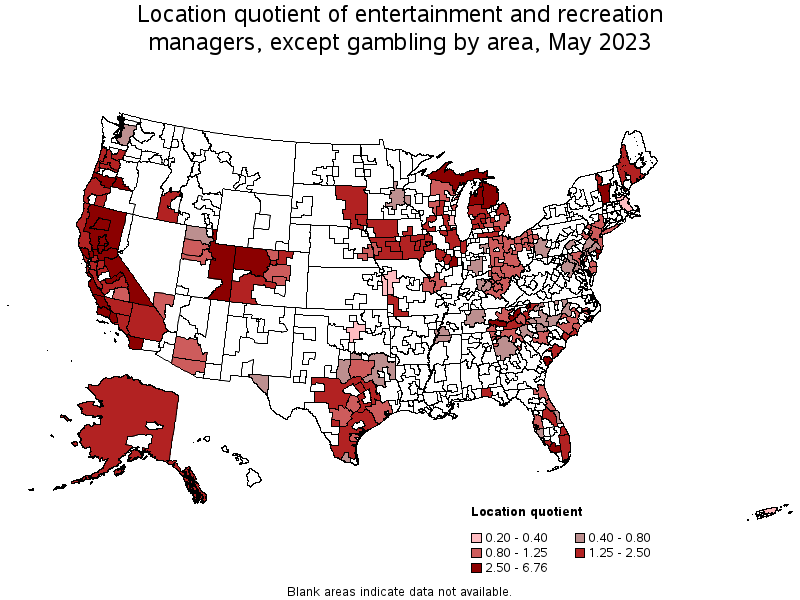
Metropolitan areas with the highest concentration of jobs and location quotients in Entertainment and Recreation Managers, Except Gambling:
| Metropolitan area | Employment (1) | Employment per thousand jobs | Location quotient (9) | Hourly mean wage | Annual mean wage (2) |
|---|---|---|---|---|---|
| Yuba City, CA | 40 | 0.81 | 4.13 | $ 34.05 | $ 70,820 |
| Ocean City, NJ | 30 | 0.80 | 4.08 | $ 37.44 | $ 77,880 |
| Hilton Head Island-Bluffton-Beaufort, SC | 60 | 0.73 | 3.72 | $ 46.29 | $ 96,280 |
| Santa Maria-Santa Barbara, CA | 140 | 0.71 | 3.61 | $ 42.26 | $ 87,900 |
| Santa Rosa, CA | 140 | 0.67 | 3.42 | $ 41.57 | $ 86,470 |
| Chico, CA | 50 | 0.61 | 3.12 | $ 37.89 | $ 78,810 |
| Madera, CA | 30 | 0.60 | 3.05 | $ 36.14 | $ 75,170 |
| Sacramento--Roseville--Arden-Arcade, CA | 620 | 0.60 | 3.04 | $ 42.34 | $ 88,070 |
| Salinas, CA | 110 | 0.59 | 3.04 | $ 49.95 | $ 103,900 |
| Oxnard-Thousand Oaks-Ventura, CA | 190 | 0.59 | 3.03 | $ 37.65 | $ 78,310 |
Top paying metropolitan areas for Entertainment and Recreation Managers, Except Gambling:
| Metropolitan area | Employment (1) | Employment per thousand jobs | Location quotient (9) | Hourly mean wage | Annual mean wage (2) |
|---|---|---|---|---|---|
| Las Vegas-Henderson-Paradise, NV | 220 | 0.20 | 1.04 | $ 55.20 | $ 114,810 |
| Cape Coral-Fort Myers, FL | 70 | 0.25 | 1.29 | $ 53.36 | $ 111,000 |
| San Francisco-Oakland-Hayward, CA | 1,070 | 0.44 | 2.27 | $ 52.41 | $ 109,000 |
| Seattle-Tacoma-Bellevue, WA | 290 | 0.14 | 0.72 | $ 51.68 | $ 107,490 |
| Fort Collins, CO | 40 | 0.22 | 1.12 | $ 50.01 | $ 104,010 |
| Salinas, CA | 110 | 0.59 | 3.04 | $ 49.95 | $ 103,900 |
| Minneapolis-St. Paul-Bloomington, MN-WI | 240 | 0.13 | 0.65 | $ 49.59 | $ 103,160 |
| Myrtle Beach-Conway-North Myrtle Beach, SC-NC | 70 | 0.37 | 1.87 | $ 49.49 | $ 102,930 |
| Naples-Immokalee-Marco Island, FL | 90 | 0.54 | 2.79 | $ 49.39 | $ 102,720 |
| Denver-Aurora-Lakewood, CO | 310 | 0.20 | 1.01 | $ 47.93 | $ 99,700 |
Nonmetropolitan areas with the highest employment in Entertainment and Recreation Managers, Except Gambling:
| Nonmetropolitan area | Employment (1) | Employment per thousand jobs | Location quotient (9) | Hourly mean wage | Annual mean wage (2) |
|---|---|---|---|---|---|
| Eastern Utah nonmetropolitan area | 120 | 1.32 | 6.76 | $ 34.68 | $ 72,130 |
| Northwest Lower Peninsula of Michigan nonmetropolitan area | 110 | 0.88 | 4.51 | $ 30.97 | $ 64,420 |
| Northwest Colorado nonmetropolitan area | 100 | 0.78 | 3.98 | $ 47.76 | $ 99,340 |
| Balance of Lower Peninsula of Michigan nonmetropolitan area | 90 | 0.35 | 1.78 | $ 29.70 | $ 61,780 |
| East Tennessee nonmetropolitan area | 90 | 0.63 | 3.23 | $ 22.63 | $ 47,060 |
Nonmetropolitan areas with the highest concentration of jobs and location quotients in Entertainment and Recreation Managers, Except Gambling:
| Nonmetropolitan area | Employment (1) | Employment per thousand jobs | Location quotient (9) | Hourly mean wage | Annual mean wage (2) |
|---|---|---|---|---|---|
| Eastern Utah nonmetropolitan area | 120 | 1.32 | 6.76 | $ 34.68 | $ 72,130 |
| Eastern Sierra-Mother Lode Region of California nonmetropolitan area | 70 | 1.19 | 6.07 | $ 40.10 | $ 83,410 |
| Northwest Lower Peninsula of Michigan nonmetropolitan area | 110 | 0.88 | 4.51 | $ 30.97 | $ 64,420 |
| North Valley-Northern Mountains Region of California nonmetropolitan area | 80 | 0.83 | 4.27 | $ 37.67 | $ 78,360 |
| Northeast Lower Peninsula of Michigan nonmetropolitan area | 60 | 0.78 | 4.01 | $ 30.68 | $ 63,800 |
Top paying nonmetropolitan areas for Entertainment and Recreation Managers, Except Gambling:
| Nonmetropolitan area | Employment (1) | Employment per thousand jobs | Location quotient (9) | Hourly mean wage | Annual mean wage (2) |
|---|---|---|---|---|---|
| Northwest Colorado nonmetropolitan area | 100 | 0.78 | 3.98 | $ 47.76 | $ 99,340 |
| Southwest Maine nonmetropolitan area | 60 | 0.34 | 1.74 | $ 47.73 | $ 99,290 |
| Southwest Colorado nonmetropolitan area | 50 | 0.46 | 2.34 | $ 40.65 | $ 84,560 |
| Alaska nonmetropolitan area | 40 | 0.37 | 1.87 | $ 40.59 | $ 84,430 |
| Eastern Sierra-Mother Lode Region of California nonmetropolitan area | 70 | 1.19 | 6.07 | $ 40.10 | $ 83,410 |
These estimates are calculated with data collected from employers in all industry sectors, all metropolitan and nonmetropolitan areas, and all states and the District of Columbia. The top employment and wage figures are provided above. The complete list is available in the downloadable XLS files.
The percentile wage estimate is the value of a wage below which a certain percent of workers fall. The median wage is the 50th percentile wage estimate—50 percent of workers earn less than the median and 50 percent of workers earn more than the median. More about percentile wages.
(1) Estimates for detailed occupations do not sum to the totals because the totals include occupations not shown separately. Estimates do not include self-employed workers.
(2) Annual wages have been calculated by multiplying the hourly mean wage by a "year-round, full-time" hours figure of 2,080 hours; for those occupations where there is not an hourly wage published, the annual wage has been directly calculated from the reported survey data.
(3) The relative standard error (RSE) is a measure of the reliability of a survey statistic. The smaller the relative standard error, the more precise the estimate.
(7) The value is less than .005 percent of industry employment.
(9) The location quotient is the ratio of the area concentration of occupational employment to the national average concentration. A location quotient greater than one indicates the occupation has a higher share of employment than average, and a location quotient less than one indicates the occupation is less prevalent in the area than average.
Other OEWS estimates and related information:
May 2023 National Occupational Employment and Wage Estimates
May 2023 State Occupational Employment and Wage Estimates
May 2023 Metropolitan and Nonmetropolitan Area Occupational Employment and Wage Estimates
May 2023 National Industry-Specific Occupational Employment and Wage Estimates
Last Modified Date: April 3, 2024