
An official website of the United States government
An official website of the United States government
The .gov means it's official.
Federal government websites often end in .gov or .mil. Before sharing sensitive information,
make sure you're on a federal government site.
The site is secure.
The
https:// ensures that you are connecting to the official website and that any
information you provide is encrypted and transmitted securely.
Work with food scientists or technologists to perform standardized qualitative and quantitative tests to determine physical or chemical properties of food or beverage products. Includes technicians who assist in research and development of production technology, quality control, packaging, processing, and use of foods.
Employment estimate and mean wage estimates for Food Science Technicians:
| Employment (1) | Employment RSE (3) |
Mean hourly wage |
Mean annual wage (2) |
Wage RSE (3) |
|---|---|---|---|---|
| 15,190 | 3.0 % | $ 25.96 | $ 54,000 | 0.8 % |
Percentile wage estimates for Food Science Technicians:
| Percentile | 10% | 25% | 50% (Median) |
75% | 90% |
|---|---|---|---|---|---|
| Hourly Wage | $ 17.93 | $ 20.08 | $ 23.60 | $ 29.51 | $ 35.88 |
| Annual Wage (2) | $ 37,290 | $ 41,770 | $ 49,090 | $ 61,390 | $ 74,630 |
Industries with the highest published employment and wages for Food Science Technicians are provided. For a list of all industries with employment in Food Science Technicians, see the Create Customized Tables function.
Industries with the highest levels of employment in Food Science Technicians:
| Industry | Employment (1) | Percent of industry employment | Hourly mean wage | Annual mean wage (2) |
|---|---|---|---|---|
| Dairy Product Manufacturing | 1,990 | 1.23 | $ 25.06 | $ 52,120 |
| Other Food Manufacturing | 1,910 | 0.74 | $ 26.11 | $ 54,320 |
| Fruit and Vegetable Preserving and Specialty Food Manufacturing | 1,670 | 0.98 | $ 22.67 | $ 47,150 |
| Beverage Manufacturing | 1,600 | 0.51 | $ 28.82 | $ 59,940 |
| Scientific Research and Development Services | 970 | 0.11 | $ 36.33 | $ 75,560 |
Industries with the highest concentration of employment in Food Science Technicians:
| Industry | Employment (1) | Percent of industry employment | Hourly mean wage | Annual mean wage (2) |
|---|---|---|---|---|
| Dairy Product Manufacturing | 1,990 | 1.23 | $ 25.06 | $ 52,120 |
| Grain and Oilseed Milling | 670 | 1.04 | $ 26.36 | $ 54,820 |
| Fruit and Vegetable Preserving and Specialty Food Manufacturing | 1,670 | 0.98 | $ 22.67 | $ 47,150 |
| Other Food Manufacturing | 1,910 | 0.74 | $ 26.11 | $ 54,320 |
| Beverage Manufacturing | 1,600 | 0.51 | $ 28.82 | $ 59,940 |
Top paying industries for Food Science Technicians:
| Industry | Employment (1) | Percent of industry employment | Hourly mean wage | Annual mean wage (2) |
|---|---|---|---|---|
| Scientific Research and Development Services | 970 | 0.11 | $ 36.33 | $ 75,560 |
| Management of Companies and Enterprises | 600 | 0.02 | $ 31.14 | $ 64,770 |
| Beverage Manufacturing | 1,600 | 0.51 | $ 28.82 | $ 59,940 |
| Restaurants and Other Eating Places | (8) | (8) | $ 27.57 | $ 57,340 |
| Warehousing and Storage | 130 | 0.01 | $ 27.45 | $ 57,090 |
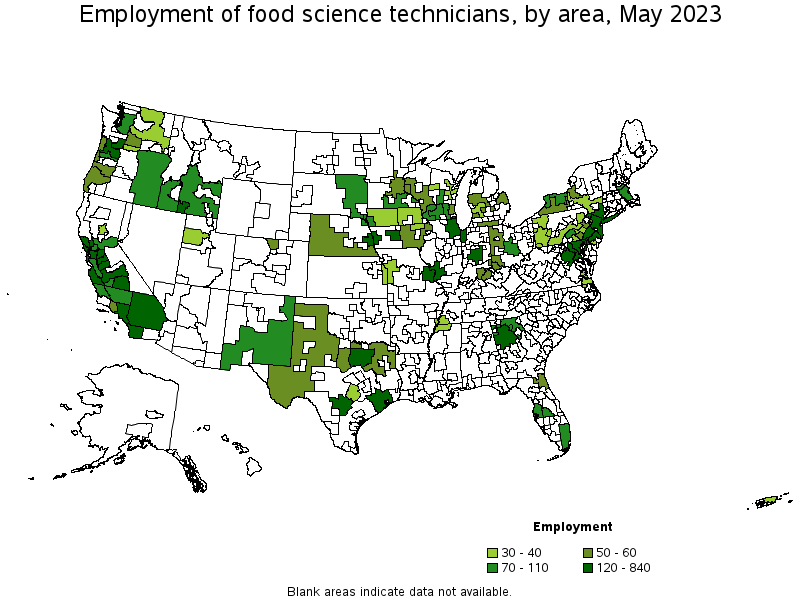
States and areas with the highest published employment, location quotients, and wages for Food Science Technicians are provided. For a list of all areas with employment in Food Science Technicians, see the Create Customized Tables function.
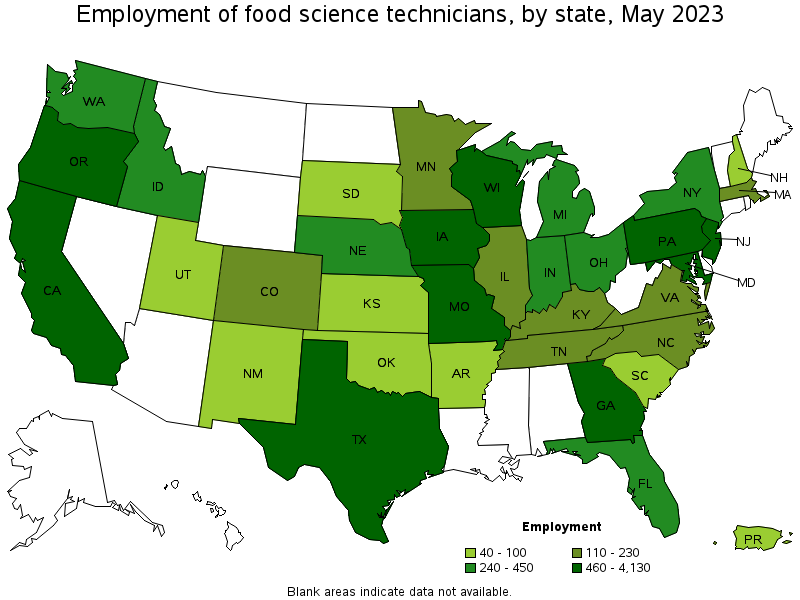
States with the highest employment level in Food Science Technicians:
| State | Employment (1) | Employment per thousand jobs | Location quotient (9) | Hourly mean wage | Annual mean wage (2) |
|---|---|---|---|---|---|
| California | 4,130 | 0.23 | 2.30 | $ 26.22 | $ 54,540 |
| Texas | 1,160 | 0.09 | 0.86 | $ 24.47 | $ 50,900 |
| New Jersey | 760 | 0.18 | 1.81 | $ 28.04 | $ 58,330 |
| Pennsylvania | 750 | 0.13 | 1.26 | $ 23.80 | $ 49,500 |
| Maryland | 690 | 0.26 | 2.57 | $ 29.38 | $ 61,100 |
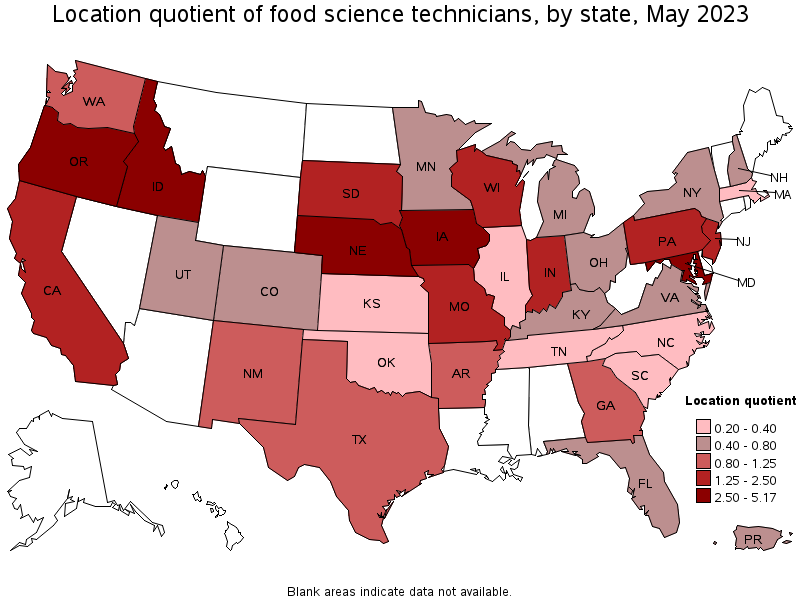
States with the highest concentration of jobs and location quotients in Food Science Technicians:
| State | Employment (1) | Employment per thousand jobs | Location quotient (9) | Hourly mean wage | Annual mean wage (2) |
|---|---|---|---|---|---|
| Idaho | 430 | 0.52 | 5.17 | $ 21.33 | $ 44,370 |
| Oregon | 630 | 0.32 | 3.24 | $ 23.63 | $ 49,160 |
| Iowa | 460 | 0.30 | 2.98 | $ 23.91 | $ 49,730 |
| Maryland | 690 | 0.26 | 2.57 | $ 29.38 | $ 61,100 |
| Nebraska | 250 | 0.25 | 2.53 | $ 21.62 | $ 44,960 |
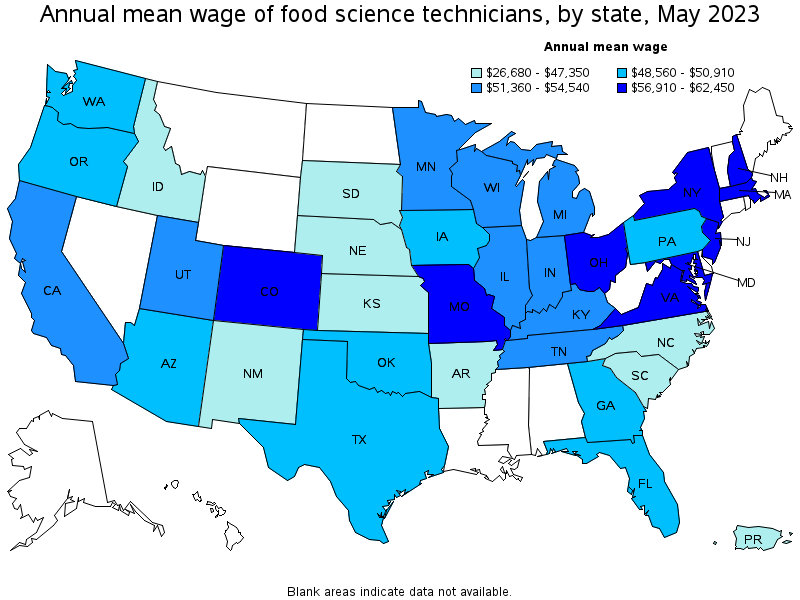
Top paying states for Food Science Technicians:
| State | Employment (1) | Employment per thousand jobs | Location quotient (9) | Hourly mean wage | Annual mean wage (2) |
|---|---|---|---|---|---|
| New Hampshire | 40 | 0.07 | 0.65 | $ 30.02 | $ 62,450 |
| Colorado | 120 | 0.04 | 0.41 | $ 29.75 | $ 61,890 |
| Ohio | 300 | 0.06 | 0.55 | $ 29.62 | $ 61,610 |
| Maryland | 690 | 0.26 | 2.57 | $ 29.38 | $ 61,100 |
| Massachusetts | 120 | 0.03 | 0.32 | $ 29.32 | $ 60,990 |
Metropolitan areas with the highest employment level in Food Science Technicians:
| Metropolitan area | Employment (1) | Employment per thousand jobs | Location quotient (9) | Hourly mean wage | Annual mean wage (2) |
|---|---|---|---|---|---|
| Los Angeles-Long Beach-Anaheim, CA | 840 | 0.14 | 1.37 | $ 26.50 | $ 55,120 |
| New York-Newark-Jersey City, NY-NJ-PA | 600 | 0.06 | 0.63 | $ 29.53 | $ 61,430 |
| Baltimore-Columbia-Towson, MD | 510 | 0.39 | 3.89 | $ 29.97 | $ 62,340 |
| Dallas-Fort Worth-Arlington, TX | 500 | 0.13 | 1.27 | $ 25.31 | $ 52,650 |
| San Francisco-Oakland-Hayward, CA | 380 | 0.16 | 1.58 | $ 29.71 | $ 61,790 |
| St. Louis, MO-IL | 350 | 0.26 | 2.61 | $ 28.78 | $ 59,860 |
| Washington-Arlington-Alexandria, DC-VA-MD-WV | 340 | 0.11 | 1.09 | $ 47.05 | $ 97,860 |
| Portland-Vancouver-Hillsboro, OR-WA | 300 | 0.25 | 2.46 | $ 25.64 | $ 53,330 |
| Philadelphia-Camden-Wilmington, PA-NJ-DE-MD | 280 | 0.10 | 1.00 | $ 25.79 | $ 53,640 |
| Riverside-San Bernardino-Ontario, CA | 280 | 0.17 | 1.66 | $ 24.22 | $ 50,370 |
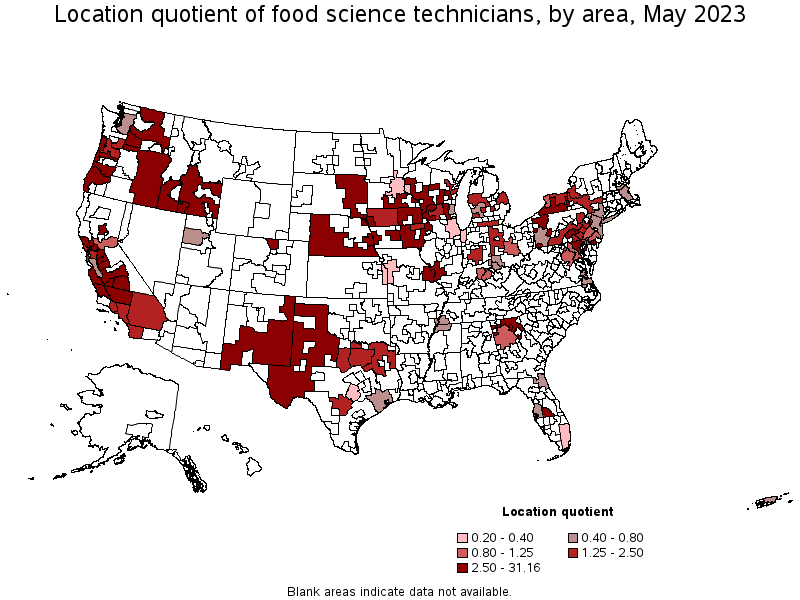
Metropolitan areas with the highest concentration of jobs and location quotients in Food Science Technicians:
| Metropolitan area | Employment (1) | Employment per thousand jobs | Location quotient (9) | Hourly mean wage | Annual mean wage (2) |
|---|---|---|---|---|---|
| Napa, CA | 240 | 3.12 | 31.16 | $ 29.16 | $ 60,650 |
| Merced, CA | 210 | 2.69 | 26.91 | $ 27.29 | $ 56,750 |
| Twin Falls, ID | 120 | 2.54 | 25.38 | $ 21.70 | $ 45,140 |
| Hanford-Corcoran, CA | 80 | 1.68 | 16.84 | $ 22.30 | $ 46,380 |
| Visalia-Porterville, CA | 250 | 1.47 | 14.69 | $ 25.16 | $ 52,340 |
| Modesto, CA | 240 | 1.25 | 12.52 | $ 24.68 | $ 51,330 |
| Sioux City, IA-NE-SD | 80 | 0.89 | 8.92 | $ 23.66 | $ 49,220 |
| Santa Rosa, CA | 170 | 0.84 | 8.40 | $ 27.31 | $ 56,800 |
| San Luis Obispo-Paso Robles-Arroyo Grande, CA | 90 | 0.78 | 7.79 | $ 25.38 | $ 52,780 |
| Gainesville, GA | 70 | 0.72 | 7.16 | $ 19.48 | $ 40,530 |
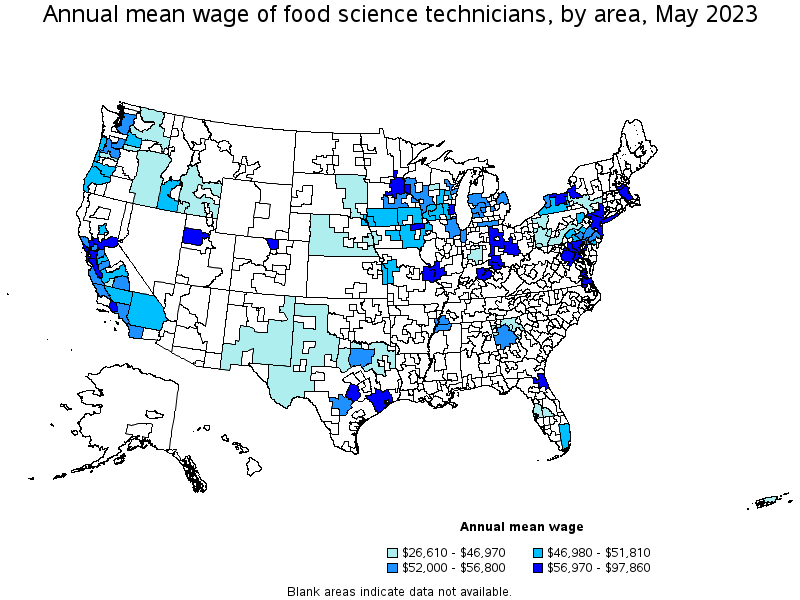
Top paying metropolitan areas for Food Science Technicians:
| Metropolitan area | Employment (1) | Employment per thousand jobs | Location quotient (9) | Hourly mean wage | Annual mean wage (2) |
|---|---|---|---|---|---|
| Washington-Arlington-Alexandria, DC-VA-MD-WV | 340 | 0.11 | 1.09 | $ 47.05 | $ 97,860 |
| Rochester, NY | 80 | 0.15 | 1.54 | $ 34.07 | $ 70,870 |
| Jacksonville, FL | 60 | 0.07 | 0.75 | $ 32.25 | $ 67,070 |
| Cincinnati, OH-KY-IN | 60 | 0.06 | 0.57 | $ 31.85 | $ 66,250 |
| Fort Collins, CO | 50 | 0.31 | 3.15 | $ 31.68 | $ 65,900 |
| Boston-Cambridge-Nashua, MA-NH | 110 | 0.04 | 0.41 | $ 30.62 | $ 63,700 |
| Virginia Beach-Norfolk-Newport News, VA-NC | 40 | 0.05 | 0.55 | $ 30.61 | $ 63,670 |
| Baltimore-Columbia-Towson, MD | 510 | 0.39 | 3.89 | $ 29.97 | $ 62,340 |
| San Francisco-Oakland-Hayward, CA | 380 | 0.16 | 1.58 | $ 29.71 | $ 61,790 |
| Columbus, OH | 90 | 0.08 | 0.85 | $ 29.66 | $ 61,700 |
Nonmetropolitan areas with the highest employment in Food Science Technicians:
| Nonmetropolitan area | Employment (1) | Employment per thousand jobs | Location quotient (9) | Hourly mean wage | Annual mean wage (2) |
|---|---|---|---|---|---|
| Southeast-Central Idaho nonmetropolitan area | 100 | 1.07 | 10.70 | $ 20.19 | $ 41,990 |
| North Georgia nonmetropolitan area | 80 | 0.44 | 4.37 | $ 19.87 | $ 41,330 |
| Eastern Oregon nonmetropolitan area | 80 | 1.12 | 11.17 | $ 20.39 | $ 42,400 |
| Eastern New Mexico nonmetropolitan area | 80 | 0.50 | 5.05 | $ 20.89 | $ 43,450 |
| South Central Wisconsin nonmetropolitan area | 70 | 0.34 | 3.45 | $ 24.79 | $ 51,570 |
Nonmetropolitan areas with the highest concentration of jobs and location quotients in Food Science Technicians:
| Nonmetropolitan area | Employment (1) | Employment per thousand jobs | Location quotient (9) | Hourly mean wage | Annual mean wage (2) |
|---|---|---|---|---|---|
| Eastern Oregon nonmetropolitan area | 80 | 1.12 | 11.17 | $ 20.39 | $ 42,400 |
| Southeast-Central Idaho nonmetropolitan area | 100 | 1.07 | 10.70 | $ 20.19 | $ 41,990 |
| East South Dakota nonmetropolitan area | 70 | 0.54 | 5.37 | $ 22.56 | $ 46,930 |
| Eastern New Mexico nonmetropolitan area | 80 | 0.50 | 5.05 | $ 20.89 | $ 43,450 |
| Western Wisconsin nonmetropolitan area | 60 | 0.47 | 4.69 | $ 26.27 | $ 54,640 |
Top paying nonmetropolitan areas for Food Science Technicians:
| Nonmetropolitan area | Employment (1) | Employment per thousand jobs | Location quotient (9) | Hourly mean wage | Annual mean wage (2) |
|---|---|---|---|---|---|
| West Northwestern Ohio nonmetropolitan area | 50 | 0.19 | 1.92 | $ 30.68 | $ 63,820 |
| Western Wisconsin nonmetropolitan area | 60 | 0.47 | 4.69 | $ 26.27 | $ 54,640 |
| Southeast Minnesota nonmetropolitan area | 70 | 0.47 | 4.69 | $ 26.16 | $ 54,410 |
| Balance of Lower Peninsula of Michigan nonmetropolitan area | 60 | 0.22 | 2.16 | $ 25.78 | $ 53,620 |
| South Central Wisconsin nonmetropolitan area | 70 | 0.34 | 3.45 | $ 24.79 | $ 51,570 |
These estimates are calculated with data collected from employers in all industry sectors, all metropolitan and nonmetropolitan areas, and all states and the District of Columbia. The top employment and wage figures are provided above. The complete list is available in the downloadable XLS files.
The percentile wage estimate is the value of a wage below which a certain percent of workers fall. The median wage is the 50th percentile wage estimate—50 percent of workers earn less than the median and 50 percent of workers earn more than the median. More about percentile wages.
(1) Estimates for detailed occupations do not sum to the totals because the totals include occupations not shown separately. Estimates do not include self-employed workers.
(2) Annual wages have been calculated by multiplying the hourly mean wage by a "year-round, full-time" hours figure of 2,080 hours; for those occupations where there is not an hourly wage published, the annual wage has been directly calculated from the reported survey data.
(3) The relative standard error (RSE) is a measure of the reliability of a survey statistic. The smaller the relative standard error, the more precise the estimate.
(8) Estimate not released.
(9) The location quotient is the ratio of the area concentration of occupational employment to the national average concentration. A location quotient greater than one indicates the occupation has a higher share of employment than average, and a location quotient less than one indicates the occupation is less prevalent in the area than average.
Other OEWS estimates and related information:
May 2023 National Occupational Employment and Wage Estimates
May 2023 State Occupational Employment and Wage Estimates
May 2023 Metropolitan and Nonmetropolitan Area Occupational Employment and Wage Estimates
May 2023 National Industry-Specific Occupational Employment and Wage Estimates
Last Modified Date: April 3, 2024