
An official website of the United States government
An official website of the United States government
The .gov means it's official.
Federal government websites often end in .gov or .mil. Before sharing sensitive information,
make sure you're on a federal government site.
The site is secure.
The
https:// ensures that you are connecting to the official website and that any
information you provide is encrypted and transmitted securely.
Conduct hearings to recommend or make decisions on claims concerning government programs or other government-related matters. Determine liability, sanctions, or penalties, or recommend the acceptance or rejection of claims or settlements. Excludes �Arbitrators, Mediators, and Conciliators� (23-1022).
Employment estimate and mean wage estimates for Administrative Law Judges, Adjudicators, and Hearing Officers:
| Employment (1) | Employment RSE (3) |
Mean hourly wage |
Mean annual wage (2) |
Wage RSE (3) |
|---|---|---|---|---|
| 14,670 | 0.3 % | $ 57.67 | $ 119,940 | 0.3 % |
Percentile wage estimates for Administrative Law Judges, Adjudicators, and Hearing Officers:
| Percentile | 10% | 25% | 50% (Median) |
75% | 90% |
|---|---|---|---|---|---|
| Hourly Wage | $ 25.55 | $ 36.41 | $ 53.41 | $ 77.09 | $ 93.75 |
| Annual Wage (2) | $ 53,140 | $ 75,730 | $ 111,090 | $ 160,350 | $ 195,000 |
Industries with the highest published employment and wages for Administrative Law Judges, Adjudicators, and Hearing Officers are provided. For a list of all industries with employment in Administrative Law Judges, Adjudicators, and Hearing Officers, see the Create Customized Tables function.
Industries with the highest levels of employment in Administrative Law Judges, Adjudicators, and Hearing Officers:
| Industry | Employment (1) | Percent of industry employment | Hourly mean wage | Annual mean wage (2) |
|---|---|---|---|---|
| State Government, excluding Schools and Hospitals (OEWS Designation) | 8,280 | 0.39 | $ 53.39 | $ 111,060 |
| Federal, State, and Local Government, excluding State and Local Government Schools and Hospitals and the U.S. Postal Service (OEWS Designation) | 4,610 | 0.22 | $ 68.94 | $ 143,380 |
| Local Government, excluding Schools and Hospitals (OEWS Designation) | 1,750 | 0.03 | $ 48.27 | $ 100,400 |
Industries with the highest concentration of employment in Administrative Law Judges, Adjudicators, and Hearing Officers:
| Industry | Employment (1) | Percent of industry employment | Hourly mean wage | Annual mean wage (2) |
|---|---|---|---|---|
| State Government, excluding Schools and Hospitals (OEWS Designation) | 8,280 | 0.39 | $ 53.39 | $ 111,060 |
| Federal, State, and Local Government, excluding State and Local Government Schools and Hospitals and the U.S. Postal Service (OEWS Designation) | 4,610 | 0.22 | $ 68.94 | $ 143,380 |
| Local Government, excluding Schools and Hospitals (OEWS Designation) | 1,750 | 0.03 | $ 48.27 | $ 100,400 |
Top paying industries for Administrative Law Judges, Adjudicators, and Hearing Officers:
| Industry | Employment (1) | Percent of industry employment | Hourly mean wage | Annual mean wage (2) |
|---|---|---|---|---|
| Federal, State, and Local Government, excluding State and Local Government Schools and Hospitals and the U.S. Postal Service (OEWS Designation) | 4,610 | 0.22 | $ 68.94 | $ 143,380 |
| State Government, excluding Schools and Hospitals (OEWS Designation) | 8,280 | 0.39 | $ 53.39 | $ 111,060 |
| Local Government, excluding Schools and Hospitals (OEWS Designation) | 1,750 | 0.03 | $ 48.27 | $ 100,400 |
States and areas with the highest published employment, location quotients, and wages for Administrative Law Judges, Adjudicators, and Hearing Officers are provided. For a list of all areas with employment in Administrative Law Judges, Adjudicators, and Hearing Officers, see the Create Customized Tables function.
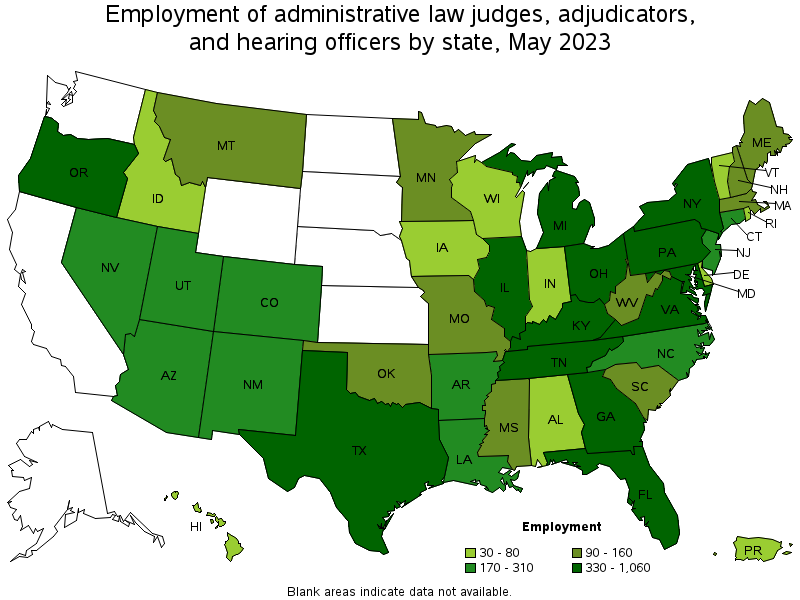
States with the highest employment level in Administrative Law Judges, Adjudicators, and Hearing Officers:
| State | Employment (1) | Employment per thousand jobs | Location quotient (9) | Hourly mean wage | Annual mean wage (2) |
|---|---|---|---|---|---|
| New York | 1,060 | 0.11 | 1.17 | $ 56.58 | $ 117,680 |
| Texas | 850 | 0.06 | 0.65 | $ 51.01 | $ 106,100 |
| Pennsylvania | 760 | 0.13 | 1.32 | $ 51.06 | $ 106,210 |
| Ohio | 700 | 0.13 | 1.32 | $ 44.53 | $ 92,620 |
| Virginia | 580 | 0.14 | 1.50 | $ 46.86 | $ 97,480 |
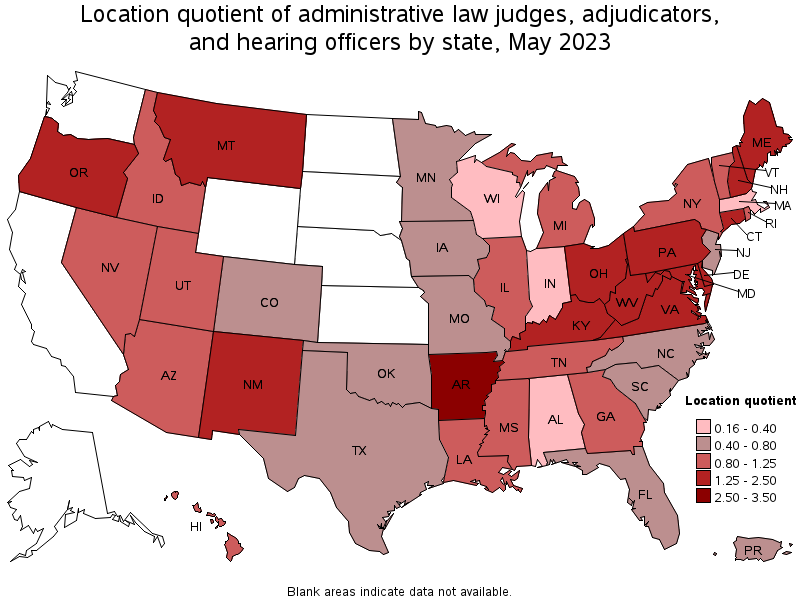
States with the highest concentration of jobs and location quotients in Administrative Law Judges, Adjudicators, and Hearing Officers:
| State | Employment (1) | Employment per thousand jobs | Location quotient (9) | Hourly mean wage | Annual mean wage (2) |
|---|---|---|---|---|---|
| Arkansas | 310 | 0.24 | 2.53 | $ 32.84 | $ 68,310 |
| Oregon | 470 | 0.24 | 2.48 | $ 45.32 | $ 94,270 |
| New Mexico | 180 | 0.21 | 2.19 | $ 41.11 | $ 85,520 |
| New Hampshire | 130 | 0.20 | 2.05 | $ 39.69 | $ 82,540 |
| Maine | 120 | 0.20 | 2.04 | $ 35.02 | $ 72,850 |
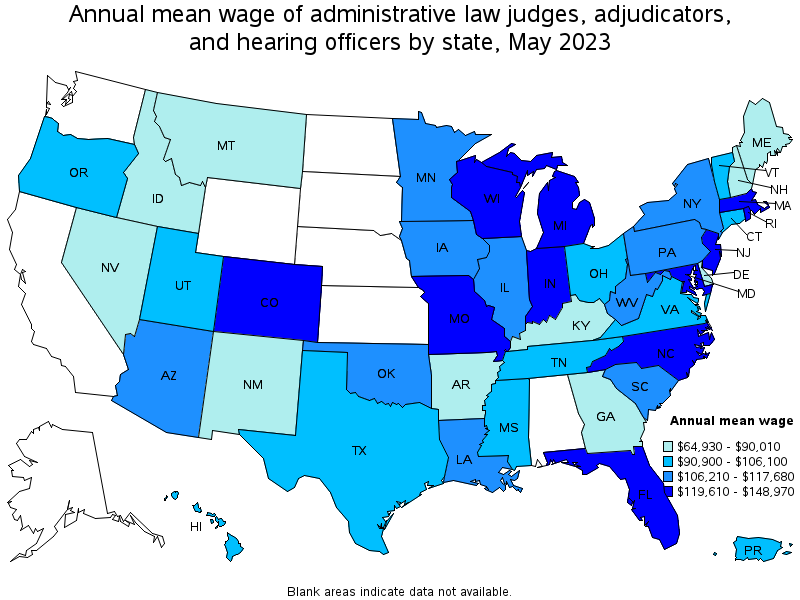
Top paying states for Administrative Law Judges, Adjudicators, and Hearing Officers:
| State | Employment (1) | Employment per thousand jobs | Location quotient (9) | Hourly mean wage | Annual mean wage (2) |
|---|---|---|---|---|---|
| Indiana | 60 | 0.02 | 0.21 | $ 71.62 | $ 148,970 |
| Wisconsin | 50 | 0.02 | 0.16 | $ 67.33 | $ 140,040 |
| Rhode Island | 40 | 0.09 | 0.91 | $ 64.37 | $ 133,890 |
| Massachusetts | 100 | 0.03 | 0.28 | $ 63.63 | $ 132,350 |
| Missouri | 160 | 0.06 | 0.58 | $ 62.75 | $ 130,520 |
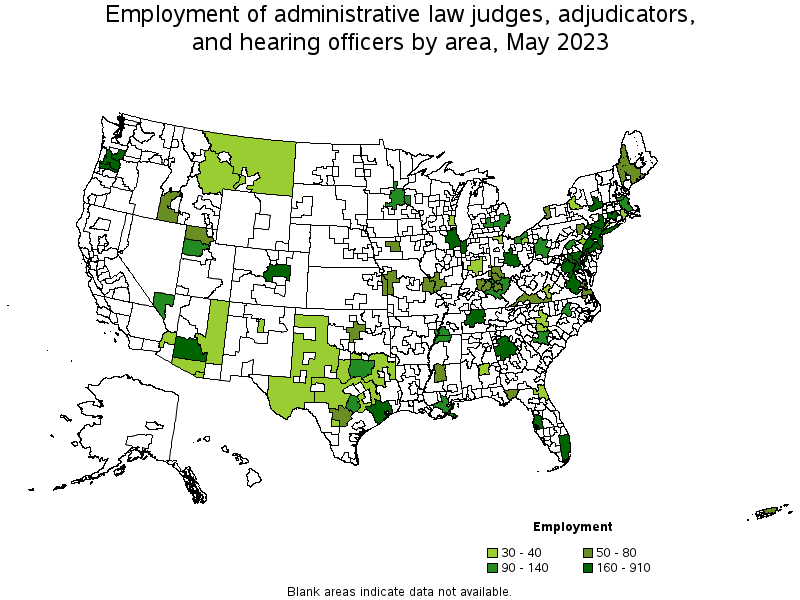
Metropolitan areas with the highest employment level in Administrative Law Judges, Adjudicators, and Hearing Officers:
| Metropolitan area | Employment (1) | Employment per thousand jobs | Location quotient (9) | Hourly mean wage | Annual mean wage (2) |
|---|---|---|---|---|---|
| New York-Newark-Jersey City, NY-NJ-PA | 910 | 0.10 | 0.99 | $ 57.75 | $ 120,120 |
| Washington-Arlington-Alexandria, DC-VA-MD-WV | 570 | 0.18 | 1.90 | $ 70.55 | $ 146,730 |
| Columbus, OH | 420 | 0.40 | 4.10 | $ 35.56 | $ 73,970 |
| Philadelphia-Camden-Wilmington, PA-NJ-DE-MD | 370 | 0.13 | 1.36 | $ 50.16 | $ 104,330 |
| Atlanta-Sandy Springs-Roswell, GA | 360 | 0.13 | 1.30 | $ 43.11 | $ 89,680 |
| Chicago-Naperville-Elgin, IL-IN-WI | 340 | 0.08 | 0.78 | $ 59.12 | $ 122,960 |
| Houston-The Woodlands-Sugar Land, TX | 320 | 0.10 | 1.03 | $ 58.38 | $ 121,430 |
| Richmond, VA | 210 | 0.33 | 3.39 | $ 41.44 | $ 86,200 |
| Portland-Vancouver-Hillsboro, OR-WA | 200 | 0.17 | 1.75 | $ 46.49 | $ 96,700 |
| Baltimore-Columbia-Towson, MD | 200 | 0.15 | 1.59 | $ 56.36 | $ 117,230 |
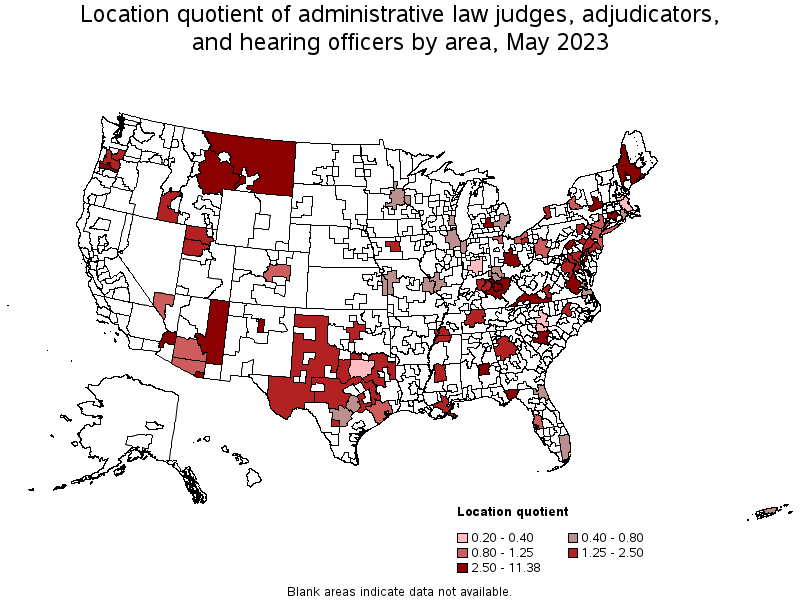
Metropolitan areas with the highest concentration of jobs and location quotients in Administrative Law Judges, Adjudicators, and Hearing Officers:
| Metropolitan area | Employment (1) | Employment per thousand jobs | Location quotient (9) | Hourly mean wage | Annual mean wage (2) |
|---|---|---|---|---|---|
| Salem, OR | 200 | 1.10 | 11.38 | $ 43.58 | $ 90,650 |
| Lansing-East Lansing, MI | 120 | 0.57 | 5.93 | $ 62.16 | $ 129,300 |
| Santa Fe, NM | 30 | 0.54 | 5.55 | $ 37.45 | $ 77,890 |
| Albany-Schenectady-Troy, NY | 200 | 0.45 | 4.64 | $ 49.81 | $ 103,600 |
| Harrisburg-Carlisle, PA | 140 | 0.44 | 4.54 | $ 48.44 | $ 100,760 |
| Columbus, OH | 420 | 0.40 | 4.10 | $ 35.56 | $ 73,970 |
| Hartford-West Hartford-East Hartford, CT | 190 | 0.34 | 3.47 | $ 49.70 | $ 103,370 |
| Richmond, VA | 210 | 0.33 | 3.39 | $ 41.44 | $ 86,200 |
| Tallahassee, FL | 50 | 0.29 | 2.97 | $ 55.95 | $ 116,370 |
| Lexington-Fayette, KY | 80 | 0.28 | 2.85 | $ 32.15 | $ 66,860 |
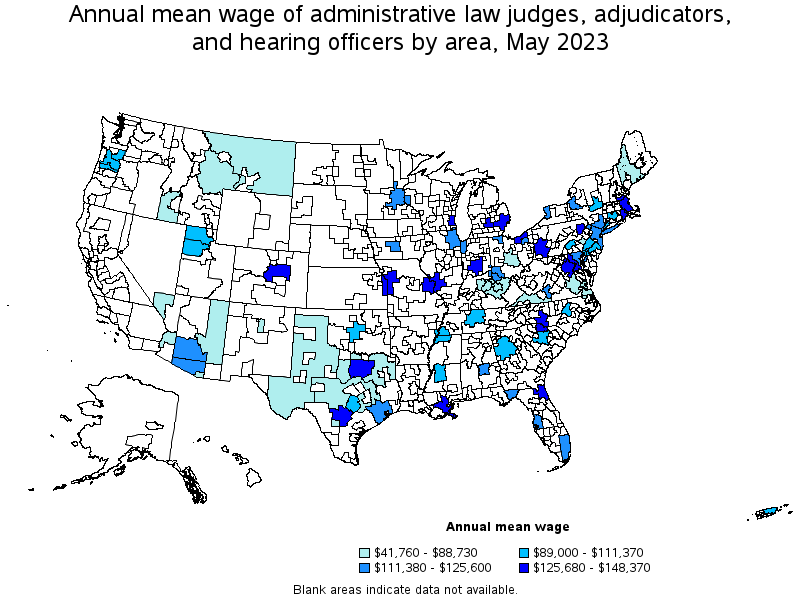
Top paying metropolitan areas for Administrative Law Judges, Adjudicators, and Hearing Officers:
| Metropolitan area | Employment (1) | Employment per thousand jobs | Location quotient (9) | Hourly mean wage | Annual mean wage (2) |
|---|---|---|---|---|---|
| Jacksonville, FL | 30 | 0.04 | 0.42 | $ 71.33 | $ 148,370 |
| Kansas City, MO-KS | 50 | 0.05 | 0.50 | $ 71.28 | $ 148,270 |
| Washington-Arlington-Alexandria, DC-VA-MD-WV | 570 | 0.18 | 1.90 | $ 70.55 | $ 146,730 |
| Indianapolis-Carmel-Anderson, IN | 40 | 0.03 | 0.35 | $ 69.74 | $ 145,070 |
| Dallas-Fort Worth-Arlington, TX | 110 | 0.03 | 0.30 | $ 67.52 | $ 140,440 |
| Milwaukee-Waukesha-West Allis, WI | 30 | 0.04 | 0.41 | $ 66.37 | $ 138,040 |
| Charlotte-Concord-Gastonia, NC-SC | 30 | 0.03 | 0.27 | $ 65.62 | $ 136,500 |
| Providence-Warwick, RI-MA | 40 | 0.08 | 0.78 | $ 64.37 | $ 133,890 |
| Detroit-Warren-Dearborn, MI | 130 | 0.07 | 0.71 | $ 63.99 | $ 133,100 |
| St. Louis, MO-IL | 80 | 0.06 | 0.64 | $ 63.18 | $ 131,410 |
Nonmetropolitan areas with the highest employment in Administrative Law Judges, Adjudicators, and Hearing Officers:
| Nonmetropolitan area | Employment (1) | Employment per thousand jobs | Location quotient (9) | Hourly mean wage | Annual mean wage (2) |
|---|---|---|---|---|---|
| Central Kentucky nonmetropolitan area | 120 | 0.66 | 6.79 | $ 20.08 | $ 41,760 |
| Southwest Maine nonmetropolitan area | 80 | 0.45 | 4.62 | $ 32.00 | $ 66,550 |
| Southwest Virginia nonmetropolitan area | 60 | 0.49 | 5.04 | $ 23.21 | $ 48,270 |
| Southwest Montana nonmetropolitan area | 40 | 0.29 | 2.95 | $ 41.50 | $ 86,320 |
| North Texas Region of Texas nonmetropolitan area | 40 | 0.13 | 1.33 | $ 22.78 | $ 47,380 |
Nonmetropolitan areas with the highest concentration of jobs and location quotients in Administrative Law Judges, Adjudicators, and Hearing Officers:
| Nonmetropolitan area | Employment (1) | Employment per thousand jobs | Location quotient (9) | Hourly mean wage | Annual mean wage (2) |
|---|---|---|---|---|---|
| Central Kentucky nonmetropolitan area | 120 | 0.66 | 6.79 | $ 20.08 | $ 41,760 |
| Southwest Virginia nonmetropolitan area | 60 | 0.49 | 5.04 | $ 23.21 | $ 48,270 |
| East-Central Montana nonmetropolitan area | 30 | 0.48 | 4.97 | $ 29.11 | $ 60,550 |
| Southwest Maine nonmetropolitan area | 80 | 0.45 | 4.62 | $ 32.00 | $ 66,550 |
| Arizona nonmetropolitan area | 30 | 0.37 | 3.83 | $ 41.86 | $ 87,060 |
Top paying nonmetropolitan areas for Administrative Law Judges, Adjudicators, and Hearing Officers:
| Nonmetropolitan area | Employment (1) | Employment per thousand jobs | Location quotient (9) | Hourly mean wage | Annual mean wage (2) |
|---|---|---|---|---|---|
| Arizona nonmetropolitan area | 30 | 0.37 | 3.83 | $ 41.86 | $ 87,060 |
| Southwest Montana nonmetropolitan area | 40 | 0.29 | 2.95 | $ 41.50 | $ 86,320 |
| Southwest Maine nonmetropolitan area | 80 | 0.45 | 4.62 | $ 32.00 | $ 66,550 |
| East-Central Montana nonmetropolitan area | 30 | 0.48 | 4.97 | $ 29.11 | $ 60,550 |
| West Texas Region of Texas nonmetropolitan area | 40 | 0.18 | 1.85 | $ 27.39 | $ 56,970 |
These estimates are calculated with data collected from employers in all industry sectors, all metropolitan and nonmetropolitan areas, and all states and the District of Columbia. The top employment and wage figures are provided above. The complete list is available in the downloadable XLS files.
The percentile wage estimate is the value of a wage below which a certain percent of workers fall. The median wage is the 50th percentile wage estimate—50 percent of workers earn less than the median and 50 percent of workers earn more than the median. More about percentile wages.
(1) Estimates for detailed occupations do not sum to the totals because the totals include occupations not shown separately. Estimates do not include self-employed workers.
(2) Annual wages have been calculated by multiplying the hourly mean wage by a "year-round, full-time" hours figure of 2,080 hours; for those occupations where there is not an hourly wage published, the annual wage has been directly calculated from the reported survey data.
(3) The relative standard error (RSE) is a measure of the reliability of a survey statistic. The smaller the relative standard error, the more precise the estimate.
(9) The location quotient is the ratio of the area concentration of occupational employment to the national average concentration. A location quotient greater than one indicates the occupation has a higher share of employment than average, and a location quotient less than one indicates the occupation is less prevalent in the area than average.
Other OEWS estimates and related information:
May 2023 National Occupational Employment and Wage Estimates
May 2023 State Occupational Employment and Wage Estimates
May 2023 Metropolitan and Nonmetropolitan Area Occupational Employment and Wage Estimates
May 2023 National Industry-Specific Occupational Employment and Wage Estimates
Last Modified Date: April 3, 2024