
An official website of the United States government
An official website of the United States government
The .gov means it's official.
Federal government websites often end in .gov or .mil. Before sharing sensitive information,
make sure you're on a federal government site.
The site is secure.
The
https:// ensures that you are connecting to the official website and that any
information you provide is encrypted and transmitted securely.
Assemble and operate equipment to record, synchronize, mix, edit, or reproduce sound, including music, voices, or sound effects, for theater, video, film, television, podcasts, sporting events, and other productions. Excludes �Audio and Video Technicians� (27-4011).
Employment estimate and mean wage estimates for Sound Engineering Technicians:
| Employment (1) | Employment RSE (3) |
Mean hourly wage |
Mean annual wage (2) |
Wage RSE (3) |
|---|---|---|---|---|
| 14,600 | 7.4 % | $ 35.62 | $ 74,100 | 3.0 % |
Percentile wage estimates for Sound Engineering Technicians:
| Percentile | 10% | 25% | 50% (Median) |
75% | 90% |
|---|---|---|---|---|---|
| Hourly Wage | $ 17.38 | $ 22.03 | $ 28.57 | $ 45.46 | $ 63.91 |
| Annual Wage (2) | $ 36,160 | $ 45,820 | $ 59,430 | $ 94,550 | $ 132,940 |
Industries with the highest published employment and wages for Sound Engineering Technicians are provided. For a list of all industries with employment in Sound Engineering Technicians, see the Create Customized Tables function.
Industries with the highest levels of employment in Sound Engineering Technicians:
| Industry | Employment (1) | Percent of industry employment | Hourly mean wage | Annual mean wage (2) |
|---|---|---|---|---|
| Motion Picture and Video Industries | 3,980 | 0.99 | $ 48.07 | $ 99,990 |
| Sound Recording Industries | 2,400 | 11.32 | $ 28.38 | $ 59,040 |
| Promoters of Performing Arts, Sports, and Similar Events | 770 | 0.47 | $ 27.55 | $ 57,300 |
| Radio and Television Broadcasting Stations | 650 | 0.53 | $ 28.65 | $ 59,590 |
| Colleges, Universities, and Professional Schools | 510 | 0.02 | $ 21.86 | $ 45,470 |
Industries with the highest concentration of employment in Sound Engineering Technicians:
| Industry | Employment (1) | Percent of industry employment | Hourly mean wage | Annual mean wage (2) |
|---|---|---|---|---|
| Sound Recording Industries | 2,400 | 11.32 | $ 28.38 | $ 59,040 |
| Motion Picture and Video Industries | 3,980 | 0.99 | $ 48.07 | $ 99,990 |
| Radio and Television Broadcasting Stations | 650 | 0.53 | $ 28.65 | $ 59,590 |
| Promoters of Performing Arts, Sports, and Similar Events | 770 | 0.47 | $ 27.55 | $ 57,300 |
| Manufacturing and Reproducing Magnetic and Optical Media | 50 | 0.46 | $ 27.00 | $ 56,160 |
Top paying industries for Sound Engineering Technicians:
| Industry | Employment (1) | Percent of industry employment | Hourly mean wage | Annual mean wage (2) |
|---|---|---|---|---|
| Software Publishers | 310 | 0.05 | $ 61.76 | $ 128,470 |
| Accounting, Tax Preparation, Bookkeeping, and Payroll Services | 60 | 0.01 | $ 51.64 | $ 107,410 |
| Motion Picture and Video Industries | 3,980 | 0.99 | $ 48.07 | $ 99,990 |
| Newspaper, Periodical, Book, and Directory Publishers | 100 | 0.03 | $ 46.13 | $ 95,950 |
| Computing Infrastructure Providers, Data Processing, Web Hosting, and Related Services | 40 | 0.01 | $ 45.39 | $ 94,410 |
States and areas with the highest published employment, location quotients, and wages for Sound Engineering Technicians are provided. For a list of all areas with employment in Sound Engineering Technicians, see the Create Customized Tables function.
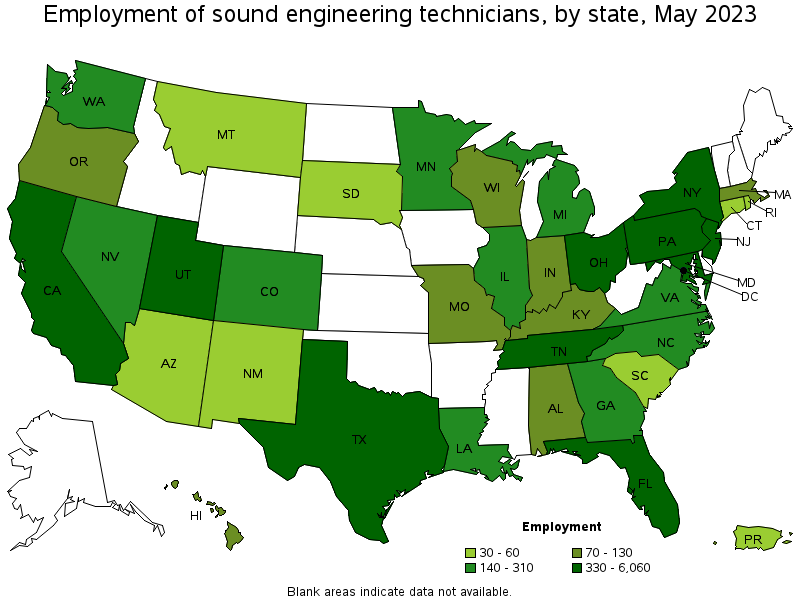
States with the highest employment level in Sound Engineering Technicians:
| State | Employment (1) | Employment per thousand jobs | Location quotient (9) | Hourly mean wage | Annual mean wage (2) |
|---|---|---|---|---|---|
| California | 6,060 | 0.34 | 3.52 | $ 40.07 | $ 83,340 |
| New York | 1,460 | 0.16 | 1.61 | $ 43.00 | $ 89,450 |
| Florida | 770 | 0.08 | 0.84 | $ 29.62 | $ 61,610 |
| Maryland | 540 | 0.20 | 2.10 | $ 25.98 | $ 54,030 |
| Tennessee | 460 | 0.14 | 1.48 | $ 26.57 | $ 55,260 |
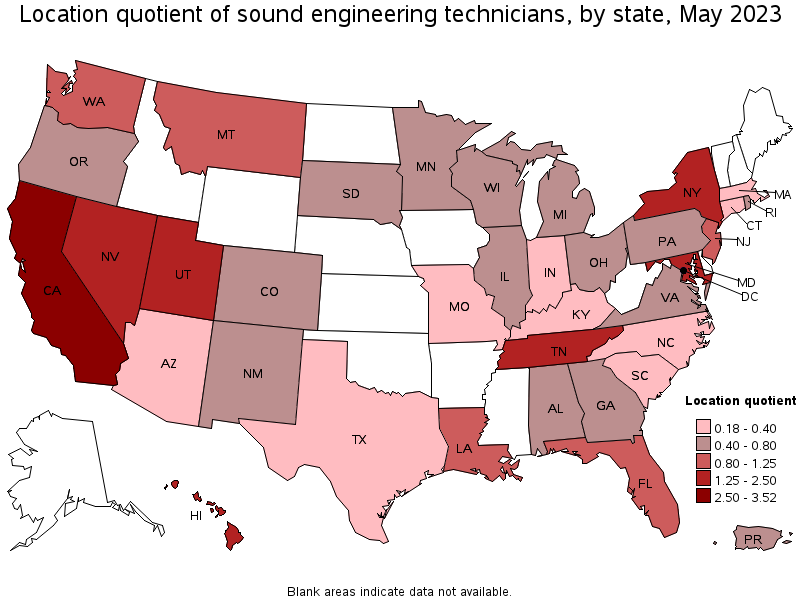
States with the highest concentration of jobs and location quotients in Sound Engineering Technicians:
| State | Employment (1) | Employment per thousand jobs | Location quotient (9) | Hourly mean wage | Annual mean wage (2) |
|---|---|---|---|---|---|
| California | 6,060 | 0.34 | 3.52 | $ 40.07 | $ 83,340 |
| Maryland | 540 | 0.20 | 2.10 | $ 25.98 | $ 54,030 |
| Utah | 340 | 0.20 | 2.09 | $ 21.63 | $ 44,990 |
| New York | 1,460 | 0.16 | 1.61 | $ 43.00 | $ 89,450 |
| Tennessee | 460 | 0.14 | 1.48 | $ 26.57 | $ 55,260 |
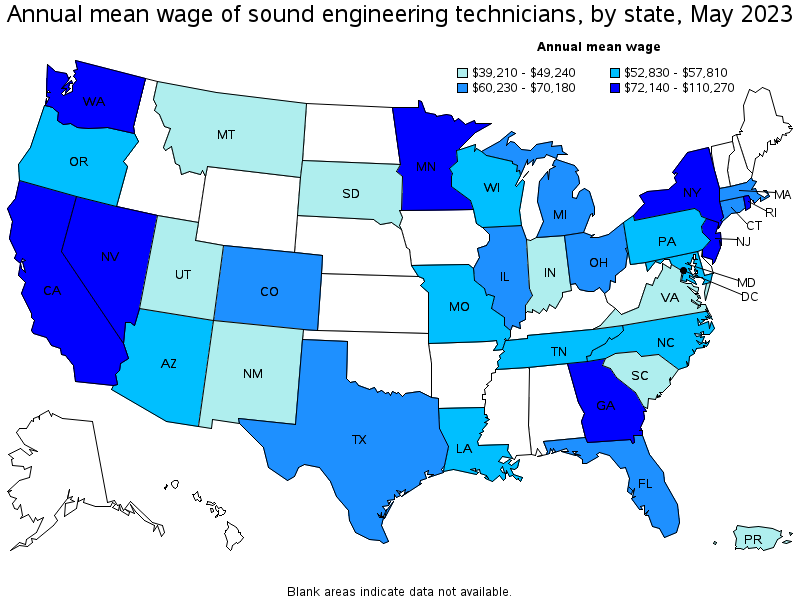
Top paying states for Sound Engineering Technicians:
| State | Employment (1) | Employment per thousand jobs | Location quotient (9) | Hourly mean wage | Annual mean wage (2) |
|---|---|---|---|---|---|
| Washington | 310 | 0.09 | 0.92 | $ 53.01 | $ 110,270 |
| District of Columbia | 80 | 0.11 | 1.14 | $ 43.36 | $ 90,190 |
| New York | 1,460 | 0.16 | 1.61 | $ 43.00 | $ 89,450 |
| New Jersey | 330 | 0.08 | 0.82 | $ 41.42 | $ 86,150 |
| California | 6,060 | 0.34 | 3.52 | $ 40.07 | $ 83,340 |
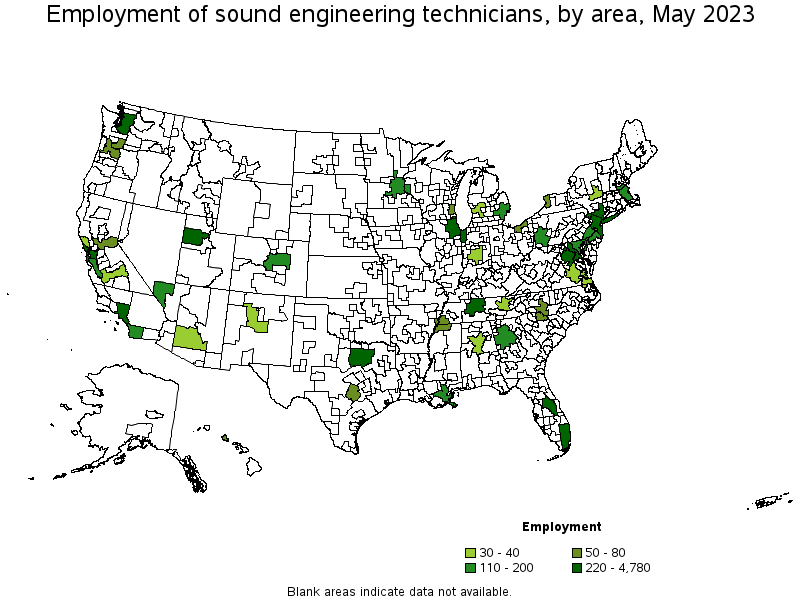
Metropolitan areas with the highest employment level in Sound Engineering Technicians:
| Metropolitan area | Employment (1) | Employment per thousand jobs | Location quotient (9) | Hourly mean wage | Annual mean wage (2) |
|---|---|---|---|---|---|
| Los Angeles-Long Beach-Anaheim, CA | 4,780 | 0.77 | 8.04 | $ 39.51 | $ 82,180 |
| New York-Newark-Jersey City, NY-NJ-PA | 1,370 | 0.14 | 1.50 | $ 43.51 | $ 90,500 |
| San Francisco-Oakland-Hayward, CA | 490 | 0.20 | 2.11 | $ 53.65 | $ 111,600 |
| Washington-Arlington-Alexandria, DC-VA-MD-WV | 420 | 0.14 | 1.42 | $ 29.79 | $ 61,970 |
| Orlando-Kissimmee-Sanford, FL | 290 | 0.21 | 2.21 | $ 25.13 | $ 52,260 |
| Salt Lake City, UT | 280 | 0.35 | 3.68 | $ 20.22 | $ 42,060 |
| Nashville-Davidson--Murfreesboro--Franklin, TN | 270 | 0.25 | 2.63 | $ 28.92 | $ 60,150 |
| Seattle-Tacoma-Bellevue, WA | 250 | 0.12 | 1.27 | $ 55.05 | $ 114,510 |
| Miami-Fort Lauderdale-West Palm Beach, FL | 240 | 0.09 | 0.93 | $ 33.37 | $ 69,410 |
| Dallas-Fort Worth-Arlington, TX | 230 | 0.06 | 0.59 | $ 25.86 | $ 53,790 |
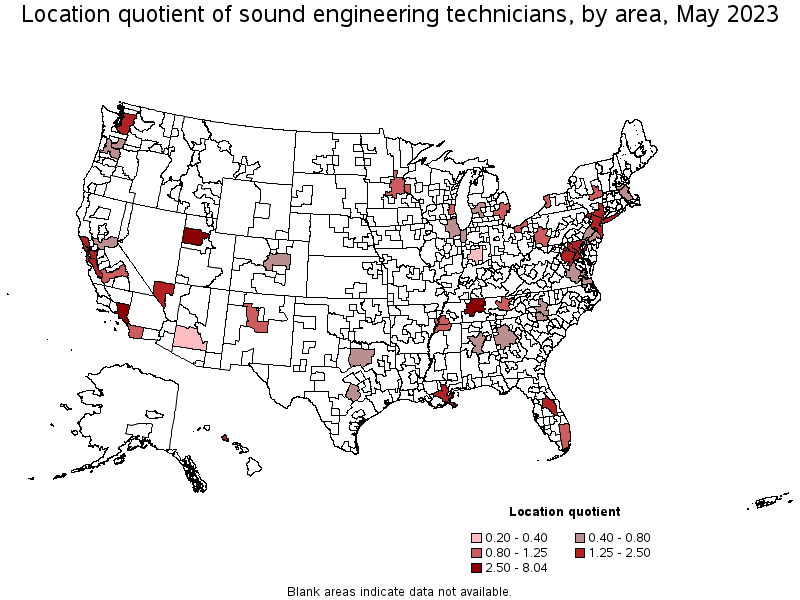
Metropolitan areas with the highest concentration of jobs and location quotients in Sound Engineering Technicians:
| Metropolitan area | Employment (1) | Employment per thousand jobs | Location quotient (9) | Hourly mean wage | Annual mean wage (2) |
|---|---|---|---|---|---|
| Los Angeles-Long Beach-Anaheim, CA | 4,780 | 0.77 | 8.04 | $ 39.51 | $ 82,180 |
| Salt Lake City, UT | 280 | 0.35 | 3.68 | $ 20.22 | $ 42,060 |
| Nashville-Davidson--Murfreesboro--Franklin, TN | 270 | 0.25 | 2.63 | $ 28.92 | $ 60,150 |
| Trenton, NJ | 60 | 0.23 | 2.44 | $ 48.50 | $ 100,870 |
| New Orleans-Metairie, LA | 110 | 0.21 | 2.22 | $ 25.81 | $ 53,680 |
| Orlando-Kissimmee-Sanford, FL | 290 | 0.21 | 2.21 | $ 25.13 | $ 52,260 |
| San Francisco-Oakland-Hayward, CA | 490 | 0.20 | 2.11 | $ 53.65 | $ 111,600 |
| Santa Rosa, CA | 30 | 0.16 | 1.70 | (8) | (8) |
| Baltimore-Columbia-Towson, MD | 200 | 0.15 | 1.58 | $ 24.83 | $ 51,650 |
| Urban Honolulu, HI | 70 | 0.15 | 1.55 | (8) | (8) |
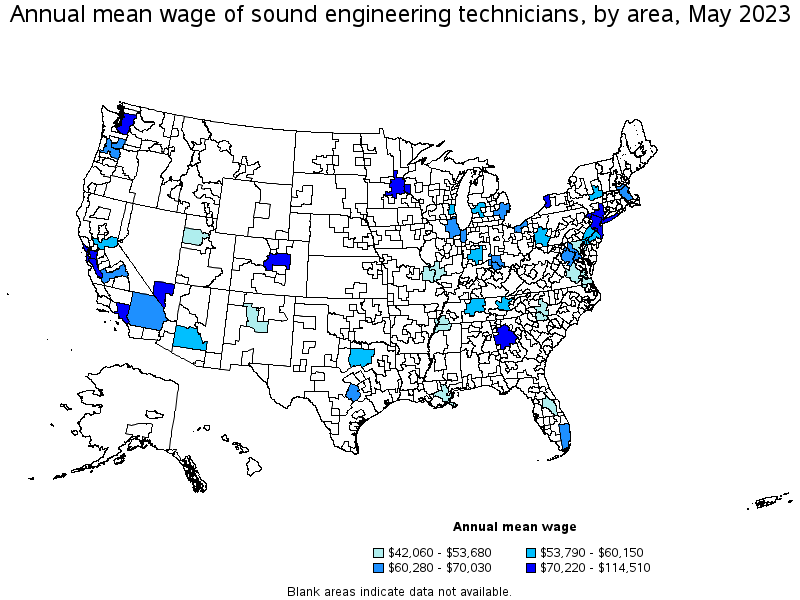
Top paying metropolitan areas for Sound Engineering Technicians:
| Metropolitan area | Employment (1) | Employment per thousand jobs | Location quotient (9) | Hourly mean wage | Annual mean wage (2) |
|---|---|---|---|---|---|
| Seattle-Tacoma-Bellevue, WA | 250 | 0.12 | 1.27 | $ 55.05 | $ 114,510 |
| San Francisco-Oakland-Hayward, CA | 490 | 0.20 | 2.11 | $ 53.65 | $ 111,600 |
| San Jose-Sunnyvale-Santa Clara, CA | 170 | 0.15 | 1.54 | $ 48.58 | $ 101,050 |
| Trenton, NJ | 60 | 0.23 | 2.44 | $ 48.50 | $ 100,870 |
| New York-Newark-Jersey City, NY-NJ-PA | 1,370 | 0.14 | 1.50 | $ 43.51 | $ 90,500 |
| Los Angeles-Long Beach-Anaheim, CA | 4,780 | 0.77 | 8.04 | $ 39.51 | $ 82,180 |
| Atlanta-Sandy Springs-Roswell, GA | 130 | 0.05 | 0.49 | $ 39.16 | $ 81,450 |
| Buffalo-Cheektowaga-Niagara Falls, NY | 60 | 0.12 | 1.22 | $ 36.60 | $ 76,130 |
| Minneapolis-St. Paul-Bloomington, MN-WI | 150 | 0.08 | 0.82 | $ 35.99 | $ 74,850 |
| Las Vegas-Henderson-Paradise, NV | 160 | 0.14 | 1.50 | $ 34.45 | $ 71,660 |
These estimates are calculated with data collected from employers in all industry sectors, all metropolitan and nonmetropolitan areas, and all states and the District of Columbia. The top employment and wage figures are provided above. The complete list is available in the downloadable XLS files.
The percentile wage estimate is the value of a wage below which a certain percent of workers fall. The median wage is the 50th percentile wage estimate—50 percent of workers earn less than the median and 50 percent of workers earn more than the median. More about percentile wages.
(1) Estimates for detailed occupations do not sum to the totals because the totals include occupations not shown separately. Estimates do not include self-employed workers.
(2) Annual wages have been calculated by multiplying the hourly mean wage by a "year-round, full-time" hours figure of 2,080 hours; for those occupations where there is not an hourly wage published, the annual wage has been directly calculated from the reported survey data.
(3) The relative standard error (RSE) is a measure of the reliability of a survey statistic. The smaller the relative standard error, the more precise the estimate.
(8) Estimate not released.
(9) The location quotient is the ratio of the area concentration of occupational employment to the national average concentration. A location quotient greater than one indicates the occupation has a higher share of employment than average, and a location quotient less than one indicates the occupation is less prevalent in the area than average.
Other OEWS estimates and related information:
May 2023 National Occupational Employment and Wage Estimates
May 2023 State Occupational Employment and Wage Estimates
May 2023 Metropolitan and Nonmetropolitan Area Occupational Employment and Wage Estimates
May 2023 National Industry-Specific Occupational Employment and Wage Estimates
Last Modified Date: April 3, 2024