
An official website of the United States government
An official website of the United States government
The .gov means it's official.
Federal government websites often end in .gov or .mil. Before sharing sensitive information,
make sure you're on a federal government site.
The site is secure.
The
https:// ensures that you are connecting to the official website and that any
information you provide is encrypted and transmitted securely.
Photograph people, landscapes, merchandise, or other subjects. May use lighting equipment to enhance a subject�s appearance. May use editing software to produce finished images and prints. Includes commercial and industrial photographers, scientific photographers, and photojournalists. Excludes �Camera Operators, Television, Video, and Film� (27-4031).
Employment estimate and mean wage estimates for Photographers:
| Employment (1) | Employment RSE (3) |
Mean hourly wage |
Mean annual wage (2) |
Wage RSE (3) |
|---|---|---|---|---|
| 53,630 | 1.8 % | $ 25.67 | $ 53,380 | 2.1 % |
Percentile wage estimates for Photographers:
| Percentile | 10% | 25% | 50% (Median) |
75% | 90% |
|---|---|---|---|---|---|
| Hourly Wage | $ 13.71 | $ 15.50 | $ 19.60 | $ 30.04 | $ 46.03 |
| Annual Wage (2) | $ 28,510 | $ 32,240 | $ 40,760 | $ 62,480 | $ 95,740 |
Industries with the highest published employment and wages for Photographers are provided. For a list of all industries with employment in Photographers, see the Create Customized Tables function.
Industries with the highest levels of employment in Photographers:
| Industry | Employment (1) | Percent of industry employment | Hourly mean wage | Annual mean wage (2) |
|---|---|---|---|---|
| Other Professional, Scientific, and Technical Services | 26,970 | 3.15 | $ 21.98 | $ 45,710 |
| Media Streaming Distribution Services, Social Networks, and Other Media Networks and Content Providers | 2,020 | 0.86 | $ 38.23 | $ 79,520 |
| Radio and Television Broadcasting Stations | 1,840 | 1.51 | $ 29.14 | $ 60,600 |
| Newspaper, Periodical, Book, and Directory Publishers | 1,580 | 0.54 | $ 25.90 | $ 53,870 |
| Motion Picture and Video Industries | 1,190 | 0.30 | (8) | (8) |
Industries with the highest concentration of employment in Photographers:
| Industry | Employment (1) | Percent of industry employment | Hourly mean wage | Annual mean wage (2) |
|---|---|---|---|---|
| Other Professional, Scientific, and Technical Services | 26,970 | 3.15 | $ 21.98 | $ 45,710 |
| Radio and Television Broadcasting Stations | 1,840 | 1.51 | $ 29.14 | $ 60,600 |
| Media Streaming Distribution Services, Social Networks, and Other Media Networks and Content Providers | 2,020 | 0.86 | $ 38.23 | $ 79,520 |
| Newspaper, Periodical, Book, and Directory Publishers | 1,580 | 0.54 | $ 25.90 | $ 53,870 |
| Nonscheduled Air Transportation | 190 | 0.32 | $ 33.97 | $ 70,650 |
Top paying industries for Photographers:
| Industry | Employment (1) | Percent of industry employment | Hourly mean wage | Annual mean wage (2) |
|---|---|---|---|---|
| Independent Artists, Writers, and Performers | (8) | (8) | $ 41.38 | $ 86,060 |
| Software Publishers | 60 | 0.01 | $ 40.85 | $ 84,970 |
| Accounting, Tax Preparation, Bookkeeping, and Payroll Services | 140 | 0.01 | $ 40.77 | $ 84,800 |
| Media Streaming Distribution Services, Social Networks, and Other Media Networks and Content Providers | 2,020 | 0.86 | $ 38.23 | $ 79,520 |
| Agents and Managers for Artists, Athletes, Entertainers, and Other Public Figures | (8) | (8) | $ 37.04 | $ 77,040 |
States and areas with the highest published employment, location quotients, and wages for Photographers are provided. For a list of all areas with employment in Photographers, see the Create Customized Tables function.
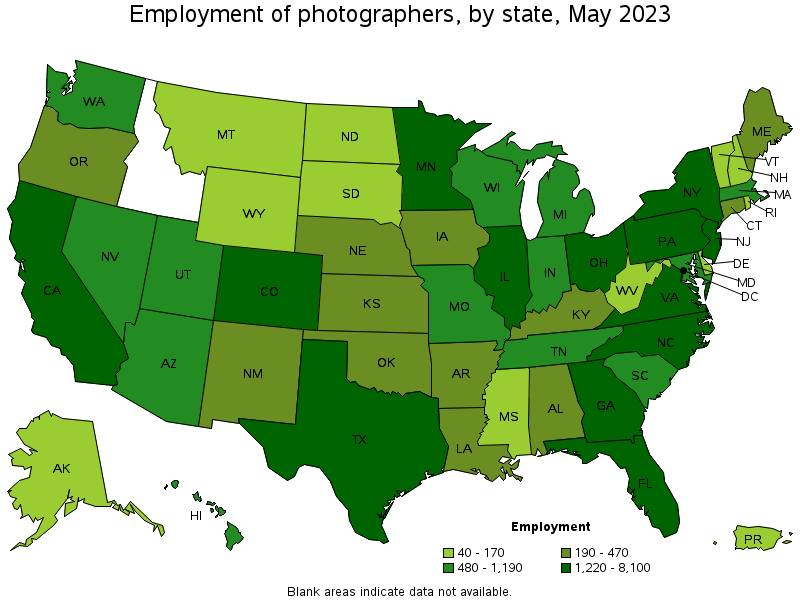
States with the highest employment level in Photographers:
| State | Employment (1) | Employment per thousand jobs | Location quotient (9) | Hourly mean wage | Annual mean wage (2) |
|---|---|---|---|---|---|
| California | 8,100 | 0.45 | 1.28 | $ 36.30 | $ 75,510 |
| Florida | 4,150 | 0.43 | 1.23 | $ 21.20 | $ 44,090 |
| New York | 4,050 | 0.43 | 1.22 | $ 39.00 | $ 81,130 |
| Texas | 3,950 | 0.29 | 0.82 | $ 17.72 | $ 36,850 |
| Illinois | 2,420 | 0.40 | 1.14 | $ 21.18 | $ 44,050 |
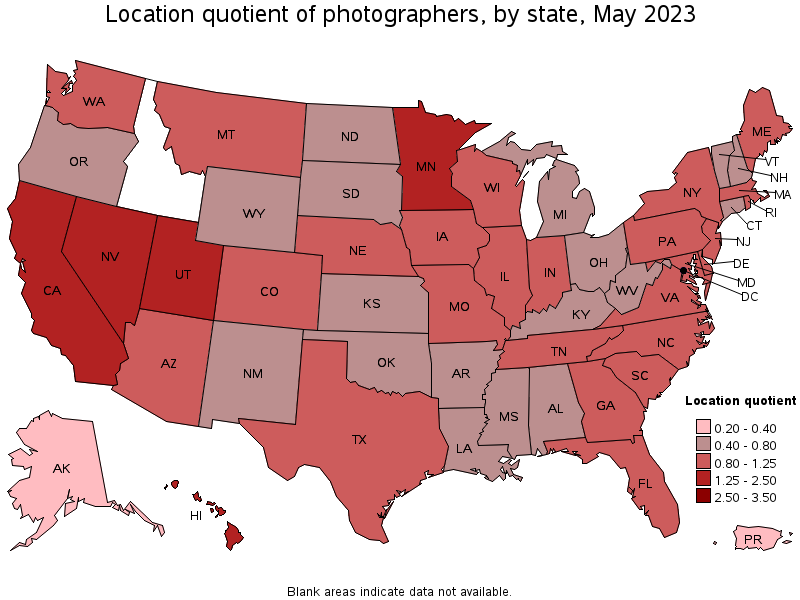
States with the highest concentration of jobs and location quotients in Photographers:
| State | Employment (1) | Employment per thousand jobs | Location quotient (9) | Hourly mean wage | Annual mean wage (2) |
|---|---|---|---|---|---|
| Hawaii | 480 | 0.77 | 2.19 | $ 32.50 | $ 67,600 |
| Minnesota | 1,830 | 0.64 | 1.80 | (8) | (8) |
| Utah | 950 | 0.57 | 1.61 | $ 24.93 | $ 51,850 |
| Nevada | 840 | 0.56 | 1.60 | $ 21.51 | $ 44,740 |
| California | 8,100 | 0.45 | 1.28 | $ 36.30 | $ 75,510 |
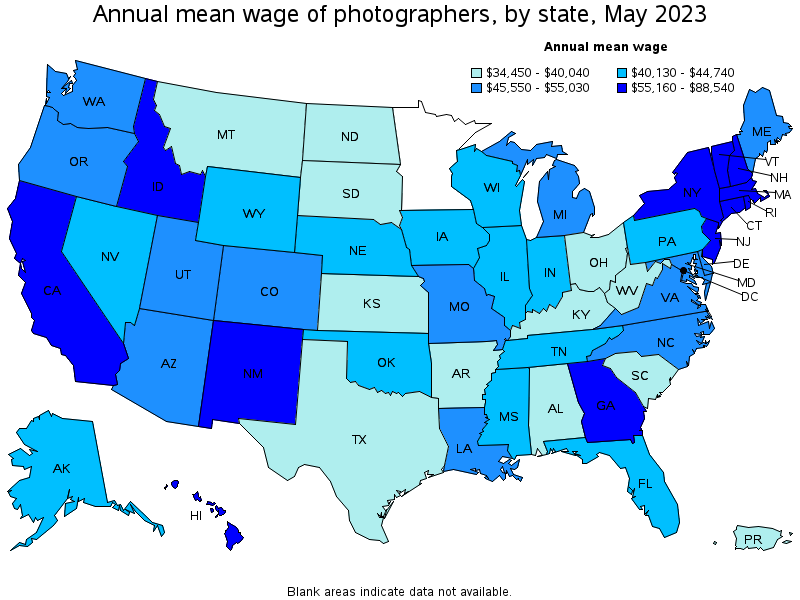
Top paying states for Photographers:
| State | Employment (1) | Employment per thousand jobs | Location quotient (9) | Hourly mean wage | Annual mean wage (2) |
|---|---|---|---|---|---|
| District of Columbia | 250 | 0.36 | 1.01 | $ 42.57 | $ 88,540 |
| New York | 4,050 | 0.43 | 1.22 | $ 39.00 | $ 81,130 |
| Vermont | 60 | 0.20 | 0.56 | $ 37.39 | $ 77,780 |
| California | 8,100 | 0.45 | 1.28 | $ 36.30 | $ 75,510 |
| Rhode Island | 150 | 0.31 | 0.89 | $ 32.93 | $ 68,500 |
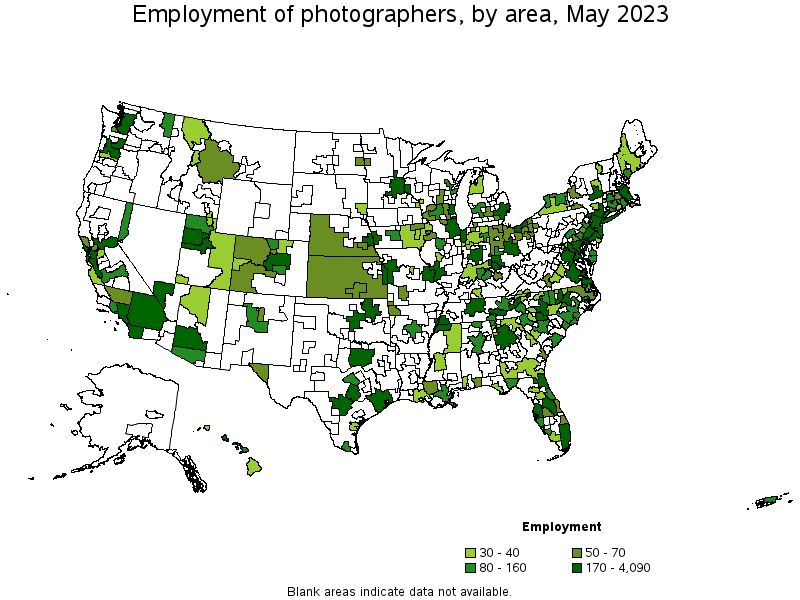
Metropolitan areas with the highest employment level in Photographers:
| Metropolitan area | Employment (1) | Employment per thousand jobs | Location quotient (9) | Hourly mean wage | Annual mean wage (2) |
|---|---|---|---|---|---|
| Los Angeles-Long Beach-Anaheim, CA | 4,090 | 0.66 | 1.87 | $ 41.33 | $ 85,960 |
| New York-Newark-Jersey City, NY-NJ-PA | 4,010 | 0.42 | 1.20 | $ 39.93 | $ 83,050 |
| Chicago-Naperville-Elgin, IL-IN-WI | 1,940 | 0.43 | 1.22 | $ 22.15 | $ 46,060 |
| Dallas-Fort Worth-Arlington, TX | 1,300 | 0.33 | 0.93 | $ 17.96 | $ 37,350 |
| Miami-Fort Lauderdale-West Palm Beach, FL | 1,220 | 0.45 | 1.27 | $ 21.44 | $ 44,590 |
| Atlanta-Sandy Springs-Roswell, GA | 1,180 | 0.42 | 1.19 | $ 28.68 | $ 59,660 |
| San Francisco-Oakland-Hayward, CA | 1,100 | 0.46 | 1.29 | $ 44.79 | $ 93,160 |
| Houston-The Woodlands-Sugar Land, TX | 940 | 0.30 | 0.84 | $ 17.92 | $ 37,280 |
| Orlando-Kissimmee-Sanford, FL | 870 | 0.64 | 1.81 | $ 22.13 | $ 46,030 |
| Phoenix-Mesa-Scottsdale, AZ | 870 | 0.38 | 1.08 | $ 22.12 | $ 46,000 |
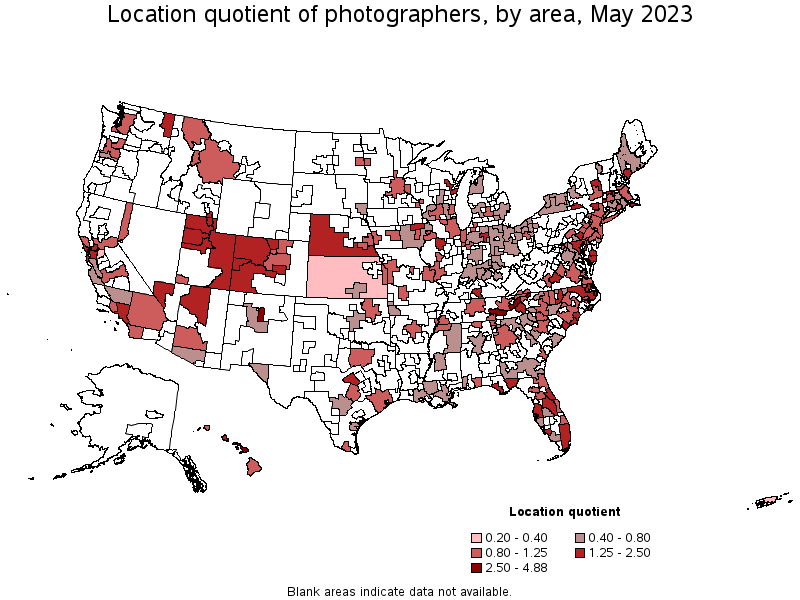
Metropolitan areas with the highest concentration of jobs and location quotients in Photographers:
| Metropolitan area | Employment (1) | Employment per thousand jobs | Location quotient (9) | Hourly mean wage | Annual mean wage (2) |
|---|---|---|---|---|---|
| Kahului-Wailuku-Lahaina, HI | 100 | 1.30 | 3.67 | (8) | (8) |
| Santa Fe, NM | 60 | 1.01 | 2.87 | (8) | (8) |
| Killeen-Temple, TX | 130 | 0.86 | 2.44 | $ 13.72 | $ 28,530 |
| Urban Honolulu, HI | 340 | 0.76 | 2.16 | $ 31.48 | $ 65,480 |
| Asheville, NC | 140 | 0.72 | 2.03 | $ 25.43 | $ 52,890 |
| Las Vegas-Henderson-Paradise, NV | 740 | 0.68 | 1.93 | $ 21.16 | $ 44,010 |
| Myrtle Beach-Conway-North Myrtle Beach, SC-NC | 120 | 0.67 | 1.91 | $ 15.96 | $ 33,200 |
| Los Angeles-Long Beach-Anaheim, CA | 4,090 | 0.66 | 1.87 | $ 41.33 | $ 85,960 |
| Spokane-Spokane Valley, WA | 160 | 0.65 | 1.83 | $ 19.69 | $ 40,960 |
| Orlando-Kissimmee-Sanford, FL | 870 | 0.64 | 1.81 | $ 22.13 | $ 46,030 |
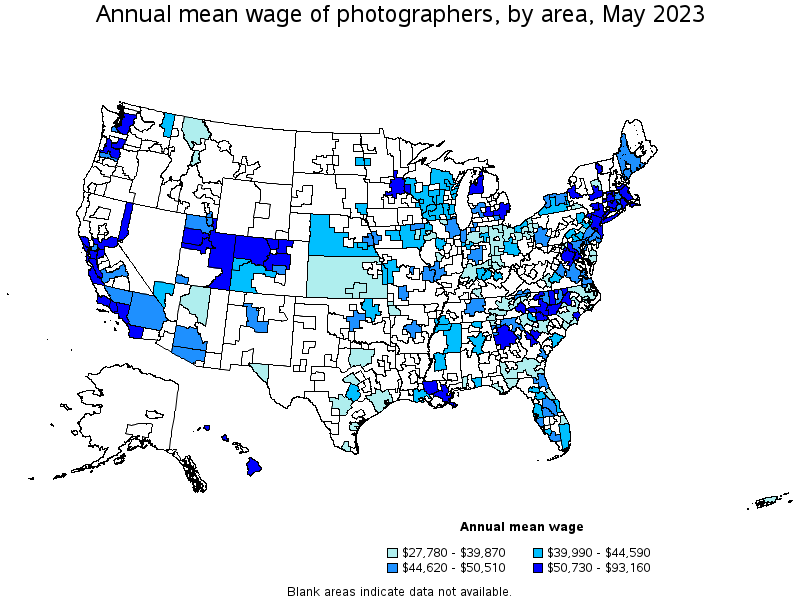
Top paying metropolitan areas for Photographers:
| Metropolitan area | Employment (1) | Employment per thousand jobs | Location quotient (9) | Hourly mean wage | Annual mean wage (2) |
|---|---|---|---|---|---|
| San Francisco-Oakland-Hayward, CA | 1,100 | 0.46 | 1.29 | $ 44.79 | $ 93,160 |
| Los Angeles-Long Beach-Anaheim, CA | 4,090 | 0.66 | 1.87 | $ 41.33 | $ 85,960 |
| New York-Newark-Jersey City, NY-NJ-PA | 4,010 | 0.42 | 1.20 | $ 39.93 | $ 83,050 |
| Burlington-South Burlington, VT | 30 | 0.27 | 0.78 | $ 35.61 | $ 74,060 |
| San Jose-Sunnyvale-Santa Clara, CA | 180 | 0.16 | 0.45 | $ 32.79 | $ 68,200 |
| Urban Honolulu, HI | 340 | 0.76 | 2.16 | $ 31.48 | $ 65,480 |
| Salinas, CA | 40 | 0.21 | 0.60 | $ 30.84 | $ 64,140 |
| Washington-Arlington-Alexandria, DC-VA-MD-WV | 800 | 0.26 | 0.73 | $ 30.68 | $ 63,820 |
| Providence-Warwick, RI-MA | 150 | 0.26 | 0.73 | $ 30.45 | $ 63,340 |
| Bridgeport-Stamford-Norwalk, CT | 100 | 0.24 | 0.68 | $ 29.85 | $ 62,090 |
Nonmetropolitan areas with the highest employment in Photographers:
| Nonmetropolitan area | Employment (1) | Employment per thousand jobs | Location quotient (9) | Hourly mean wage | Annual mean wage (2) |
|---|---|---|---|---|---|
| East Tennessee nonmetropolitan area | 240 | 1.72 | 4.88 | $ 16.94 | $ 35,240 |
| Southeast Coastal North Carolina nonmetropolitan area | 110 | 0.43 | 1.22 | $ 17.08 | $ 35,520 |
| Northwest Colorado nonmetropolitan area | 70 | 0.56 | 1.57 | $ 25.97 | $ 54,020 |
| South Nebraska nonmetropolitan area | 70 | 0.45 | 1.28 | $ 20.73 | $ 43,120 |
| North Northeastern Ohio nonmetropolitan area (noncontiguous) | 60 | 0.19 | 0.55 | $ 17.11 | $ 35,580 |
Nonmetropolitan areas with the highest concentration of jobs and location quotients in Photographers:
| Nonmetropolitan area | Employment (1) | Employment per thousand jobs | Location quotient (9) | Hourly mean wage | Annual mean wage (2) |
|---|---|---|---|---|---|
| East Tennessee nonmetropolitan area | 240 | 1.72 | 4.88 | $ 16.94 | $ 35,240 |
| Northeast Coastal North Carolina nonmetropolitan area | 60 | 0.66 | 1.88 | $ 18.61 | $ 38,710 |
| Massachusetts nonmetropolitan area | 40 | 0.61 | 1.73 | $ 28.51 | $ 59,290 |
| Northwest Colorado nonmetropolitan area | 70 | 0.56 | 1.57 | $ 25.97 | $ 54,020 |
| Southwest Colorado nonmetropolitan area | 60 | 0.54 | 1.52 | $ 19.72 | $ 41,020 |
Top paying nonmetropolitan areas for Photographers:
| Nonmetropolitan area | Employment (1) | Employment per thousand jobs | Location quotient (9) | Hourly mean wage | Annual mean wage (2) |
|---|---|---|---|---|---|
| Eastern Utah nonmetropolitan area | 40 | 0.46 | 1.31 | $ 37.84 | $ 78,710 |
| Hawaii / Kauai nonmetropolitan area | 40 | 0.43 | 1.21 | $ 31.23 | $ 64,970 |
| Massachusetts nonmetropolitan area | 40 | 0.61 | 1.73 | $ 28.51 | $ 59,290 |
| Northwest Colorado nonmetropolitan area | 70 | 0.56 | 1.57 | $ 25.97 | $ 54,020 |
| Northwest Lower Peninsula of Michigan nonmetropolitan area | 30 | 0.27 | 0.75 | $ 24.87 | $ 51,720 |
These estimates are calculated with data collected from employers in all industry sectors, all metropolitan and nonmetropolitan areas, and all states and the District of Columbia. The top employment and wage figures are provided above. The complete list is available in the downloadable XLS files.
The percentile wage estimate is the value of a wage below which a certain percent of workers fall. The median wage is the 50th percentile wage estimate—50 percent of workers earn less than the median and 50 percent of workers earn more than the median. More about percentile wages.
(1) Estimates for detailed occupations do not sum to the totals because the totals include occupations not shown separately. Estimates do not include self-employed workers.
(2) Annual wages have been calculated by multiplying the hourly mean wage by a "year-round, full-time" hours figure of 2,080 hours; for those occupations where there is not an hourly wage published, the annual wage has been directly calculated from the reported survey data.
(3) The relative standard error (RSE) is a measure of the reliability of a survey statistic. The smaller the relative standard error, the more precise the estimate.
(8) Estimate not released.
(9) The location quotient is the ratio of the area concentration of occupational employment to the national average concentration. A location quotient greater than one indicates the occupation has a higher share of employment than average, and a location quotient less than one indicates the occupation is less prevalent in the area than average.
Other OEWS estimates and related information:
May 2023 National Occupational Employment and Wage Estimates
May 2023 State Occupational Employment and Wage Estimates
May 2023 Metropolitan and Nonmetropolitan Area Occupational Employment and Wage Estimates
May 2023 National Industry-Specific Occupational Employment and Wage Estimates
Last Modified Date: April 3, 2024