
An official website of the United States government
An official website of the United States government
The .gov means it's official.
Federal government websites often end in .gov or .mil. Before sharing sensitive information,
make sure you're on a federal government site.
The site is secure.
The
https:// ensures that you are connecting to the official website and that any
information you provide is encrypted and transmitted securely.
Diagnose, treat, and provide preventive care to individuals and families across the lifespan. May refer patients to specialists when needed for further diagnosis or treatment. Excludes �General Internal Medicine Physicians� (29-1216) and �Pediatricians, General� (29-1221).
Employment estimate and mean wage estimates for Family Medicine Physicians:
| Employment (1) | Employment RSE (3) |
Mean hourly wage |
Mean annual wage (2) |
Wage RSE (3) |
|---|---|---|---|---|
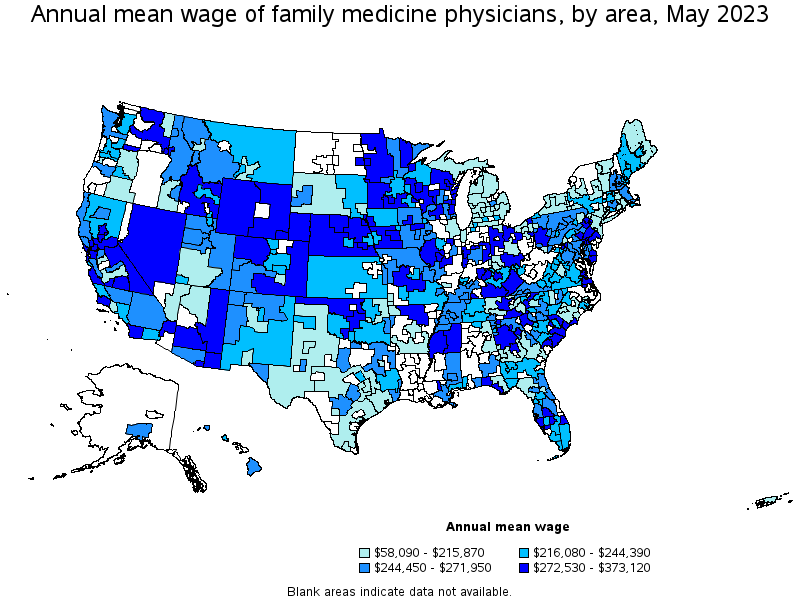
| 112,010 | 2.3 % | $ 115.77 | $ 240,790 | 1.6 % |
Percentile wage estimates for Family Medicine Physicians:
| Percentile | 10% | 25% | 50% (Median) |
75% | 90% |
|---|---|---|---|---|---|
| Hourly Wage | $ 33.12 | $ 73.47 | $ 108.00 | (5) | (5) |
| Annual Wage (2) | $ 68,890 | $ 152,810 | $ 224,640 | (5) | (5) |
Industries with the highest published employment and wages for Family Medicine Physicians are provided. For a list of all industries with employment in Family Medicine Physicians, see the Create Customized Tables function.
Industries with the highest levels of employment in Family Medicine Physicians:
| Industry | Employment (1) | Percent of industry employment | Hourly mean wage | Annual mean wage (2) |
|---|---|---|---|---|
| Offices of Physicians | 75,020 | 2.64 | $ 118.77 | $ 247,040 |
| Outpatient Care Centers | 7,310 | 0.69 | $ 115.67 | $ 240,600 |
| Colleges, Universities, and Professional Schools | 1,920 | 0.06 | $ 60.19 | $ 125,200 |
| State Government, excluding Schools and Hospitals (OEWS Designation) | 1,080 | 0.05 | $ 120.11 | $ 249,820 |
| Local Government, excluding Schools and Hospitals (OEWS Designation) | 920 | 0.02 | $ 129.17 | $ 268,670 |
Industries with the highest concentration of employment in Family Medicine Physicians:
| Industry | Employment (1) | Percent of industry employment | Hourly mean wage | Annual mean wage (2) |
|---|---|---|---|---|
| Offices of Physicians | 75,020 | 2.64 | $ 118.77 | $ 247,040 |
| Outpatient Care Centers | 7,310 | 0.69 | $ 115.67 | $ 240,600 |
| Psychiatric and Substance Abuse Hospitals | 180 | 0.08 | $ 109.86 | $ 228,500 |
| Colleges, Universities, and Professional Schools | 1,920 | 0.06 | $ 60.19 | $ 125,200 |
| Offices of Other Health Practitioners | 660 | 0.06 | $ 124.04 | $ 258,000 |
Top paying industries for Family Medicine Physicians:
| Industry | Employment (1) | Percent of industry employment | Hourly mean wage | Annual mean wage (2) |
|---|---|---|---|---|
| Insurance Carriers | 40 | (7) | (5) | (5) |
| Community Food and Housing, and Emergency and Other Relief Services | 40 | 0.02 | $ 138.54 | $ 288,160 |
| Local Government, excluding Schools and Hospitals (OEWS Designation) | 920 | 0.02 | $ 129.17 | $ 268,670 |
| Home Health Care Services | 220 | 0.01 | $ 128.53 | $ 267,340 |
| Other Ambulatory Health Care Services | 160 | 0.05 | $ 124.93 | $ 259,850 |
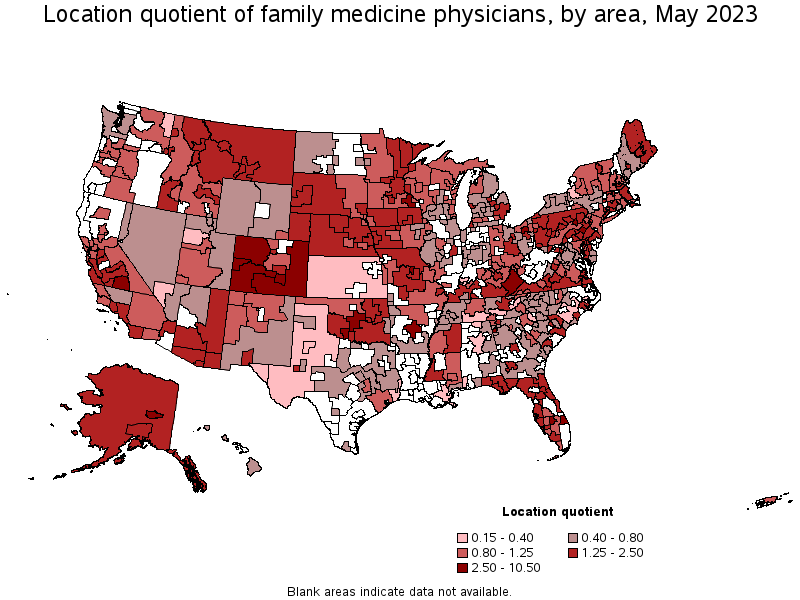
States and areas with the highest published employment, location quotients, and wages for Family Medicine Physicians are provided. For a list of all areas with employment in Family Medicine Physicians, see the Create Customized Tables function.
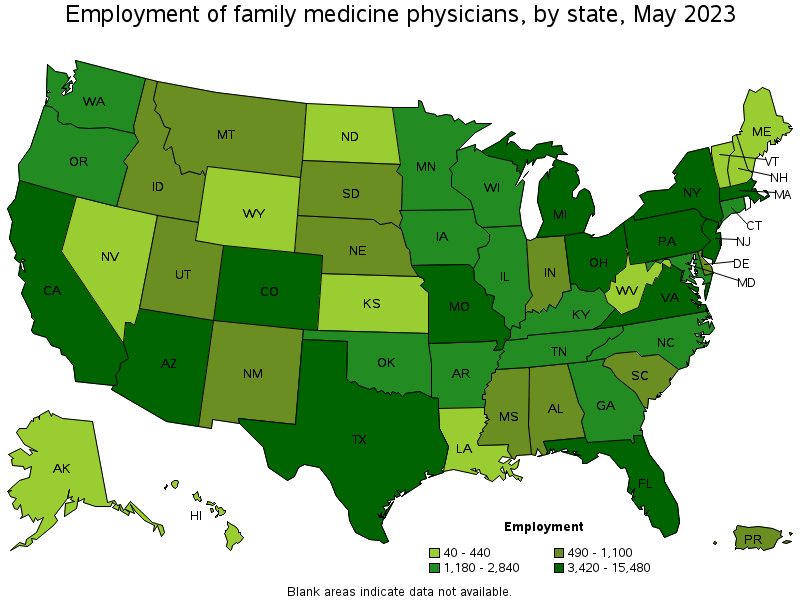
States with the highest employment level in Family Medicine Physicians:
| State | Employment (1) | Employment per thousand jobs | Location quotient (9) | Hourly mean wage | Annual mean wage (2) |
|---|---|---|---|---|---|
| California | 15,480 | 0.86 | 1.17 | $ 120.98 | $ 251,640 |
| Florida | 9,710 | 1.01 | 1.38 | $ 121.90 | $ 253,560 |
| Pennsylvania | 8,110 | 1.36 | 1.85 | $ 128.08 | $ 266,410 |
| Texas | 5,920 | 0.44 | 0.59 | $ 103.23 | $ 214,720 |
| Ohio | 5,080 | 0.93 | 1.26 | $ 77.97 | $ 162,180 |
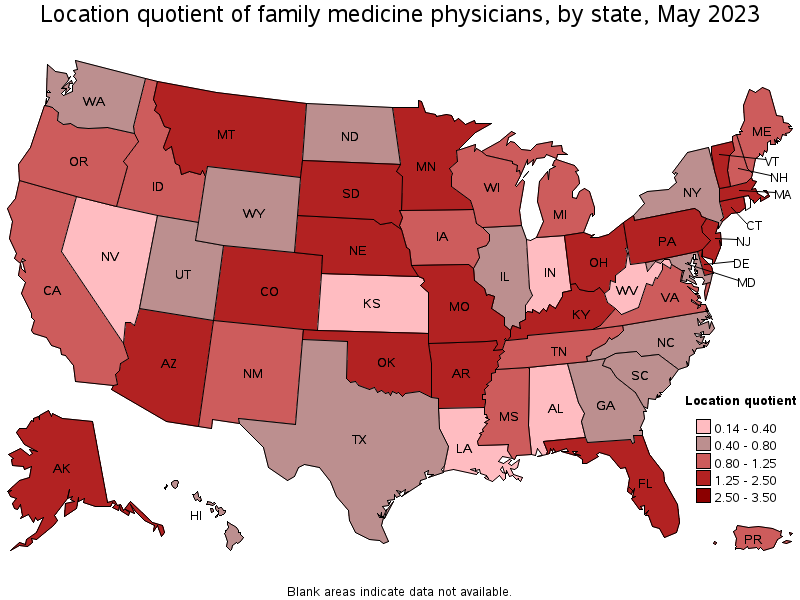
States with the highest concentration of jobs and location quotients in Family Medicine Physicians:
| State | Employment (1) | Employment per thousand jobs | Location quotient (9) | Hourly mean wage | Annual mean wage (2) |
|---|---|---|---|---|---|
| Oklahoma | 2,610 | 1.57 | 2.13 | $ 124.47 | $ 258,900 |
| Alaska | 440 | 1.42 | 1.93 | $ 131.61 | $ 273,740 |
| Pennsylvania | 8,110 | 1.36 | 1.85 | $ 128.08 | $ 266,410 |
| Montana | 640 | 1.28 | 1.74 | $ 111.19 | $ 231,280 |
| Arizona | 3,950 | 1.26 | 1.71 | $ 138.80 | $ 288,700 |
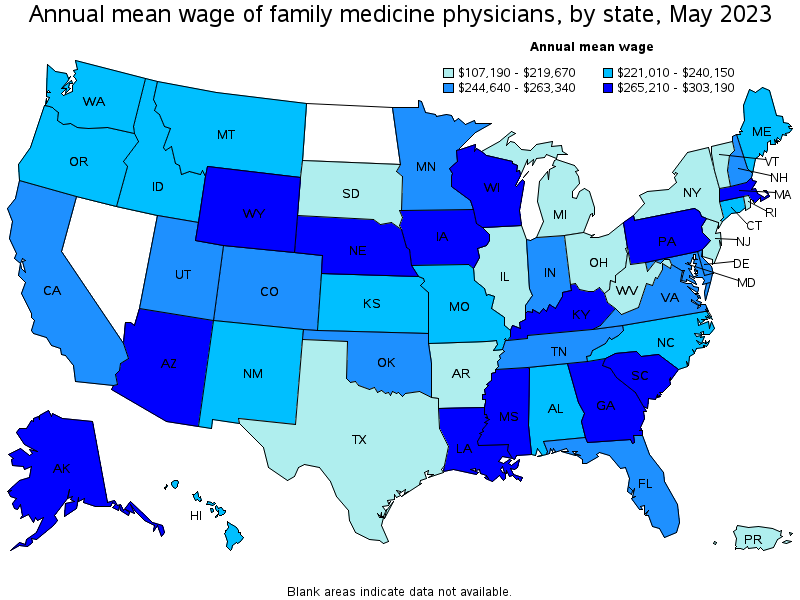
Top paying states for Family Medicine Physicians:
| State | Employment (1) | Employment per thousand jobs | Location quotient (9) | Hourly mean wage | Annual mean wage (2) |
|---|---|---|---|---|---|
| Wyoming | 140 | 0.51 | 0.69 | $ 145.77 | $ 303,190 |
| Mississippi | 920 | 0.80 | 1.08 | $ 140.39 | $ 292,020 |
| Arizona | 3,950 | 1.26 | 1.71 | $ 138.80 | $ 288,700 |
| South Carolina | 840 | 0.38 | 0.51 | $ 136.20 | $ 283,300 |
| Kentucky | 1,920 | 0.98 | 1.33 | $ 135.64 | $ 282,140 |
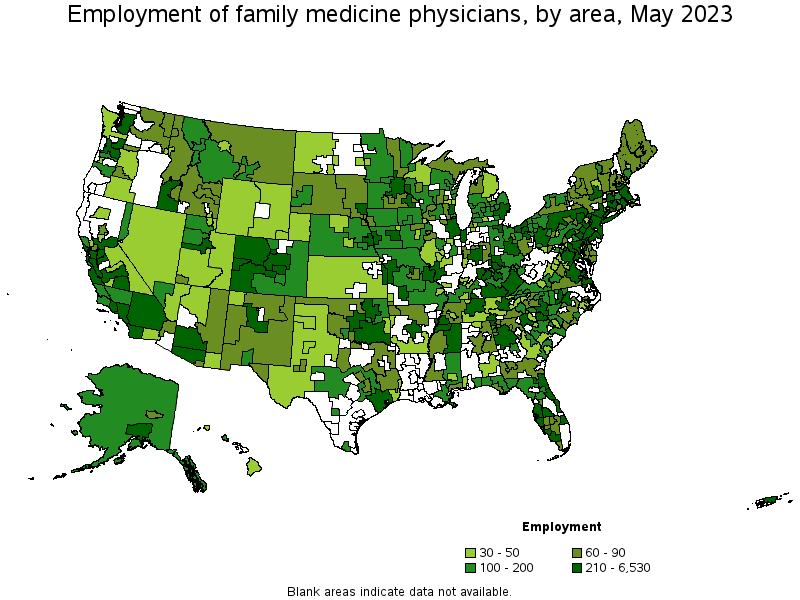
Metropolitan areas with the highest employment level in Family Medicine Physicians:
| Metropolitan area | Employment (1) | Employment per thousand jobs | Location quotient (9) | Hourly mean wage | Annual mean wage (2) |
|---|---|---|---|---|---|
| New York-Newark-Jersey City, NY-NJ-PA | 6,530 | 0.69 | 0.93 | $ 103.06 | $ 214,370 |
| Los Angeles-Long Beach-Anaheim, CA | 5,790 | 0.94 | 1.27 | $ 114.08 | $ 237,290 |
| Philadelphia-Camden-Wilmington, PA-NJ-DE-MD | 3,370 | 1.19 | 1.61 | $ 134.00 | $ 278,720 |
| Phoenix-Mesa-Scottsdale, AZ | 3,180 | 1.39 | 1.88 | $ 142.23 | $ 295,830 |
| Boston-Cambridge-Nashua, MA-NH | 2,850 | 1.03 | 1.40 | $ 130.47 | $ 271,370 |
| Houston-The Woodlands-Sugar Land, TX | 2,170 | 0.68 | 0.92 | $ 76.99 | $ 160,140 |
| Chicago-Naperville-Elgin, IL-IN-WI | 1,870 | 0.41 | 0.56 | $ 71.35 | $ 148,410 |
| Minneapolis-St. Paul-Bloomington, MN-WI | 1,800 | 0.94 | 1.28 | $ 114.80 | $ 238,780 |
| Detroit-Warren-Dearborn, MI | 1,760 | 0.93 | 1.25 | $ 75.89 | $ 157,850 |
| Washington-Arlington-Alexandria, DC-VA-MD-WV | 1,720 | 0.56 | 0.76 | $ 124.56 | $ 259,090 |
Metropolitan areas with the highest concentration of jobs and location quotients in Family Medicine Physicians:
| Metropolitan area | Employment (1) | Employment per thousand jobs | Location quotient (9) | Hourly mean wage | Annual mean wage (2) |
|---|---|---|---|---|---|
| Columbia, MO | 760 | 7.75 | 10.50 | (8) | (8) |
| Grand Junction, CO | 270 | 4.06 | 5.51 | $ 122.34 | $ 254,460 |
| Lawton, OK | 160 | 3.75 | 5.08 | $ 149.74 | $ 311,460 |
| Rome, GA | 120 | 2.88 | 3.91 | $ 115.56 | $ 240,370 |
| Sebring, FL | 80 | 2.83 | 3.83 | $ 144.05 | $ 299,620 |
| Fairbanks, AK | 90 | 2.65 | 3.60 | (8) | (8) |
| Reading, PA | 440 | 2.56 | 3.47 | $ 130.41 | $ 271,250 |
| Little Rock-North Little Rock-Conway, AR | 840 | 2.43 | 3.29 | $ 42.53 | $ 88,450 |
| Akron, OH | 700 | 2.19 | 2.97 | $ 93.59 | $ 194,670 |
| Pueblo, CO | 130 | 2.02 | 2.74 | $ 103.35 | $ 214,960 |
Top paying metropolitan areas for Family Medicine Physicians:
| Metropolitan area | Employment (1) | Employment per thousand jobs | Location quotient (9) | Hourly mean wage | Annual mean wage (2) |
|---|---|---|---|---|---|
| Hilton Head Island-Bluffton-Beaufort, SC | 40 | 0.47 | 0.63 | (5) | (5) |
| Las Vegas-Henderson-Paradise, NV | 180 | 0.17 | 0.23 | (5) | (5) |
| Napa, CA | 50 | 0.61 | 0.83 | $ 176.65 | $ 367,430 |
| Hammond, LA | (8) | (8) | (8) | $ 174.48 | $ 362,920 |
| Sioux City, IA-NE-SD | 60 | 0.70 | 0.95 | $ 162.22 | $ 337,410 |
| Port St. Lucie, FL | 320 | 1.97 | 2.68 | $ 156.86 | $ 326,270 |
| Yuba City, CA | 40 | 0.78 | 1.06 | $ 155.85 | $ 324,170 |
| Lewiston, ID-WA | 30 | 1.16 | 1.57 | $ 155.60 | $ 323,640 |
| North Port-Sarasota-Bradenton, FL | 440 | 1.37 | 1.86 | $ 153.29 | $ 318,850 |
| Salinas, CA | 210 | 1.18 | 1.60 | $ 152.92 | $ 318,080 |
Nonmetropolitan areas with the highest employment in Family Medicine Physicians:
| Nonmetropolitan area | Employment (1) | Employment per thousand jobs | Location quotient (9) | Hourly mean wage | Annual mean wage (2) |
|---|---|---|---|---|---|
| Northwest Colorado nonmetropolitan area | 320 | 2.53 | 3.43 | $ 152.95 | $ 318,130 |
| Northeast Mississippi nonmetropolitan area | 300 | 1.32 | 1.79 | $ 139.40 | $ 289,950 |
| Southeast Oklahoma nonmetropolitan area | 250 | 1.45 | 1.97 | $ 107.70 | $ 224,010 |
| Southwest Colorado nonmetropolitan area | 250 | 2.40 | 3.26 | $ 126.81 | $ 263,760 |
| East Kentucky nonmetropolitan area | 230 | 2.31 | 3.13 | $ 138.32 | $ 287,710 |
Nonmetropolitan areas with the highest concentration of jobs and location quotients in Family Medicine Physicians:
| Nonmetropolitan area | Employment (1) | Employment per thousand jobs | Location quotient (9) | Hourly mean wage | Annual mean wage (2) |
|---|---|---|---|---|---|
| Northwest Colorado nonmetropolitan area | 320 | 2.53 | 3.43 | $ 152.95 | $ 318,130 |
| Southwest Colorado nonmetropolitan area | 250 | 2.40 | 3.26 | $ 126.81 | $ 263,760 |
| East Kentucky nonmetropolitan area | 230 | 2.31 | 3.13 | $ 138.32 | $ 287,710 |
| Eastern and Southern Colorado nonmetropolitan area | 140 | 2.11 | 2.87 | $ 146.24 | $ 304,190 |
| Southwest Virginia nonmetropolitan area | 180 | 1.54 | 2.09 | $ 129.03 | $ 268,390 |
Top paying nonmetropolitan areas for Family Medicine Physicians:
| Nonmetropolitan area | Employment (1) | Employment per thousand jobs | Location quotient (9) | Hourly mean wage | Annual mean wage (2) |
|---|---|---|---|---|---|
| West North Dakota nonmetropolitan area | 40 | 0.32 | 0.44 | (5) | (5) |
| West Northwestern Ohio nonmetropolitan area | 190 | 0.75 | 1.02 | $ 179.39 | $ 373,120 |
| Southeast Minnesota nonmetropolitan area | 90 | 0.60 | 0.81 | $ 177.96 | $ 370,150 |
| Northwest Mississippi nonmetropolitan area | 60 | 0.72 | 0.97 | $ 171.47 | $ 356,660 |
| Eastern Sierra-Mother Lode Region of California nonmetropolitan area | 50 | 0.80 | 1.08 | $ 166.28 | $ 345,860 |
These estimates are calculated with data collected from employers in all industry sectors, all metropolitan and nonmetropolitan areas, and all states and the District of Columbia. The top employment and wage figures are provided above. The complete list is available in the downloadable XLS files.
The percentile wage estimate is the value of a wage below which a certain percent of workers fall. The median wage is the 50th percentile wage estimate—50 percent of workers earn less than the median and 50 percent of workers earn more than the median. More about percentile wages.
(1) Estimates for detailed occupations do not sum to the totals because the totals include occupations not shown separately. Estimates do not include self-employed workers.
(2) Annual wages have been calculated by multiplying the hourly mean wage by a "year-round, full-time" hours figure of 2,080 hours; for those occupations where there is not an hourly wage published, the annual wage has been directly calculated from the reported survey data.
(3) The relative standard error (RSE) is a measure of the reliability of a survey statistic. The smaller the relative standard error, the more precise the estimate.
(5) This wage is equal to or greater than $115.00 per hour or $239,200 per year.
(7) The value is less than .005 percent of industry employment.
(8) Estimate not released.
(9) The location quotient is the ratio of the area concentration of occupational employment to the national average concentration. A location quotient greater than one indicates the occupation has a higher share of employment than average, and a location quotient less than one indicates the occupation is less prevalent in the area than average.
Other OEWS estimates and related information:
May 2023 National Occupational Employment and Wage Estimates
May 2023 State Occupational Employment and Wage Estimates
May 2023 Metropolitan and Nonmetropolitan Area Occupational Employment and Wage Estimates
May 2023 National Industry-Specific Occupational Employment and Wage Estimates
Last Modified Date: April 3, 2024