An official website of the United States government
 United States Department of Labor
This occupation includes the 2018 SOC occupations 39-7011 Tour Guides and Escorts and 39-7012 Travel Guides.
Employment estimate and mean wage estimates for Tour and Travel Guides:
| Employment (1) | Employment RSE (3) |
Mean hourly wage |
Mean annual wage (2) |
Wage RSE (3) |
|---|---|---|---|---|
| 46,760 | 2.4 % | $ 19.37 | $ 40,280 | 1.5 % |
Percentile wage estimates for Tour and Travel Guides:
| Percentile | 10% | 25% | 50% (Median) |
75% | 90% |
|---|---|---|---|---|---|
| Hourly Wage | $ 12.47 | $ 14.68 | $ 17.34 | $ 21.41 | $ 28.18 |
| Annual Wage (2) | $ 25,930 | $ 30,530 | $ 36,060 | $ 44,520 | $ 58,620 |
Industries with the highest published employment and wages for Tour and Travel Guides are provided. For a list of all industries with employment in Tour and Travel Guides, see the Create Customized Tables function.
Industries with the highest levels of employment in Tour and Travel Guides:
| Industry | Employment (1) | Percent of industry employment | Hourly mean wage | Annual mean wage (2) |
|---|---|---|---|---|
| Museums, Historical Sites, and Similar Institutions | 15,280 | 9.02 | $ 16.86 | $ 35,060 |
| Other Amusement and Recreation Industries | 7,990 | 0.58 | $ 22.04 | $ 45,830 |
| Travel Arrangement and Reservation Services | 7,380 | 3.91 | $ 21.73 | $ 45,200 |
| Scenic and Sightseeing Transportation, Land | 2,350 | 21.70 | $ 20.63 | $ 42,900 |
| Local Government, excluding Schools and Hospitals (OEWS Designation) | 1,640 | 0.03 | $ 15.99 | $ 33,250 |
Industries with the highest concentration of employment in Tour and Travel Guides:
| Industry | Employment (1) | Percent of industry employment | Hourly mean wage | Annual mean wage (2) |
|---|---|---|---|---|
| Scenic and Sightseeing Transportation, Land | 2,350 | 21.70 | $ 20.63 | $ 42,900 |
| Museums, Historical Sites, and Similar Institutions | 15,280 | 9.02 | $ 16.86 | $ 35,060 |
| Scenic and Sightseeing Transportation, Other | 210 | 8.26 | $ 19.07 | $ 39,660 |
| Scenic and Sightseeing Transportation, Water | 960 | 5.73 | $ 19.59 | $ 40,760 |
| Travel Arrangement and Reservation Services | 7,380 | 3.91 | $ 21.73 | $ 45,200 |
Top paying industries for Tour and Travel Guides:
| Industry | Employment (1) | Percent of industry employment | Hourly mean wage | Annual mean wage (2) |
|---|---|---|---|---|
| Other Support Services | 230 | 0.07 | $ 29.12 | $ 60,580 |
| Sporting Goods, Hobby, and Musical Instrument Retailers | 380 | 0.08 | $ 26.56 | $ 55,250 |
| Inland Water Transportation | 70 | 0.26 | $ 24.21 | $ 50,350 |
| Grantmaking and Giving Services | 60 | 0.04 | $ 23.74 | $ 49,380 |
| Civic and Social Organizations | 640 | 0.19 | $ 22.86 | $ 47,540 |
States and areas with the highest published employment, location quotients, and wages for Tour and Travel Guides are provided. For a list of all areas with employment in Tour and Travel Guides, see the Create Customized Tables function.
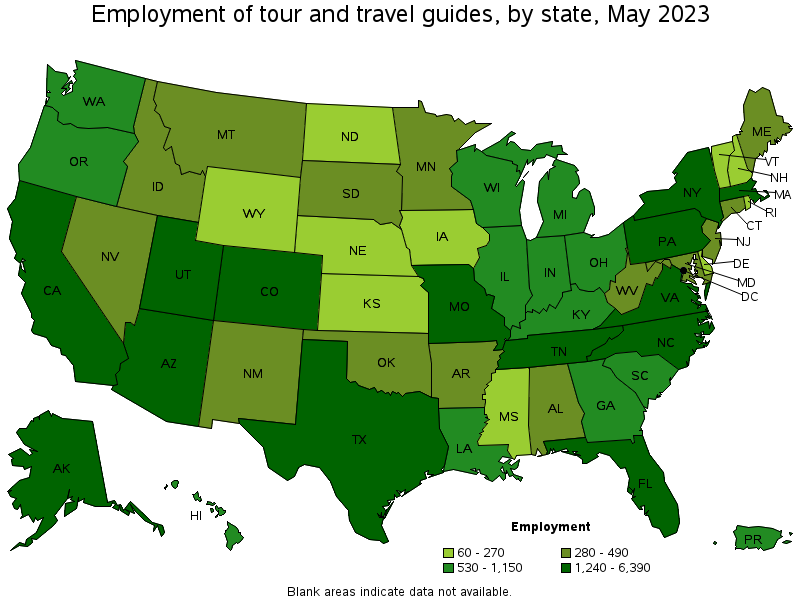
States with the highest employment level in Tour and Travel Guides:
| State | Employment (1) | Employment per thousand jobs | Location quotient (9) | Hourly mean wage | Annual mean wage (2) |
|---|---|---|---|---|---|
| California | 6,390 | 0.36 | 1.16 | $ 21.49 | $ 44,690 |
| New York | 2,580 | 0.27 | 0.89 | $ 23.08 | $ 48,010 |
| Colorado | 2,360 | 0.83 | 2.70 | $ 23.24 | $ 48,350 |
| Florida | 2,290 | 0.24 | 0.78 | $ 17.16 | $ 35,680 |
| Texas | 2,110 | 0.16 | 0.51 | $ 18.46 | $ 38,400 |
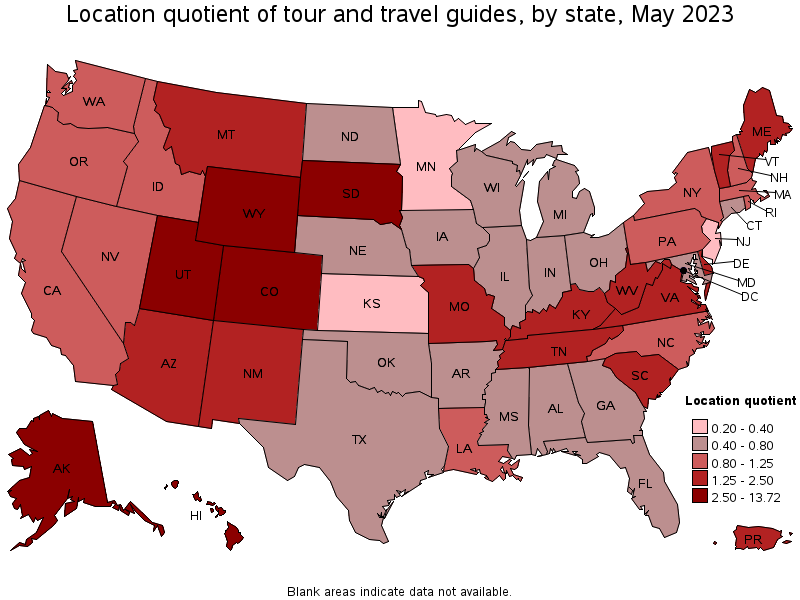
States with the highest concentration of jobs and location quotients in Tour and Travel Guides:
| State | Employment (1) | Employment per thousand jobs | Location quotient (9) | Hourly mean wage | Annual mean wage (2) |
|---|---|---|---|---|---|
| Alaska | 1,320 | 4.23 | 13.72 | $ 23.82 | $ 49,540 |
| Hawaii | 970 | 1.57 | 5.10 | $ 21.04 | $ 43,770 |
| Wyoming | 270 | 0.98 | 3.19 | $ 29.52 | $ 61,410 |
| Utah | 1,420 | 0.85 | 2.75 | $ 17.67 | $ 36,760 |
| Colorado | 2,360 | 0.83 | 2.70 | $ 23.24 | $ 48,350 |
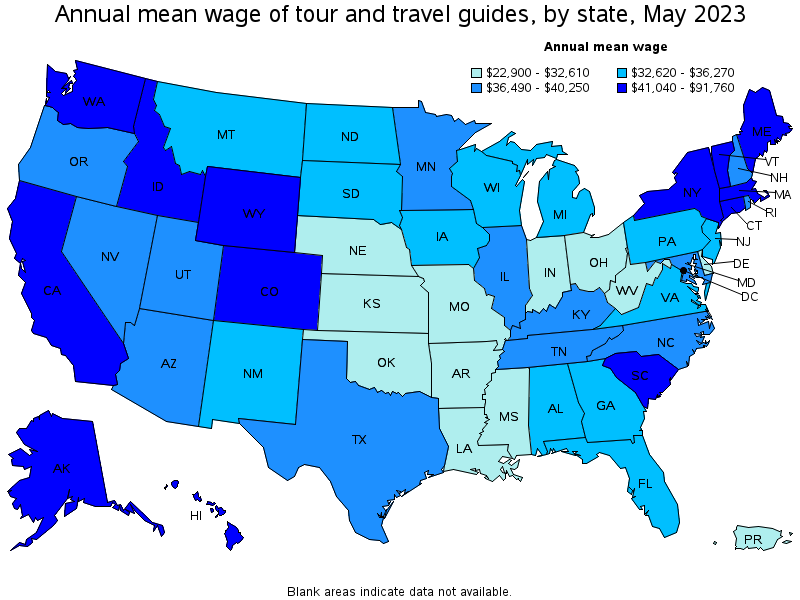
Top paying states for Tour and Travel Guides:
| State | Employment (1) | Employment per thousand jobs | Location quotient (9) | Hourly mean wage | Annual mean wage (2) |
|---|---|---|---|---|---|
| Idaho | 310 | 0.37 | 1.21 | $ 44.12 | $ 91,760 |
| Wyoming | 270 | 0.98 | 3.19 | $ 29.52 | $ 61,410 |
| District of Columbia | 240 | 0.35 | 1.13 | $ 26.22 | $ 54,540 |
| South Carolina | 980 | 0.44 | 1.43 | $ 24.49 | $ 50,930 |
| Alaska | 1,320 | 4.23 | 13.72 | $ 23.82 | $ 49,540 |
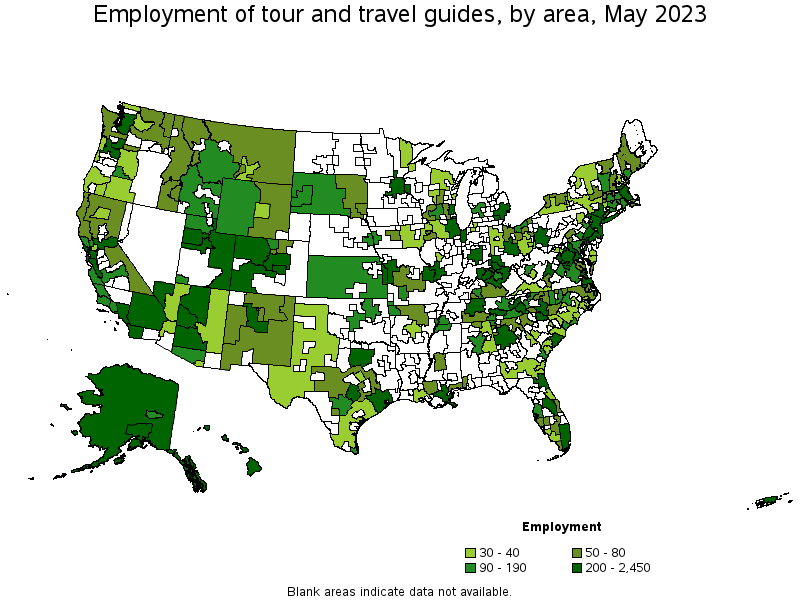
Metropolitan areas with the highest employment level in Tour and Travel Guides:
| Metropolitan area | Employment (1) | Employment per thousand jobs | Location quotient (9) | Hourly mean wage | Annual mean wage (2) |
|---|---|---|---|---|---|
| New York-Newark-Jersey City, NY-NJ-PA | 2,450 | 0.26 | 0.84 | $ 23.32 | $ 48,510 |
| Los Angeles-Long Beach-Anaheim, CA | 1,890 | 0.31 | 0.99 | $ 20.61 | $ 42,870 |
| San Francisco-Oakland-Hayward, CA | 1,100 | 0.45 | 1.48 | $ 23.85 | $ 49,610 |
| Denver-Aurora-Lakewood, CO | 1,020 | 0.64 | 2.09 | $ 24.64 | $ 51,260 |
| Boston-Cambridge-Nashua, MA-NH | 920 | 0.33 | 1.08 | $ 19.90 | $ 41,390 |
| San Diego-Carlsbad, CA | 890 | 0.59 | 1.90 | $ 21.62 | $ 44,960 |
| Chicago-Naperville-Elgin, IL-IN-WI | 880 | 0.19 | 0.63 | $ 19.06 | $ 39,640 |
| Phoenix-Mesa-Scottsdale, AZ | 830 | 0.36 | 1.18 | $ 19.78 | $ 41,130 |
| St. Louis, MO-IL | 830 | 0.63 | 2.03 | $ 15.29 | $ 31,800 |
| Philadelphia-Camden-Wilmington, PA-NJ-DE-MD | 830 | 0.29 | 0.95 | $ 17.13 | $ 35,630 |
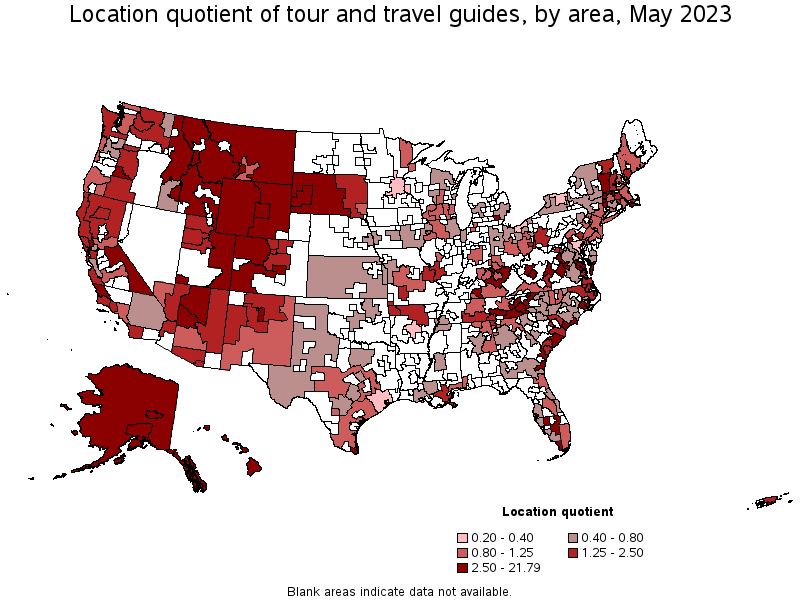
Metropolitan areas with the highest concentration of jobs and location quotients in Tour and Travel Guides:
| Metropolitan area | Employment (1) | Employment per thousand jobs | Location quotient (9) | Hourly mean wage | Annual mean wage (2) |
|---|---|---|---|---|---|
| Flagstaff, AZ | 430 | 6.71 | 21.79 | $ 19.00 | $ 39,510 |
| Fairbanks, AK | 130 | 3.82 | 12.39 | $ 21.18 | $ 44,050 |
| Prescott, AZ | 250 | 3.65 | 11.84 | $ 19.44 | $ 40,440 |
| Anchorage, AK | 490 | 2.90 | 9.43 | $ 22.02 | $ 45,790 |
| Kahului-Wailuku-Lahaina, HI | 200 | 2.60 | 8.44 | $ 22.56 | $ 46,930 |
| Napa, CA | 130 | 1.69 | 5.48 | $ 19.87 | $ 41,330 |
| Asheville, NC | 330 | 1.63 | 5.30 | $ 16.97 | $ 35,290 |
| Rapid City, SD | 110 | 1.49 | 4.85 | $ 16.16 | $ 33,620 |
| Pittsfield, MA | 60 | 1.45 | 4.72 | $ 22.84 | $ 47,510 |
| Gettysburg, PA | 50 | 1.45 | 4.71 | $ 16.19 | $ 33,680 |
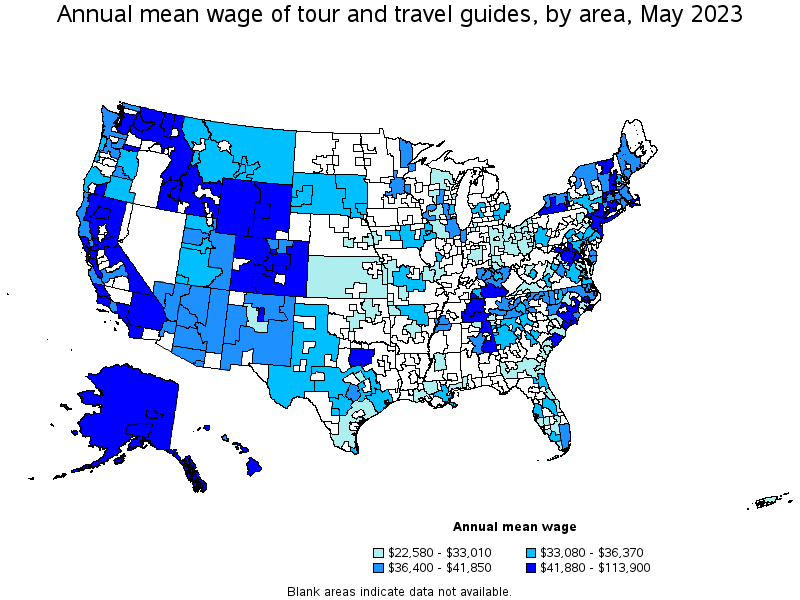
Top paying metropolitan areas for Tour and Travel Guides:
| Metropolitan area | Employment (1) | Employment per thousand jobs | Location quotient (9) | Hourly mean wage | Annual mean wage (2) |
|---|---|---|---|---|---|
| Myrtle Beach-Conway-North Myrtle Beach, SC-NC | 160 | 0.87 | 2.82 | $ 34.95 | $ 72,690 |
| Boise City, ID | 70 | 0.18 | 0.59 | $ 32.56 | $ 67,720 |
| Casper, WY | 30 | 0.80 | 2.61 | $ 27.50 | $ 57,200 |
| Charleston-North Charleston, SC | 470 | 1.26 | 4.10 | $ 27.01 | $ 56,180 |
| Seattle-Tacoma-Bellevue, WA | 720 | 0.34 | 1.12 | $ 25.29 | $ 52,600 |
| Bridgeport-Stamford-Norwalk, CT | 90 | 0.22 | 0.71 | $ 25.17 | $ 52,360 |
| Boulder, CO | 80 | 0.43 | 1.38 | $ 24.75 | $ 51,490 |
| Denver-Aurora-Lakewood, CO | 1,020 | 0.64 | 2.09 | $ 24.64 | $ 51,260 |
| San Francisco-Oakland-Hayward, CA | 1,100 | 0.45 | 1.48 | $ 23.85 | $ 49,610 |
| New York-Newark-Jersey City, NY-NJ-PA | 2,450 | 0.26 | 0.84 | $ 23.32 | $ 48,510 |
Nonmetropolitan areas with the highest employment in Tour and Travel Guides:
| Nonmetropolitan area | Employment (1) | Employment per thousand jobs | Location quotient (9) | Hourly mean wage | Annual mean wage (2) |
|---|---|---|---|---|---|
| Alaska nonmetropolitan area | 680 | 6.65 | 21.61 | $ 25.62 | $ 53,280 |
| Eastern Utah nonmetropolitan area | 320 | 3.58 | 11.62 | $ 19.09 | $ 39,710 |
| Northwest Colorado nonmetropolitan area | 310 | 2.47 | 8.03 | $ 23.14 | $ 48,130 |
| East Tennessee nonmetropolitan area | 290 | 2.06 | 6.69 | $ 18.81 | $ 39,110 |
| Southwest Colorado nonmetropolitan area | 280 | 2.73 | 8.88 | $ 24.06 | $ 50,040 |
Nonmetropolitan areas with the highest concentration of jobs and location quotients in Tour and Travel Guides:
| Nonmetropolitan area | Employment (1) | Employment per thousand jobs | Location quotient (9) | Hourly mean wage | Annual mean wage (2) |
|---|---|---|---|---|---|
| Alaska nonmetropolitan area | 680 | 6.65 | 21.61 | $ 25.62 | $ 53,280 |
| Eastern Utah nonmetropolitan area | 320 | 3.58 | 11.62 | $ 19.09 | $ 39,710 |
| Northwest Virginia nonmetropolitan area | 200 | 3.05 | 9.90 | $ 14.06 | $ 29,240 |
| Southwest Colorado nonmetropolitan area | 280 | 2.73 | 8.88 | $ 24.06 | $ 50,040 |
| Hawaii / Kauai nonmetropolitan area | 250 | 2.50 | 8.13 | $ 22.01 | $ 45,780 |
Top paying nonmetropolitan areas for Tour and Travel Guides:
| Nonmetropolitan area | Employment (1) | Employment per thousand jobs | Location quotient (9) | Hourly mean wage | Annual mean wage (2) |
|---|---|---|---|---|---|
| Northwestern Idaho nonmetropolitan area | 70 | 0.91 | 2.94 | $ 54.76 | $ 113,900 |
| Southeast-Central Idaho nonmetropolitan area | 90 | 0.98 | 3.19 | $ 36.47 | $ 75,850 |
| Western Wyoming nonmetropolitan area | 150 | 1.48 | 4.79 | $ 31.41 | $ 65,340 |
| Southeast Coastal North Carolina nonmetropolitan area | 40 | 0.15 | 0.50 | $ 31.31 | $ 65,120 |
| Eastern Wyoming nonmetropolitan area | 80 | 0.92 | 2.99 | $ 27.04 | $ 56,240 |
These estimates are calculated with data collected from employers in all industry sectors, all metropolitan and nonmetropolitan areas, and all states and the District of Columbia. The top employment and wage figures are provided above. The complete list is available in the downloadable XLS files.
The percentile wage estimate is the value of a wage below which a certain percent of workers fall. The median wage is the 50th percentile wage estimate—50 percent of workers earn less than the median and 50 percent of workers earn more than the median. More about percentile wages.
(1) Estimates for detailed occupations do not sum to the totals because the totals include occupations not shown separately. Estimates do not include self-employed workers.
(2) Annual wages have been calculated by multiplying the hourly mean wage by a "year-round, full-time" hours figure of 2,080 hours; for those occupations where there is not an hourly wage published, the annual wage has been directly calculated from the reported survey data.
(3) The relative standard error (RSE) is a measure of the reliability of a survey statistic. The smaller the relative standard error, the more precise the estimate.
(9) The location quotient is the ratio of the area concentration of occupational employment to the national average concentration. A location quotient greater than one indicates the occupation has a higher share of employment than average, and a location quotient less than one indicates the occupation is less prevalent in the area than average.
Other OEWS estimates and related information:
May 2023 National Occupational Employment and Wage Estimates
May 2023 State Occupational Employment and Wage Estimates
May 2023 Metropolitan and Nonmetropolitan Area Occupational Employment and Wage Estimates
May 2023 National Industry-Specific Occupational Employment and Wage Estimates
Last Modified Date: April 3, 2024