
An official website of the United States government
An official website of the United States government
The .gov means it's official.
Federal government websites often end in .gov or .mil. Before sharing sensitive information,
make sure you're on a federal government site.
The site is secure.
The
https:// ensures that you are connecting to the official website and that any
information you provide is encrypted and transmitted securely.
Replace or repair broken windshields and window glass in motor vehicles.
Employment estimate and mean wage estimates for Automotive Glass Installers and Repairers:
| Employment (1) | Employment RSE (3) |
Mean hourly wage |
Mean annual wage (2) |
Wage RSE (3) |
|---|---|---|---|---|
| 16,890 | 5.4 % | $ 22.12 | $ 46,010 | 0.9 % |
Percentile wage estimates for Automotive Glass Installers and Repairers:
| Percentile | 10% | 25% | 50% (Median) |
75% | 90% |
|---|---|---|---|---|---|
| Hourly Wage | $ 15.08 | $ 17.88 | $ 21.79 | $ 24.99 | $ 29.81 |
| Annual Wage (2) | $ 31,370 | $ 37,180 | $ 45,320 | $ 51,970 | $ 62,000 |
Industries with the highest published employment and wages for Automotive Glass Installers and Repairers are provided. For a list of all industries with employment in Automotive Glass Installers and Repairers, see the Create Customized Tables function.
Industries with the highest levels of employment in Automotive Glass Installers and Repairers:
| Industry | Employment (1) | Percent of industry employment | Hourly mean wage | Annual mean wage (2) |
|---|---|---|---|---|
| Automotive Repair and Maintenance | 14,800 | 1.48 | $ 22.12 | $ 46,000 |
| Foundation, Structure, and Building Exterior Contractors | 890 | 0.09 | $ 23.49 | $ 48,850 |
| Automobile Dealers | 330 | 0.03 | $ 21.41 | $ 44,520 |
| Automotive Parts, Accessories, and Tire Retailers | 230 | 0.04 | $ 21.72 | $ 45,170 |
| Employment Services | 60 | 0.00 | $ 20.86 | $ 43,380 |
Industries with the highest concentration of employment in Automotive Glass Installers and Repairers:
| Industry | Employment (1) | Percent of industry employment | Hourly mean wage | Annual mean wage (2) |
|---|---|---|---|---|
| Automotive Repair and Maintenance | 14,800 | 1.48 | $ 22.12 | $ 46,000 |
| Foundation, Structure, and Building Exterior Contractors | 890 | 0.09 | $ 23.49 | $ 48,850 |
| Automotive Parts, Accessories, and Tire Retailers | 230 | 0.04 | $ 21.72 | $ 45,170 |
| Automobile Dealers | 330 | 0.03 | $ 21.41 | $ 44,520 |
| Motor Vehicle and Motor Vehicle Parts and Supplies Merchant Wholesalers | 50 | 0.01 | $ 21.20 | $ 44,090 |
Top paying industries for Automotive Glass Installers and Repairers:
| Industry | Employment (1) | Percent of industry employment | Hourly mean wage | Annual mean wage (2) |
|---|---|---|---|---|
| Foundation, Structure, and Building Exterior Contractors | 890 | 0.09 | $ 23.49 | $ 48,850 |
| Automotive Repair and Maintenance | 14,800 | 1.48 | $ 22.12 | $ 46,000 |
| Automotive Parts, Accessories, and Tire Retailers | 230 | 0.04 | $ 21.72 | $ 45,170 |
| Automobile Dealers | 330 | 0.03 | $ 21.41 | $ 44,520 |
| Motor Vehicle and Motor Vehicle Parts and Supplies Merchant Wholesalers | 50 | 0.01 | $ 21.20 | $ 44,090 |
States and areas with the highest published employment, location quotients, and wages for Automotive Glass Installers and Repairers are provided. For a list of all areas with employment in Automotive Glass Installers and Repairers, see the Create Customized Tables function.
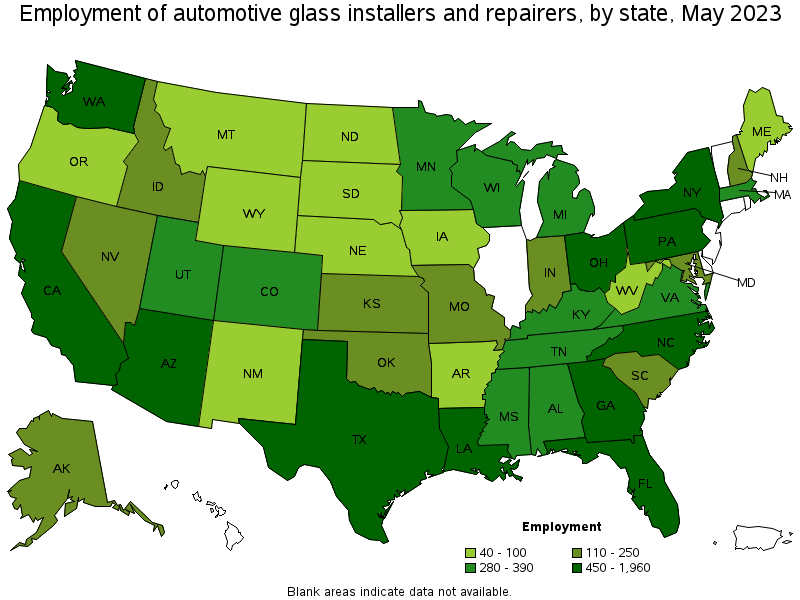
States with the highest employment level in Automotive Glass Installers and Repairers:
| State | Employment (1) | Employment per thousand jobs | Location quotient (9) | Hourly mean wage | Annual mean wage (2) |
|---|---|---|---|---|---|
| Florida | 1,960 | 0.20 | 1.84 | $ 22.66 | $ 47,120 |
| Texas | 1,800 | 0.13 | 1.19 | $ 20.20 | $ 42,020 |
| California | 1,800 | 0.10 | 0.90 | $ 23.81 | $ 49,510 |
| Arizona | 900 | 0.29 | 2.58 | $ 20.34 | $ 42,300 |
| New York | 710 | 0.08 | 0.68 | $ 24.20 | $ 50,340 |
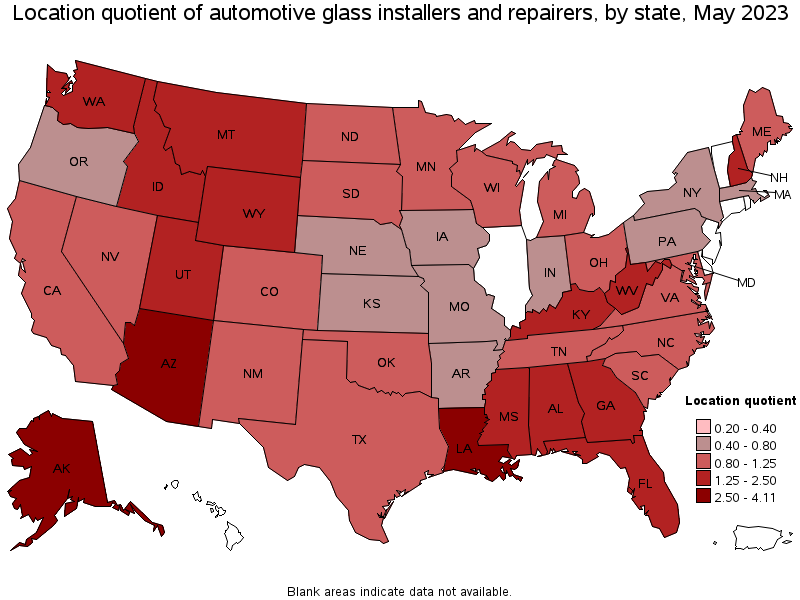
States with the highest concentration of jobs and location quotients in Automotive Glass Installers and Repairers:
| State | Employment (1) | Employment per thousand jobs | Location quotient (9) | Hourly mean wage | Annual mean wage (2) |
|---|---|---|---|---|---|
| Alaska | 140 | 0.46 | 4.11 | $ 23.69 | $ 49,270 |
| Louisiana | 550 | 0.30 | 2.69 | $ 17.33 | $ 36,050 |
| Arizona | 900 | 0.29 | 2.58 | $ 20.34 | $ 42,300 |
| Mississippi | 300 | 0.26 | 2.35 | $ 17.15 | $ 35,680 |
| Wyoming | 70 | 0.24 | 2.17 | $ 21.25 | $ 44,190 |
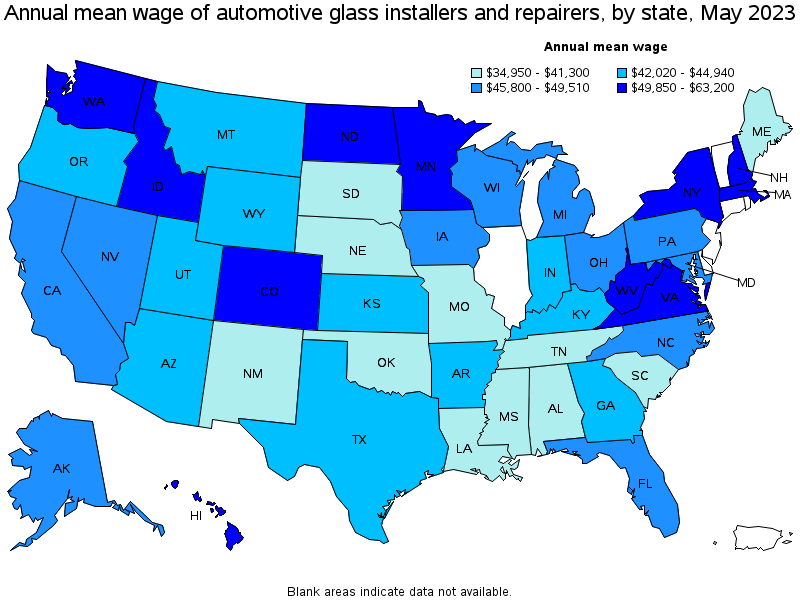
Top paying states for Automotive Glass Installers and Repairers:
| State | Employment (1) | Employment per thousand jobs | Location quotient (9) | Hourly mean wage | Annual mean wage (2) |
|---|---|---|---|---|---|
| Minnesota | 290 | 0.10 | 0.91 | $ 30.38 | $ 63,200 |
| North Dakota | 50 | 0.12 | 1.06 | $ 27.38 | $ 56,950 |
| Washington | 520 | 0.15 | 1.34 | $ 26.54 | $ 55,200 |
| New Hampshire | 140 | 0.21 | 1.87 | $ 25.60 | $ 53,240 |
| West Virginia | 100 | 0.14 | 1.25 | $ 24.89 | $ 51,770 |
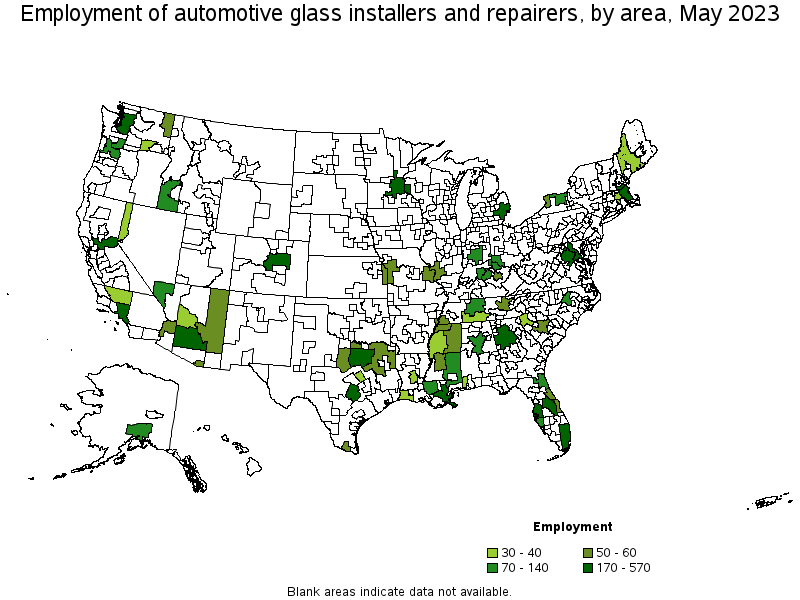
Metropolitan areas with the highest employment level in Automotive Glass Installers and Repairers:
| Metropolitan area | Employment (1) | Employment per thousand jobs | Location quotient (9) | Hourly mean wage | Annual mean wage (2) |
|---|---|---|---|---|---|
| Phoenix-Mesa-Scottsdale, AZ | 570 | 0.25 | 2.24 | $ 21.11 | $ 43,900 |
| Atlanta-Sandy Springs-Roswell, GA | 490 | 0.17 | 1.57 | $ 22.11 | $ 45,990 |
| Los Angeles-Long Beach-Anaheim, CA | 470 | 0.08 | 0.68 | $ 23.29 | $ 48,440 |
| Miami-Fort Lauderdale-West Palm Beach, FL | 470 | 0.17 | 1.54 | $ 23.35 | $ 48,570 |
| Orlando-Kissimmee-Sanford, FL | 340 | 0.25 | 2.25 | $ 22.92 | $ 47,660 |
| Dallas-Fort Worth-Arlington, TX | 290 | 0.07 | 0.67 | $ 22.20 | $ 46,180 |
| Tampa-St. Petersburg-Clearwater, FL | 280 | 0.20 | 1.81 | $ 22.17 | $ 46,100 |
| Seattle-Tacoma-Bellevue, WA | 230 | 0.11 | 1.01 | $ 28.28 | $ 58,820 |
| Detroit-Warren-Dearborn, MI | 220 | 0.11 | 1.03 | $ 22.73 | $ 47,290 |
| Denver-Aurora-Lakewood, CO | 210 | 0.13 | 1.16 | $ 24.20 | $ 50,340 |
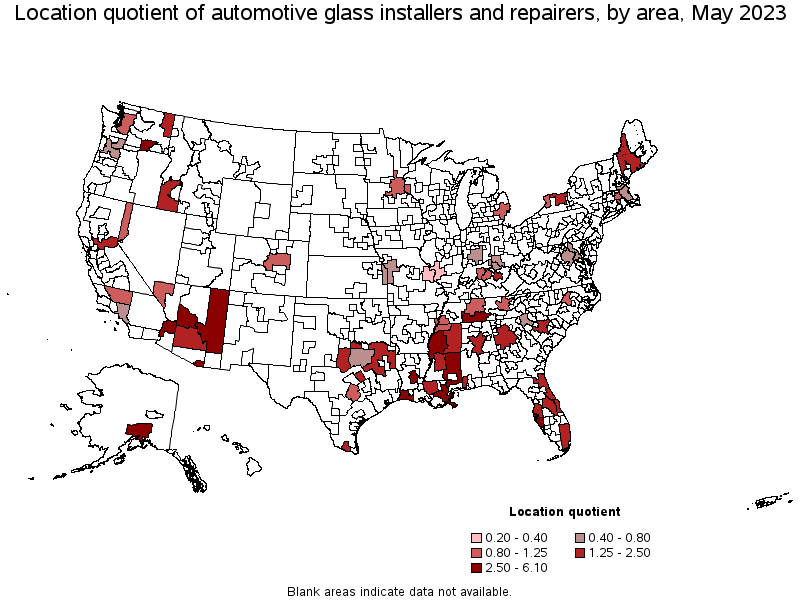
Metropolitan areas with the highest concentration of jobs and location quotients in Automotive Glass Installers and Repairers:
| Metropolitan area | Employment (1) | Employment per thousand jobs | Location quotient (9) | Hourly mean wage | Annual mean wage (2) |
|---|---|---|---|---|---|
| Alexandria, LA | 40 | 0.66 | 5.91 | $ 16.64 | $ 34,610 |
| Anchorage, AK | 110 | 0.66 | 5.90 | $ 24.04 | $ 50,000 |
| Prescott, AZ | 30 | 0.47 | 4.20 | $ 18.19 | $ 37,840 |
| Lake Charles, LA | 40 | 0.41 | 3.69 | $ 19.52 | $ 40,600 |
| North Port-Sarasota-Bradenton, FL | 110 | 0.33 | 2.99 | $ 22.85 | $ 47,520 |
| New Orleans-Metairie, LA | 170 | 0.32 | 2.90 | $ 18.27 | $ 38,000 |
| Kennewick-Richland, WA | 40 | 0.32 | 2.89 | $ 21.50 | $ 44,710 |
| Mobile, AL | 40 | 0.26 | 2.34 | $ 18.20 | $ 37,860 |
| Deltona-Daytona Beach-Ormond Beach, FL | 50 | 0.26 | 2.33 | $ 22.36 | $ 46,510 |
| Waco, TX | 30 | 0.26 | 2.32 | $ 17.24 | $ 35,860 |
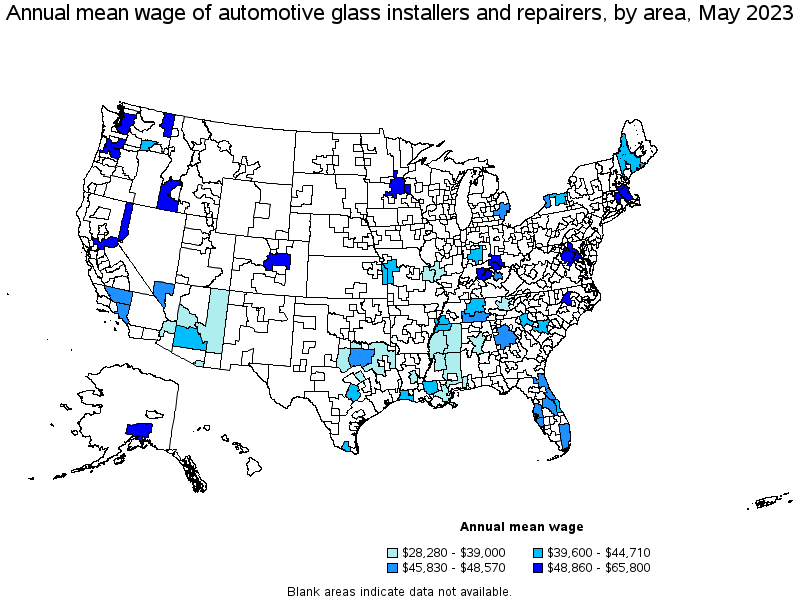
Top paying metropolitan areas for Automotive Glass Installers and Repairers:
| Metropolitan area | Employment (1) | Employment per thousand jobs | Location quotient (9) | Hourly mean wage | Annual mean wage (2) |
|---|---|---|---|---|---|
| Minneapolis-St. Paul-Bloomington, MN-WI | 190 | 0.10 | 0.90 | $ 31.63 | $ 65,800 |
| Seattle-Tacoma-Bellevue, WA | 230 | 0.11 | 1.01 | $ 28.28 | $ 58,820 |
| Spokane-Spokane Valley, WA | 50 | 0.18 | 1.65 | $ 26.67 | $ 55,470 |
| Washington-Arlington-Alexandria, DC-VA-MD-WV | 170 | 0.06 | 0.50 | $ 26.30 | $ 54,710 |
| Boston-Cambridge-Nashua, MA-NH | 200 | 0.07 | 0.65 | $ 25.63 | $ 53,300 |
| Worcester, MA-CT | 40 | 0.13 | 1.14 | $ 24.82 | $ 51,620 |
| Reno, NV | 30 | 0.13 | 1.17 | $ 24.45 | $ 50,850 |
| Boise City, ID | 90 | 0.24 | 2.15 | $ 24.33 | $ 50,600 |
| Denver-Aurora-Lakewood, CO | 210 | 0.13 | 1.16 | $ 24.20 | $ 50,340 |
| Raleigh, NC | 80 | 0.11 | 0.97 | $ 24.19 | $ 50,320 |
Nonmetropolitan areas with the highest employment in Automotive Glass Installers and Repairers:
| Nonmetropolitan area | Employment (1) | Employment per thousand jobs | Location quotient (9) | Hourly mean wage | Annual mean wage (2) |
|---|---|---|---|---|---|
| Southeast Mississippi nonmetropolitan area | 70 | 0.50 | 4.48 | $ 18.71 | $ 38,920 |
| Arizona nonmetropolitan area | 60 | 0.68 | 6.10 | $ 18.61 | $ 38,700 |
| North Texas Region of Texas nonmetropolitan area | 50 | 0.18 | 1.66 | $ 15.73 | $ 32,730 |
| Northeast Mississippi nonmetropolitan area | 50 | 0.21 | 1.90 | $ 15.87 | $ 33,000 |
| South Central Tennessee nonmetropolitan area | 40 | 0.38 | 3.38 | $ 22.73 | $ 47,280 |
Nonmetropolitan areas with the highest concentration of jobs and location quotients in Automotive Glass Installers and Repairers:
| Nonmetropolitan area | Employment (1) | Employment per thousand jobs | Location quotient (9) | Hourly mean wage | Annual mean wage (2) |
|---|---|---|---|---|---|
| Arizona nonmetropolitan area | 60 | 0.68 | 6.10 | $ 18.61 | $ 38,700 |
| Southeast Mississippi nonmetropolitan area | 70 | 0.50 | 4.48 | $ 18.71 | $ 38,920 |
| Northwest Mississippi nonmetropolitan area | 40 | 0.40 | 3.64 | $ 13.60 | $ 28,280 |
| South Central Tennessee nonmetropolitan area | 40 | 0.38 | 3.38 | $ 22.73 | $ 47,280 |
| Northeast Mississippi nonmetropolitan area | 50 | 0.21 | 1.90 | $ 15.87 | $ 33,000 |
Top paying nonmetropolitan areas for Automotive Glass Installers and Repairers:
| Nonmetropolitan area | Employment (1) | Employment per thousand jobs | Location quotient (9) | Hourly mean wage | Annual mean wage (2) |
|---|---|---|---|---|---|
| South Central Tennessee nonmetropolitan area | 40 | 0.38 | 3.38 | $ 22.73 | $ 47,280 |
| Southwest Maine nonmetropolitan area | 30 | 0.17 | 1.49 | $ 19.41 | $ 40,370 |
| Southeast Mississippi nonmetropolitan area | 70 | 0.50 | 4.48 | $ 18.71 | $ 38,920 |
| Arizona nonmetropolitan area | 60 | 0.68 | 6.10 | $ 18.61 | $ 38,700 |
| Northeast Mississippi nonmetropolitan area | 50 | 0.21 | 1.90 | $ 15.87 | $ 33,000 |
These estimates are calculated with data collected from employers in all industry sectors, all metropolitan and nonmetropolitan areas, and all states and the District of Columbia. The top employment and wage figures are provided above. The complete list is available in the downloadable XLS files.
The percentile wage estimate is the value of a wage below which a certain percent of workers fall. The median wage is the 50th percentile wage estimate—50 percent of workers earn less than the median and 50 percent of workers earn more than the median. More about percentile wages.
(1) Estimates for detailed occupations do not sum to the totals because the totals include occupations not shown separately. Estimates do not include self-employed workers.
(2) Annual wages have been calculated by multiplying the hourly mean wage by a "year-round, full-time" hours figure of 2,080 hours; for those occupations where there is not an hourly wage published, the annual wage has been directly calculated from the reported survey data.
(3) The relative standard error (RSE) is a measure of the reliability of a survey statistic. The smaller the relative standard error, the more precise the estimate.
(9) The location quotient is the ratio of the area concentration of occupational employment to the national average concentration. A location quotient greater than one indicates the occupation has a higher share of employment than average, and a location quotient less than one indicates the occupation is less prevalent in the area than average.
Other OEWS estimates and related information:
May 2023 National Occupational Employment and Wage Estimates
May 2023 State Occupational Employment and Wage Estimates
May 2023 Metropolitan and Nonmetropolitan Area Occupational Employment and Wage Estimates
May 2023 National Industry-Specific Occupational Employment and Wage Estimates
Last Modified Date: April 3, 2024