
An official website of the United States government
An official website of the United States government
The .gov means it's official.
Federal government websites often end in .gov or .mil. Before sharing sensitive information,
make sure you're on a federal government site.
The site is secure.
The
https:// ensures that you are connecting to the official website and that any
information you provide is encrypted and transmitted securely.
Laminate layers of fiberglass on molds to form boat decks and hulls, bodies for golf carts, automobiles, or other products.
Employment estimate and mean wage estimates for Fiberglass Laminators and Fabricators:
| Employment (1) | Employment RSE (3) |
Mean hourly wage |
Mean annual wage (2) |
Wage RSE (3) |
|---|---|---|---|---|
| 20,380 | 2.7 % | $ 21.12 | $ 43,920 | 0.7 % |
Percentile wage estimates for Fiberglass Laminators and Fabricators:
| Percentile | 10% | 25% | 50% (Median) |
75% | 90% |
|---|---|---|---|---|---|
| Hourly Wage | $ 15.10 | $ 17.65 | $ 19.33 | $ 23.28 | $ 27.95 |
| Annual Wage (2) | $ 31,400 | $ 36,720 | $ 40,200 | $ 48,430 | $ 58,140 |
Industries with the highest published employment and wages for Fiberglass Laminators and Fabricators are provided. For a list of all industries with employment in Fiberglass Laminators and Fabricators, see the Create Customized Tables function.
Industries with the highest levels of employment in Fiberglass Laminators and Fabricators:
| Industry | Employment (1) | Percent of industry employment | Hourly mean wage | Annual mean wage (2) |
|---|---|---|---|---|
| Ship and Boat Building | 9,770 | 6.39 | $ 20.43 | $ 42,500 |
| Plastics Product Manufacturing | 3,170 | 0.52 | $ 19.75 | $ 41,070 |
| Motor Vehicle Body and Trailer Manufacturing | 1,350 | 0.80 | $ 21.83 | $ 45,410 |
| Aerospace Product and Parts Manufacturing | 990 | 0.19 | $ 31.03 | $ 64,540 |
| Machinery Manufacturing (3331, 3332, 3334, and 3339 only) | 560 | 0.07 | $ 20.57 | $ 42,780 |
Industries with the highest concentration of employment in Fiberglass Laminators and Fabricators:
| Industry | Employment (1) | Percent of industry employment | Hourly mean wage | Annual mean wage (2) |
|---|---|---|---|---|
| Ship and Boat Building | 9,770 | 6.39 | $ 20.43 | $ 42,500 |
| Motor Vehicle Body and Trailer Manufacturing | 1,350 | 0.80 | $ 21.83 | $ 45,410 |
| Plastics Product Manufacturing | 3,170 | 0.52 | $ 19.75 | $ 41,070 |
| Personal and Household Goods Repair and Maintenance | 440 | 0.51 | $ 25.98 | $ 54,040 |
| Other Transportation Equipment Manufacturing | 120 | 0.30 | $ 19.36 | $ 40,260 |
Top paying industries for Fiberglass Laminators and Fabricators:
| Industry | Employment (1) | Percent of industry employment | Hourly mean wage | Annual mean wage (2) |
|---|---|---|---|---|
| Aerospace Product and Parts Manufacturing | 990 | 0.19 | $ 31.03 | $ 64,540 |
| Other Amusement and Recreation Industries | 90 | 0.01 | $ 26.47 | $ 55,060 |
| Personal and Household Goods Repair and Maintenance | 440 | 0.51 | $ 25.98 | $ 54,040 |
| Specialized Design Services | (8) | (8) | $ 24.90 | $ 51,790 |
| Fabricated Metal Product Manufacturing (3323 and 3324 only) | 520 | 0.10 | $ 24.11 | $ 50,150 |
States and areas with the highest published employment, location quotients, and wages for Fiberglass Laminators and Fabricators are provided. For a list of all areas with employment in Fiberglass Laminators and Fabricators, see the Create Customized Tables function.
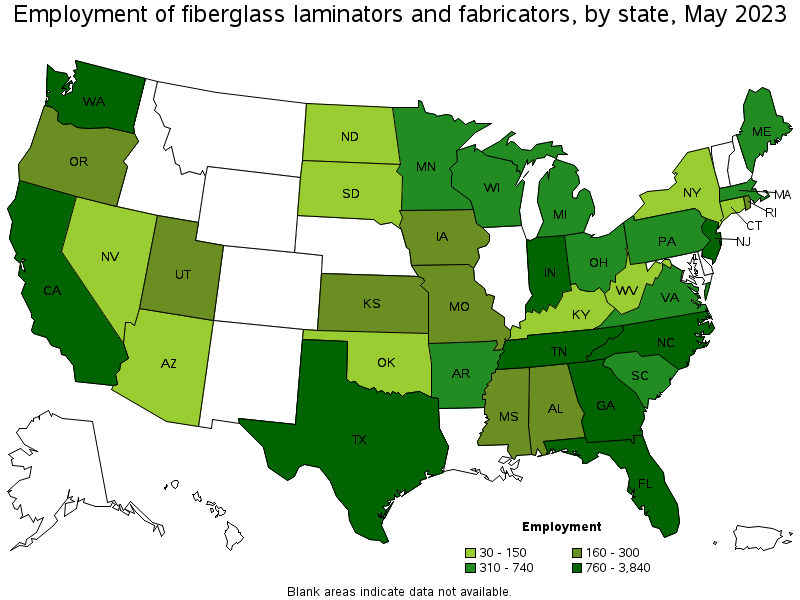
States with the highest employment level in Fiberglass Laminators and Fabricators:
| State | Employment (1) | Employment per thousand jobs | Location quotient (9) | Hourly mean wage | Annual mean wage (2) |
|---|---|---|---|---|---|
| Florida | 3,840 | 0.40 | 2.99 | $ 19.12 | $ 39,780 |
| Indiana | 1,920 | 0.61 | 4.53 | $ 22.04 | $ 45,830 |
| Texas | 1,330 | 0.10 | 0.73 | $ 19.25 | $ 40,030 |
| New Jersey | 970 | 0.23 | 1.72 | $ 23.90 | $ 49,710 |
| California | 850 | 0.05 | 0.35 | $ 24.67 | $ 51,310 |
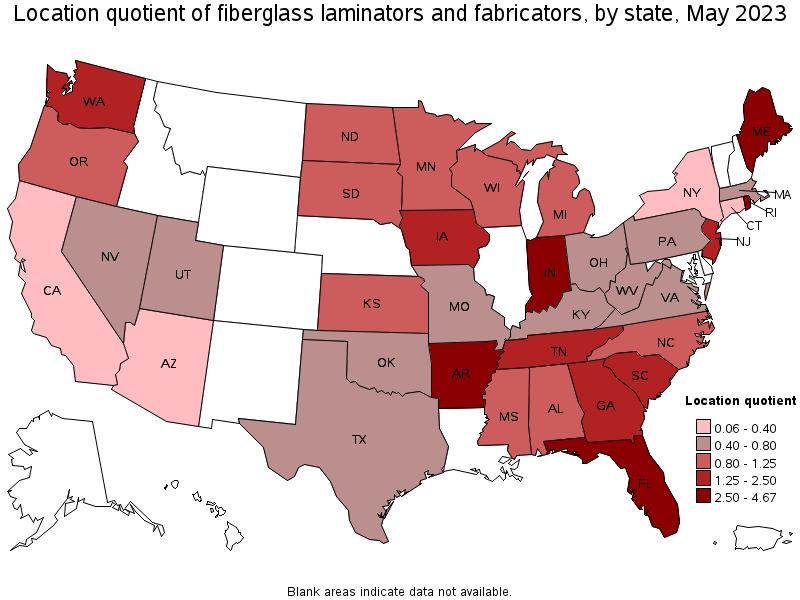
States with the highest concentration of jobs and location quotients in Fiberglass Laminators and Fabricators:
| State | Employment (1) | Employment per thousand jobs | Location quotient (9) | Hourly mean wage | Annual mean wage (2) |
|---|---|---|---|---|---|
| Maine | 390 | 0.63 | 4.67 | $ 22.15 | $ 46,070 |
| Indiana | 1,920 | 0.61 | 4.53 | $ 22.04 | $ 45,830 |
| Rhode Island | 210 | 0.42 | 3.13 | $ 22.19 | $ 46,160 |
| Florida | 3,840 | 0.40 | 2.99 | $ 19.12 | $ 39,780 |
| Arkansas | 500 | 0.39 | 2.92 | $ 19.27 | $ 40,090 |
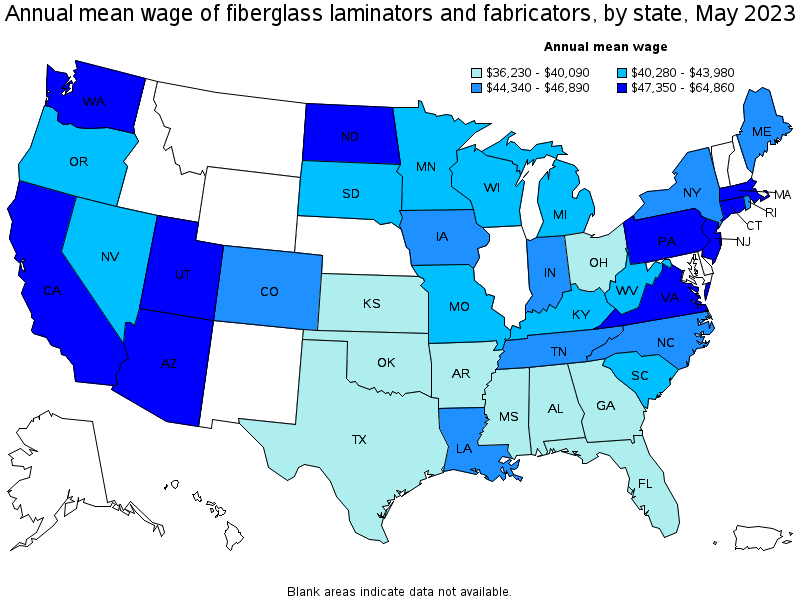
Top paying states for Fiberglass Laminators and Fabricators:
| State | Employment (1) | Employment per thousand jobs | Location quotient (9) | Hourly mean wage | Annual mean wage (2) |
|---|---|---|---|---|---|
| Arizona | 150 | 0.05 | 0.35 | $ 31.18 | $ 64,860 |
| Pennsylvania | 460 | 0.08 | 0.57 | $ 29.47 | $ 61,300 |
| Washington | 820 | 0.24 | 1.76 | $ 24.80 | $ 51,590 |
| California | 850 | 0.05 | 0.35 | $ 24.67 | $ 51,310 |
| New Jersey | 970 | 0.23 | 1.72 | $ 23.90 | $ 49,710 |
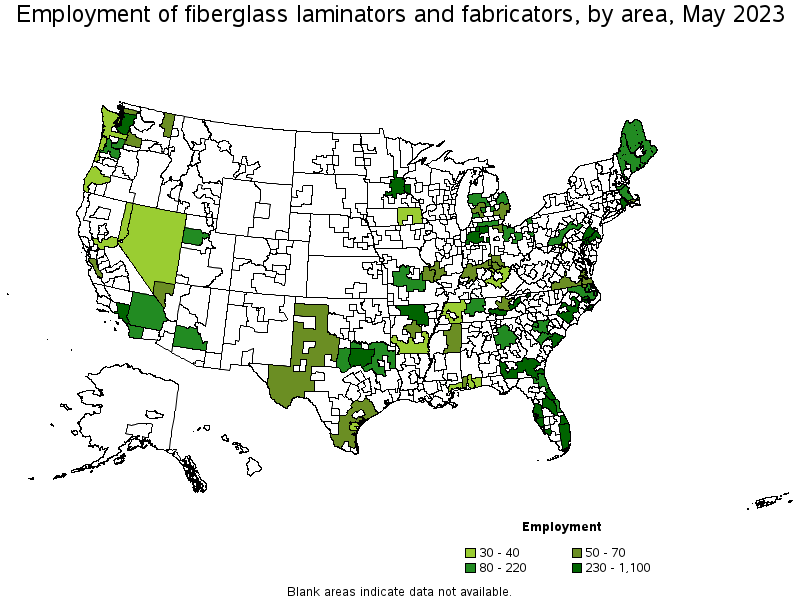
Metropolitan areas with the highest employment level in Fiberglass Laminators and Fabricators:
| Metropolitan area | Employment (1) | Employment per thousand jobs | Location quotient (9) | Hourly mean wage | Annual mean wage (2) |
|---|---|---|---|---|---|
| Elkhart-Goshen, IN | 1,100 | 8.03 | 59.82 | $ 23.51 | $ 48,900 |
| Philadelphia-Camden-Wilmington, PA-NJ-DE-MD | 720 | 0.25 | 1.90 | $ 28.08 | $ 58,410 |
| Miami-Fort Lauderdale-West Palm Beach, FL | 650 | 0.24 | 1.78 | $ 19.43 | $ 40,420 |
| Deltona-Daytona Beach-Ormond Beach, FL | 530 | 2.53 | 18.84 | $ 18.46 | $ 38,400 |
| Orlando-Kissimmee-Sanford, FL | 510 | 0.37 | 2.78 | $ 19.72 | $ 41,010 |
| Tampa-St. Petersburg-Clearwater, FL | 500 | 0.35 | 2.61 | $ 18.98 | $ 39,480 |
| Seattle-Tacoma-Bellevue, WA | 470 | 0.23 | 1.70 | $ 27.08 | $ 56,320 |
| Dallas-Fort Worth-Arlington, TX | 420 | 0.11 | 0.80 | $ 23.45 | $ 48,780 |
| Los Angeles-Long Beach-Anaheim, CA | 350 | 0.06 | 0.42 | $ 26.23 | $ 54,560 |
| Port St. Lucie, FL | 350 | 2.12 | 15.79 | $ 19.11 | $ 39,750 |
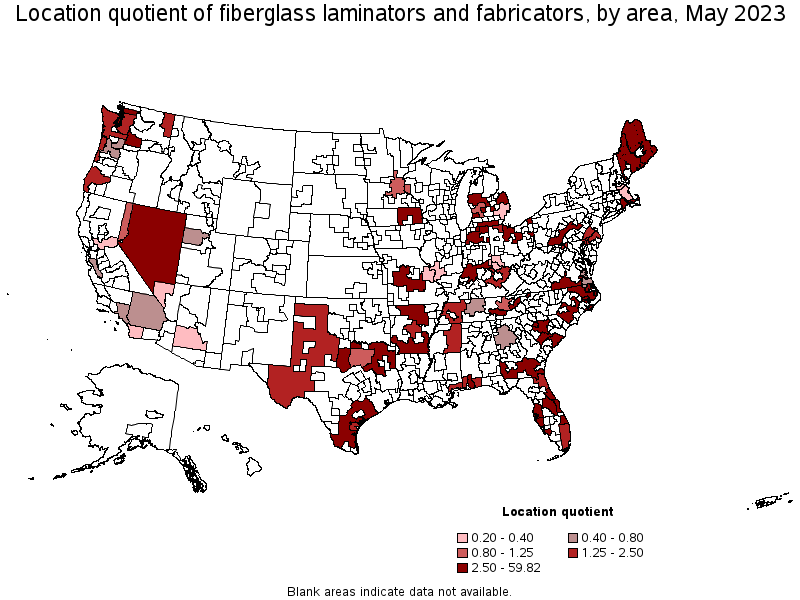
Metropolitan areas with the highest concentration of jobs and location quotients in Fiberglass Laminators and Fabricators:
| Metropolitan area | Employment (1) | Employment per thousand jobs | Location quotient (9) | Hourly mean wage | Annual mean wage (2) |
|---|---|---|---|---|---|
| Elkhart-Goshen, IN | 1,100 | 8.03 | 59.82 | $ 23.51 | $ 48,900 |
| Deltona-Daytona Beach-Ormond Beach, FL | 530 | 2.53 | 18.84 | $ 18.46 | $ 38,400 |
| Port St. Lucie, FL | 350 | 2.12 | 15.79 | $ 19.11 | $ 39,750 |
| Mount Vernon-Anacortes, WA | 70 | 1.43 | 10.63 | $ 24.27 | $ 50,480 |
| Cape Coral-Fort Myers, FL | 250 | 0.87 | 6.51 | $ 18.54 | $ 38,560 |
| North Port-Sarasota-Bradenton, FL | 250 | 0.79 | 5.87 | $ 20.28 | $ 42,180 |
| Charleston-North Charleston, SC | 270 | 0.71 | 5.31 | $ 21.89 | $ 45,520 |
| New Bedford, MA | 40 | 0.65 | 4.86 | $ 22.04 | $ 45,830 |
| Yakima, WA | 60 | 0.59 | 4.42 | $ 19.01 | $ 39,550 |
| Barnstable Town, MA | 50 | 0.53 | 3.94 | $ 23.78 | $ 49,450 |
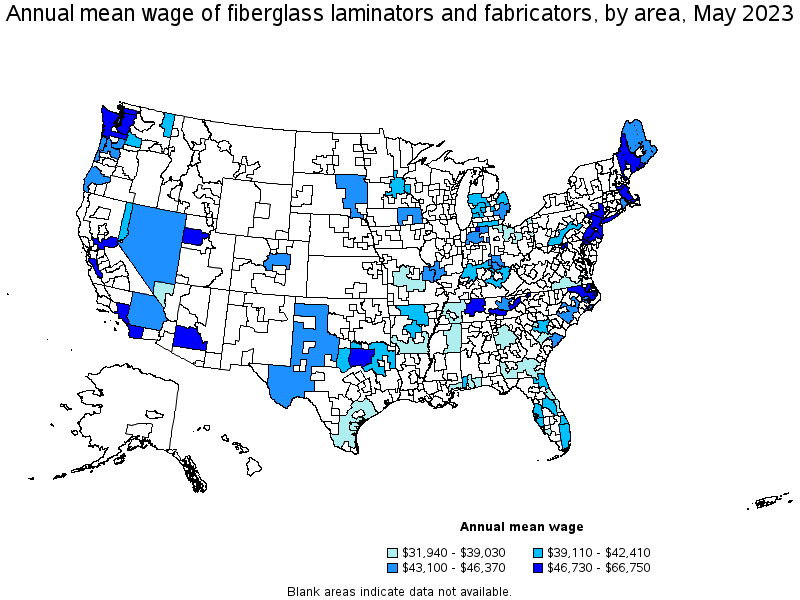
Top paying metropolitan areas for Fiberglass Laminators and Fabricators:
| Metropolitan area | Employment (1) | Employment per thousand jobs | Location quotient (9) | Hourly mean wage | Annual mean wage (2) |
|---|---|---|---|---|---|
| Phoenix-Mesa-Scottsdale, AZ | 110 | 0.05 | 0.35 | $ 32.09 | $ 66,750 |
| Philadelphia-Camden-Wilmington, PA-NJ-DE-MD | 720 | 0.25 | 1.90 | $ 28.08 | $ 58,410 |
| Seattle-Tacoma-Bellevue, WA | 470 | 0.23 | 1.70 | $ 27.08 | $ 56,320 |
| Los Angeles-Long Beach-Anaheim, CA | 350 | 0.06 | 0.42 | $ 26.23 | $ 54,560 |
| New York-Newark-Jersey City, NY-NJ-PA | (8) | (8) | (8) | $ 26.10 | $ 54,290 |
| Sacramento--Roseville--Arden-Arcade, CA | 40 | 0.04 | 0.32 | $ 25.32 | $ 52,670 |
| Boston-Cambridge-Nashua, MA-NH | 140 | 0.05 | 0.37 | $ 24.68 | $ 51,320 |
| Mount Vernon-Anacortes, WA | 70 | 1.43 | 10.63 | $ 24.27 | $ 50,480 |
| San Diego-Carlsbad, CA | 80 | 0.05 | 0.37 | $ 24.15 | $ 50,230 |
| Barnstable Town, MA | 50 | 0.53 | 3.94 | $ 23.78 | $ 49,450 |
Nonmetropolitan areas with the highest employment in Fiberglass Laminators and Fabricators:
| Nonmetropolitan area | Employment (1) | Employment per thousand jobs | Location quotient (9) | Hourly mean wage | Annual mean wage (2) |
|---|---|---|---|---|---|
| East Tennessee nonmetropolitan area | 470 | 3.35 | 24.98 | $ 22.65 | $ 47,110 |
| Northern Indiana nonmetropolitan area | 460 | 2.17 | 16.20 | $ 20.73 | $ 43,120 |
| South Georgia nonmetropolitan area | 410 | 2.15 | 16.01 | $ 18.58 | $ 38,650 |
| North Arkansas nonmetropolitan area | 300 | 2.50 | 18.67 | $ 19.47 | $ 40,490 |
| Southeast Coastal North Carolina nonmetropolitan area | 270 | 1.10 | 8.23 | $ 22.00 | $ 45,760 |
Nonmetropolitan areas with the highest concentration of jobs and location quotients in Fiberglass Laminators and Fabricators:
| Nonmetropolitan area | Employment (1) | Employment per thousand jobs | Location quotient (9) | Hourly mean wage | Annual mean wage (2) |
|---|---|---|---|---|---|
| East Tennessee nonmetropolitan area | 470 | 3.35 | 24.98 | $ 22.65 | $ 47,110 |
| North Arkansas nonmetropolitan area | 300 | 2.50 | 18.67 | $ 19.47 | $ 40,490 |
| Northern Indiana nonmetropolitan area | 460 | 2.17 | 16.20 | $ 20.73 | $ 43,120 |
| South Georgia nonmetropolitan area | 410 | 2.15 | 16.01 | $ 18.58 | $ 38,650 |
| Lower Savannah South Carolina nonmetropolitan area | 100 | 1.84 | 13.71 | $ 17.05 | $ 35,460 |
Top paying nonmetropolitan areas for Fiberglass Laminators and Fabricators:
| Nonmetropolitan area | Employment (1) | Employment per thousand jobs | Location quotient (9) | Hourly mean wage | Annual mean wage (2) |
|---|---|---|---|---|---|
| Western Washington nonmetropolitan area | 30 | 0.27 | 1.98 | $ 23.96 | $ 49,840 |
| Northeast Coastal North Carolina nonmetropolitan area | 160 | 1.68 | 12.55 | $ 23.32 | $ 48,510 |
| East Tennessee nonmetropolitan area | 470 | 3.35 | 24.98 | $ 22.65 | $ 47,110 |
| Southwest Maine nonmetropolitan area | 100 | 0.53 | 3.93 | $ 22.47 | $ 46,730 |
| Northeast Maine nonmetropolitan area | 120 | 1.69 | 12.56 | $ 22.21 | $ 46,200 |
These estimates are calculated with data collected from employers in all industry sectors, all metropolitan and nonmetropolitan areas, and all states and the District of Columbia. The top employment and wage figures are provided above. The complete list is available in the downloadable XLS files.
The percentile wage estimate is the value of a wage below which a certain percent of workers fall. The median wage is the 50th percentile wage estimate—50 percent of workers earn less than the median and 50 percent of workers earn more than the median. More about percentile wages.
(1) Estimates for detailed occupations do not sum to the totals because the totals include occupations not shown separately. Estimates do not include self-employed workers.
(2) Annual wages have been calculated by multiplying the hourly mean wage by a "year-round, full-time" hours figure of 2,080 hours; for those occupations where there is not an hourly wage published, the annual wage has been directly calculated from the reported survey data.
(3) The relative standard error (RSE) is a measure of the reliability of a survey statistic. The smaller the relative standard error, the more precise the estimate.
(8) Estimate not released.
(9) The location quotient is the ratio of the area concentration of occupational employment to the national average concentration. A location quotient greater than one indicates the occupation has a higher share of employment than average, and a location quotient less than one indicates the occupation is less prevalent in the area than average.
Other OEWS estimates and related information:
May 2023 National Occupational Employment and Wage Estimates
May 2023 State Occupational Employment and Wage Estimates
May 2023 Metropolitan and Nonmetropolitan Area Occupational Employment and Wage Estimates
May 2023 National Industry-Specific Occupational Employment and Wage Estimates
Last Modified Date: April 3, 2024