
An official website of the United States government
An official website of the United States government
The .gov means it's official.
Federal government websites often end in .gov or .mil. Before sharing sensitive information,
make sure you're on a federal government site.
The site is secure.
The
https:// ensures that you are connecting to the official website and that any
information you provide is encrypted and transmitted securely.
Operate small motor-driven boats. May assist in navigational activities.
Employment estimate and mean wage estimates for Motorboat Operators:
| Employment (1) | Employment RSE (3) |
Mean hourly wage |
Mean annual wage (2) |
Wage RSE (3) |
|---|---|---|---|---|
| 2,710 | 8.2 % | $ 24.91 | $ 51,810 | 2.4 % |
Percentile wage estimates for Motorboat Operators:
| Percentile | 10% | 25% | 50% (Median) |
75% | 90% |
|---|---|---|---|---|---|
| Hourly Wage | $ 13.89 | $ 17.24 | $ 22.32 | $ 31.01 | $ 38.92 |
| Annual Wage (2) | $ 28,890 | $ 35,860 | $ 46,420 | $ 64,490 | $ 80,960 |
Industries with the highest published employment and wages for Motorboat Operators are provided. For a list of all industries with employment in Motorboat Operators, see the Create Customized Tables function.
Industries with the highest levels of employment in Motorboat Operators:
| Industry | Employment (1) | Percent of industry employment | Hourly mean wage | Annual mean wage (2) |
|---|---|---|---|---|
| Scenic and Sightseeing Transportation, Water | 440 | 2.61 | $ 27.87 | $ 57,970 |
| Other Amusement and Recreation Industries | 340 | 0.02 | $ 17.09 | $ 35,540 |
| Support Activities for Water Transportation | 260 | 0.27 | $ 27.44 | $ 57,080 |
| Federal, State, and Local Government, excluding State and Local Government Schools and Hospitals and the U.S. Postal Service (OEWS Designation) | 230 | 0.01 | $ 34.93 | $ 72,640 |
| Inland Water Transportation | 120 | 0.46 | $ 27.34 | $ 56,880 |
Industries with the highest concentration of employment in Motorboat Operators:
| Industry | Employment (1) | Percent of industry employment | Hourly mean wage | Annual mean wage (2) |
|---|---|---|---|---|
| Scenic and Sightseeing Transportation, Water | 440 | 2.61 | $ 27.87 | $ 57,970 |
| Inland Water Transportation | 120 | 0.46 | $ 27.34 | $ 56,880 |
| Support Activities for Water Transportation | 260 | 0.27 | $ 27.44 | $ 57,080 |
| Other Heavy and Civil Engineering Construction | 110 | 0.09 | $ 21.03 | $ 43,740 |
| Water, Sewage and Other Systems | 30 | 0.06 | (8) | (8) |
Top paying industries for Motorboat Operators:
| Industry | Employment (1) | Percent of industry employment | Hourly mean wage | Annual mean wage (2) |
|---|---|---|---|---|
| Federal, State, and Local Government, excluding State and Local Government Schools and Hospitals and the U.S. Postal Service (OEWS Designation) | 230 | 0.01 | $ 34.93 | $ 72,640 |
| Other Schools and Instruction | 50 | 0.01 | $ 28.85 | $ 60,010 |
| Scenic and Sightseeing Transportation, Water | 440 | 2.61 | $ 27.87 | $ 57,970 |
| Support Activities for Water Transportation | 260 | 0.27 | $ 27.44 | $ 57,080 |
| Inland Water Transportation | 120 | 0.46 | $ 27.34 | $ 56,880 |
States and areas with the highest published employment, location quotients, and wages for Motorboat Operators are provided. For a list of all areas with employment in Motorboat Operators, see the Create Customized Tables function.
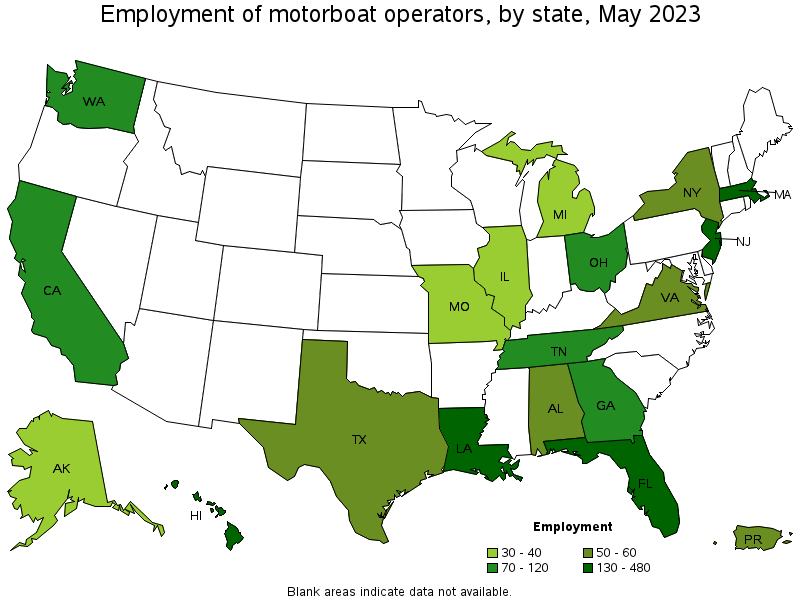
States with the highest employment level in Motorboat Operators:
| State | Employment (1) | Employment per thousand jobs | Location quotient (9) | Hourly mean wage | Annual mean wage (2) |
|---|---|---|---|---|---|
| Florida | 480 | 0.05 | 2.79 | $ 19.87 | $ 41,320 |
| Hawaii | 380 | 0.61 | 34.34 | $ 31.23 | $ 64,960 |
| Louisiana | 210 | 0.11 | 6.33 | $ 20.56 | $ 42,760 |
| Massachusetts | 130 | 0.04 | 2.07 | $ 21.99 | $ 45,730 |
| New Jersey | 130 | 0.03 | 1.79 | $ 27.25 | $ 56,680 |
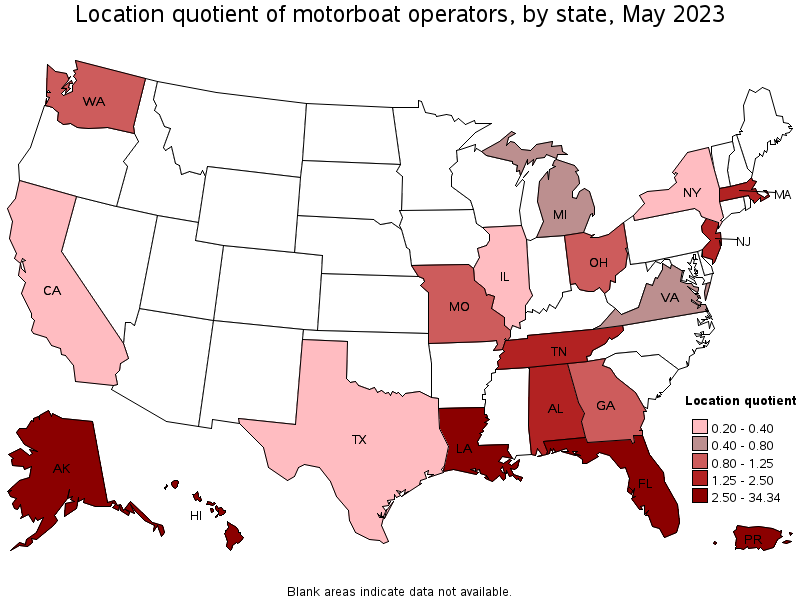
States with the highest concentration of jobs and location quotients in Motorboat Operators:
| State | Employment (1) | Employment per thousand jobs | Location quotient (9) | Hourly mean wage | Annual mean wage (2) |
|---|---|---|---|---|---|
| Hawaii | 380 | 0.61 | 34.34 | $ 31.23 | $ 64,960 |
| Louisiana | 210 | 0.11 | 6.33 | $ 20.56 | $ 42,760 |
| Alaska | 30 | 0.11 | 6.02 | $ 21.96 | $ 45,680 |
| Florida | 480 | 0.05 | 2.79 | $ 19.87 | $ 41,320 |
| Massachusetts | 130 | 0.04 | 2.07 | $ 21.99 | $ 45,730 |
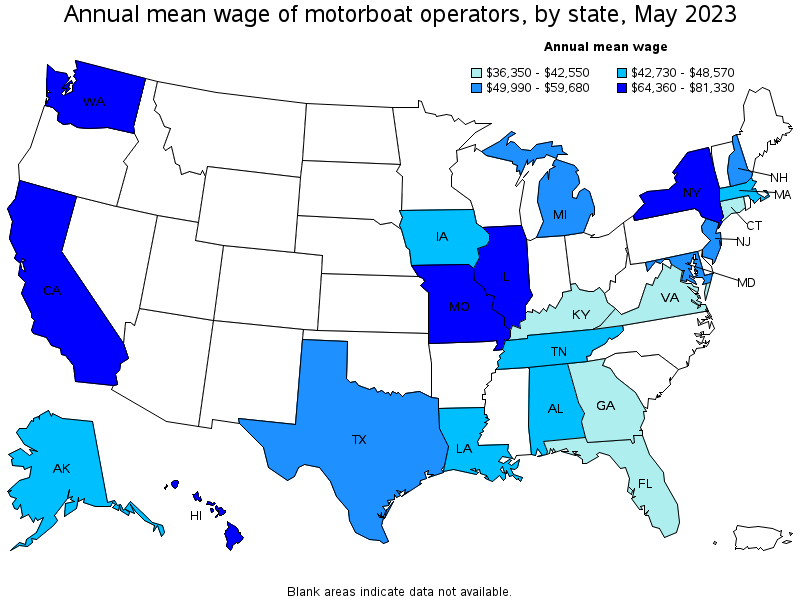
Top paying states for Motorboat Operators:
| State | Employment (1) | Employment per thousand jobs | Location quotient (9) | Hourly mean wage | Annual mean wage (2) |
|---|---|---|---|---|---|
| California | 120 | 0.01 | 0.38 | $ 39.10 | $ 81,330 |
| New York | 60 | 0.01 | 0.36 | $ 32.90 | $ 68,430 |
| Washington | 80 | 0.02 | 1.24 | $ 32.73 | $ 68,070 |
| Hawaii | 380 | 0.61 | 34.34 | $ 31.23 | $ 64,960 |
| Illinois | 30 | 0.01 | 0.32 | $ 31.02 | $ 64,520 |
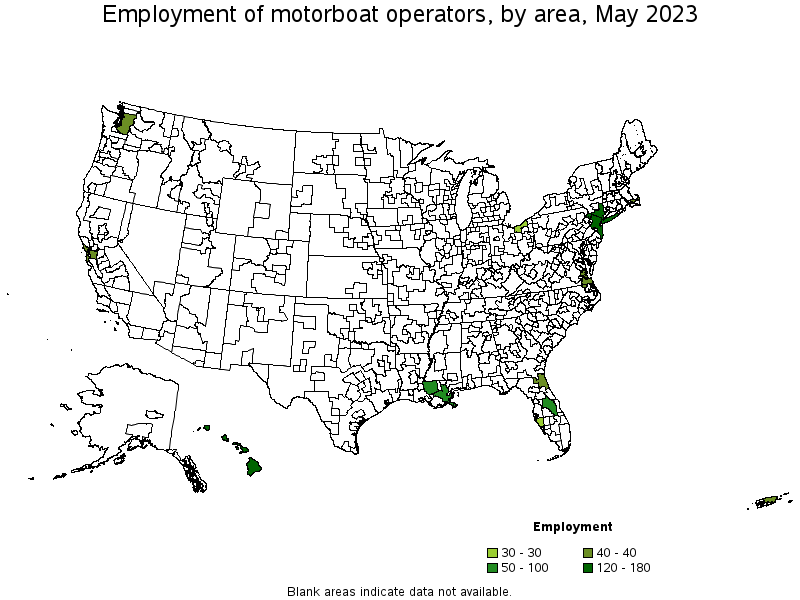
Metropolitan areas with the highest employment level in Motorboat Operators:
| Metropolitan area | Employment (1) | Employment per thousand jobs | Location quotient (9) | Hourly mean wage | Annual mean wage (2) |
|---|---|---|---|---|---|
| New York-Newark-Jersey City, NY-NJ-PA | 180 | 0.02 | 1.04 | $ 29.04 | $ 60,410 |
| Urban Honolulu, HI | 140 | 0.31 | 17.41 | $ 30.11 | $ 62,630 |
| Kahului-Wailuku-Lahaina, HI | 120 | 1.58 | 88.84 | $ 34.91 | $ 72,610 |
| New Orleans-Metairie, LA | 100 | 0.19 | 10.52 | $ 18.78 | $ 39,060 |
| Orlando-Kissimmee-Sanford, FL | 60 | 0.05 | 2.62 | $ 19.05 | $ 39,630 |
| Baton Rouge, LA | 50 | 0.12 | 6.80 | $ 22.87 | $ 47,570 |
| Virginia Beach-Norfolk-Newport News, VA-NC | 40 | 0.06 | 3.24 | $ 20.54 | $ 42,730 |
| San Francisco-Oakland-Hayward, CA | 40 | 0.02 | 0.98 | $ 44.57 | $ 92,710 |
| Jacksonville, FL | 40 | 0.05 | 2.94 | $ 22.00 | $ 45,750 |
| Barnstable Town, MA | 40 | 0.38 | 21.17 | $ 25.36 | $ 52,740 |
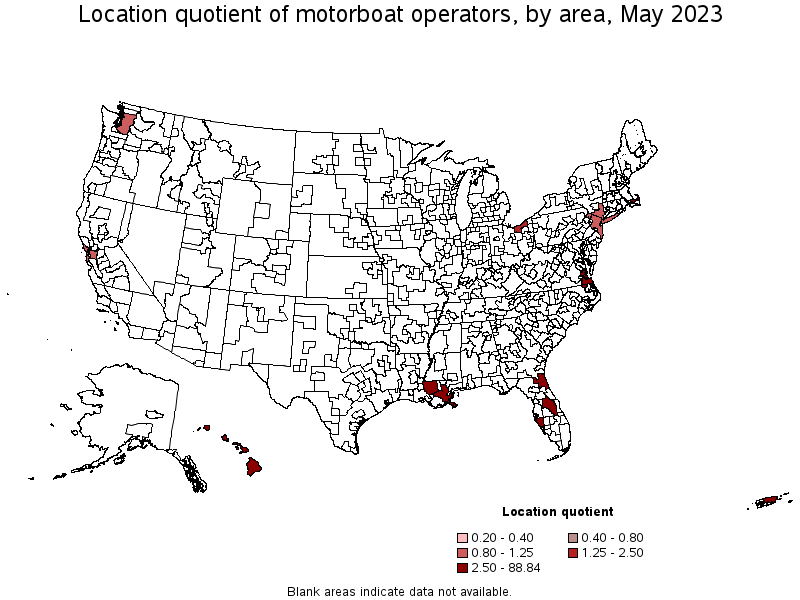
Metropolitan areas with the highest concentration of jobs and location quotients in Motorboat Operators:
| Metropolitan area | Employment (1) | Employment per thousand jobs | Location quotient (9) | Hourly mean wage | Annual mean wage (2) |
|---|---|---|---|---|---|
| Kahului-Wailuku-Lahaina, HI | 120 | 1.58 | 88.84 | $ 34.91 | $ 72,610 |
| Barnstable Town, MA | 40 | 0.38 | 21.17 | $ 25.36 | $ 52,740 |
| Urban Honolulu, HI | 140 | 0.31 | 17.41 | $ 30.11 | $ 62,630 |
| New Orleans-Metairie, LA | 100 | 0.19 | 10.52 | $ 18.78 | $ 39,060 |
| Baton Rouge, LA | 50 | 0.12 | 6.80 | $ 22.87 | $ 47,570 |
| North Port-Sarasota-Bradenton, FL | 30 | 0.09 | 5.33 | $ 17.70 | $ 36,820 |
| Virginia Beach-Norfolk-Newport News, VA-NC | 40 | 0.06 | 3.24 | $ 20.54 | $ 42,730 |
| Jacksonville, FL | 40 | 0.05 | 2.94 | $ 22.00 | $ 45,750 |
| Orlando-Kissimmee-Sanford, FL | 60 | 0.05 | 2.62 | $ 19.05 | $ 39,630 |
| Cleveland-Elyria, OH | 30 | 0.03 | 1.82 | $ 21.66 | $ 45,060 |
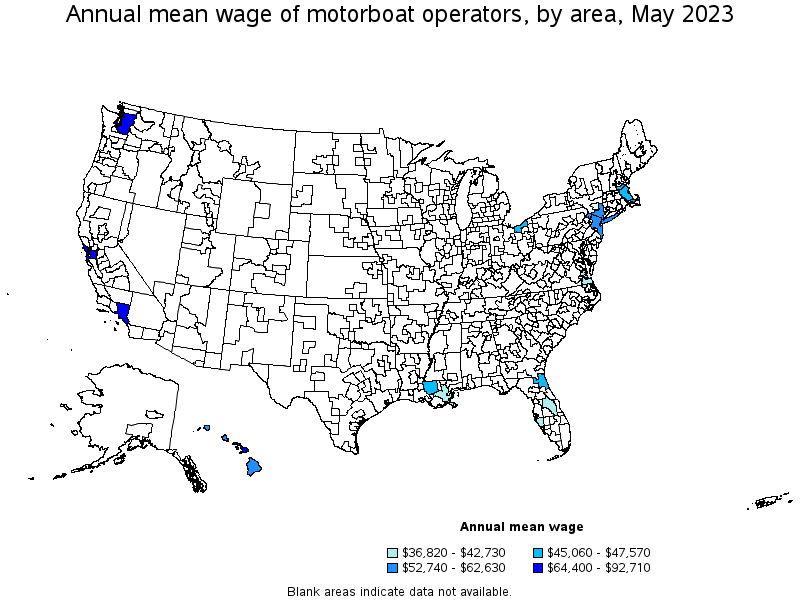
Top paying metropolitan areas for Motorboat Operators:
| Metropolitan area | Employment (1) | Employment per thousand jobs | Location quotient (9) | Hourly mean wage | Annual mean wage (2) |
|---|---|---|---|---|---|
| San Francisco-Oakland-Hayward, CA | 40 | 0.02 | 0.98 | $ 44.57 | $ 92,710 |
| Los Angeles-Long Beach-Anaheim, CA | (8) | (8) | (8) | $ 39.24 | $ 81,620 |
| Kahului-Wailuku-Lahaina, HI | 120 | 1.58 | 88.84 | $ 34.91 | $ 72,610 |
| Seattle-Tacoma-Bellevue, WA | 40 | 0.02 | 1.01 | $ 30.96 | $ 64,400 |
| Urban Honolulu, HI | 140 | 0.31 | 17.41 | $ 30.11 | $ 62,630 |
| New York-Newark-Jersey City, NY-NJ-PA | 180 | 0.02 | 1.04 | $ 29.04 | $ 60,410 |
| Barnstable Town, MA | 40 | 0.38 | 21.17 | $ 25.36 | $ 52,740 |
| Baton Rouge, LA | 50 | 0.12 | 6.80 | $ 22.87 | $ 47,570 |
| Boston-Cambridge-Nashua, MA-NH | (8) | (8) | (8) | $ 22.23 | $ 46,230 |
| Jacksonville, FL | 40 | 0.05 | 2.94 | $ 22.00 | $ 45,750 |
Nonmetropolitan areas with the highest employment in Motorboat Operators:
| Nonmetropolitan area | Employment (1) | Employment per thousand jobs | Location quotient (9) | Hourly mean wage | Annual mean wage (2) |
|---|---|---|---|---|---|
| Hawaii / Kauai nonmetropolitan area | 120 | 1.20 | 67.20 | $ 28.86 | $ 60,020 |
Nonmetropolitan areas with the highest concentration of jobs and location quotients in Motorboat Operators:
| Nonmetropolitan area | Employment (1) | Employment per thousand jobs | Location quotient (9) | Hourly mean wage | Annual mean wage (2) |
|---|---|---|---|---|---|
| Hawaii / Kauai nonmetropolitan area | 120 | 1.20 | 67.20 | $ 28.86 | $ 60,020 |
Top paying nonmetropolitan areas for Motorboat Operators:
| Nonmetropolitan area | Employment (1) | Employment per thousand jobs | Location quotient (9) | Hourly mean wage | Annual mean wage (2) |
|---|---|---|---|---|---|
| Hawaii / Kauai nonmetropolitan area | 120 | 1.20 | 67.20 | $ 28.86 | $ 60,020 |
These estimates are calculated with data collected from employers in all industry sectors, all metropolitan and nonmetropolitan areas, and all states and the District of Columbia. The top employment and wage figures are provided above. The complete list is available in the downloadable XLS files.
The percentile wage estimate is the value of a wage below which a certain percent of workers fall. The median wage is the 50th percentile wage estimate—50 percent of workers earn less than the median and 50 percent of workers earn more than the median. More about percentile wages.
(1) Estimates for detailed occupations do not sum to the totals because the totals include occupations not shown separately. Estimates do not include self-employed workers.
(2) Annual wages have been calculated by multiplying the hourly mean wage by a "year-round, full-time" hours figure of 2,080 hours; for those occupations where there is not an hourly wage published, the annual wage has been directly calculated from the reported survey data.
(3) The relative standard error (RSE) is a measure of the reliability of a survey statistic. The smaller the relative standard error, the more precise the estimate.
(8) Estimate not released.
(9) The location quotient is the ratio of the area concentration of occupational employment to the national average concentration. A location quotient greater than one indicates the occupation has a higher share of employment than average, and a location quotient less than one indicates the occupation is less prevalent in the area than average.
Other OEWS estimates and related information:
May 2023 National Occupational Employment and Wage Estimates
May 2023 State Occupational Employment and Wage Estimates
May 2023 Metropolitan and Nonmetropolitan Area Occupational Employment and Wage Estimates
May 2023 National Industry-Specific Occupational Employment and Wage Estimates
Last Modified Date: April 3, 2024