
An official website of the United States government
An official website of the United States government
The .gov means it's official.
Federal government websites often end in .gov or .mil. Before sharing sensitive information,
make sure you're on a federal government site.
The site is secure.
The
https:// ensures that you are connecting to the official website and that any
information you provide is encrypted and transmitted securely.
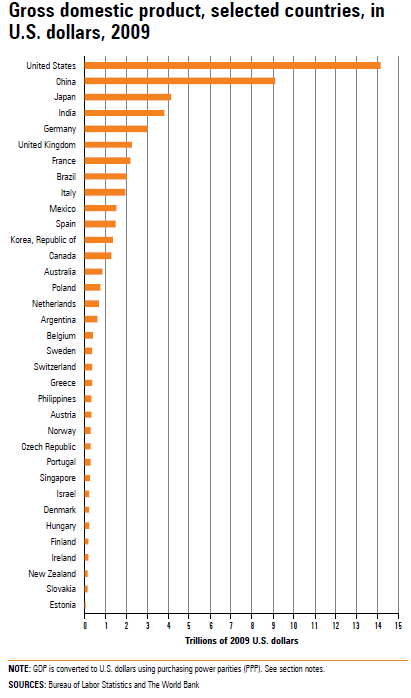
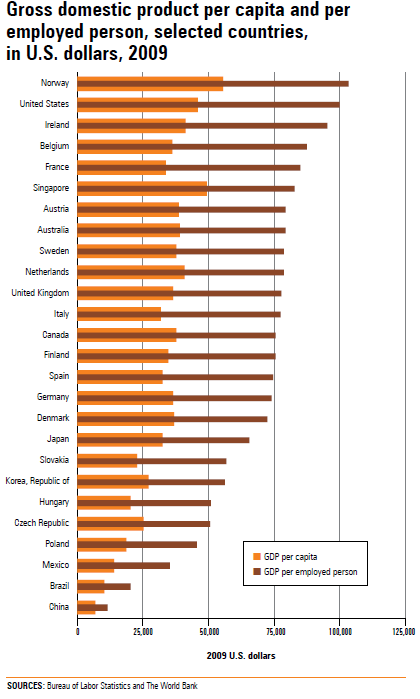
Gross domestic product (GDP) is a measure of a country’s economic output. GDP per capita and GDP per employed person are related indicators that provide a general picture of a country’s well being. GDP per capita is an indicator of overall wealth in a country, and GDP per employed person is a general indicator of productivity.
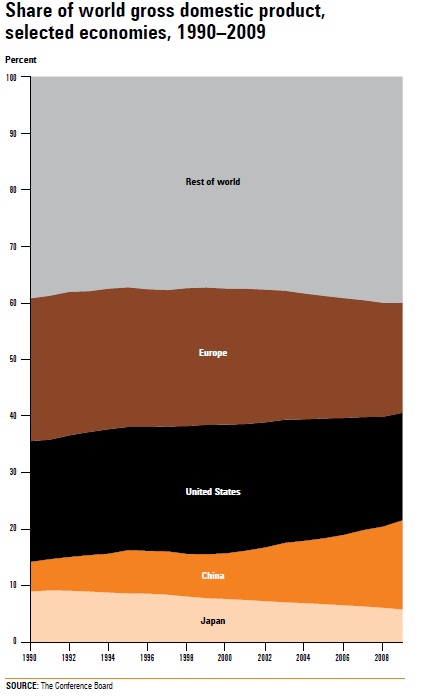
Data for most countries are based on the BLS report International Comparisons of GDP per Capita and per Hour, 1960–2009. Data for the remaining countries and all purchasing power parities (PPP) are based on data in the World Bank database World Development Indicators. A country or region’s share of world gross domestic product (GDP) is based on data in The Conference Board Total Economy Database.
Each country prepares GDP measures in accordance with national accounts principles. To make international comparisons of levels of GDP, GDP per capita, and GDP per employed person, it is necessary to express GDP in a common currency unit. BLS converts GDP from national currency units to U.S. dollars through the use of PPP.
In this section, Europe includes 20 countries: Austria, Belgium, Cyprus, Denmark, Finland, France, Germany, Greece, Iceland, Ireland, Italy, Luxembourg, Malta, Netherlands, Norway, Portugal, Spain, Sweden, Switzerland, and the United Kingdom.
Gross domestic product (GDP) is the market value of all goods and services produced in a country. GDP per capita is GDP divided by population and is a rough measure of a country’s overall wealth. GDP per employed person is GDP divided by the number of employed persons and is a rough measure of a country’s productivity. Purchasing power parities (PPP) are currency conversion rates that allow output in different currency units to be expressed in a common unit of value. A PPP is the ratio between the number of units of a country’s currency and the number of U.S. dollars required to purchase an equivalent basket of goods and services within each respective country.
Go to:
Last Modified Date: August 2, 2011