Department of Labor Logo United States Department of Labor
Dot gov

The .gov means it's official.
Federal government websites often end in .gov or .mil. Before sharing sensitive information, make sure you're on a federal government site.

Https

The site is secure.
The https:// ensures that you are connecting to the official website and that any information you provide is encrypted and transmitted securely.

International Labor Comparisons

Charting International Labor Comparisons (2011 Edition)


Section 2: Labor market

Labor force statistics, such as employment and unemployment, are key indicators of the functioning of labor markets both within and across countries. Labor force levels and participation rates provide information on the supply of labor in an economy. Employment focuses on the extent to which people are engaged in productive labor market activities, while measures of labor underutilization, including unemployment, provide information on an economy’s unused or underused labor supply.


Chart 2.1

Chart 2.1 Labor force size, gender composition, and participation rates, selected countries, 2009

  • China and India had the largest workforces, although China had the highest labor force participation rate, while India had the lowest.
  • Women made up less than half of the labor force in all countries and Europe, with India having, by far, the lowest proportion of women in the labor market.

Back to Top Back to Top


Chart 2.2

Chart 2.2 Labor force participation rates by sex, selected countries, 2009

  • Women’s participation rates in India and Mexico were among the lowest; these countries had the largest gender gaps.
  • Labor force participation rates were higher for men than women in all countries, although the size of the gender gap varied considerably. The largest gaps were in Asian and Latin American countries.
  • The highest participation rates for men were in large emerging economies: Brazil, India, Mexico and China. China also had the highest participation rate for women and, thus, a relatively low gender gap.

Back to Top Back to Top


Chart 2.3

Chart 2.3 Labor force participation rates by age, selected countries, 2009

  • Participation rates were highest for persons ages 25 to 54 in all countries and lowest for those ages 65 and older in all countries except the Republic of Korea.
  • In Argentina and the Philippines, more than one-third of persons ages 65 and older were still in the labor force. In contrast, many European countries had rates below 5 percent for this age group.
  • Participation rates among youth varied most across countries. The Netherlands and Australia had the highest participation rates (above 70 percent) while Hungary, the Republic of Korea, and Greece had the lowest rates (under 30 percent).

Back to Top Back to Top


Chart 2.4

Chart 2.4 Working-age population by labor force status, selected countries, in percent, 2009

  • The working-age population is composed of those in the labor force — the employed and the unemployed — and those not in the labor force.
  • Italy was the only country with less than half of its working-age population engaged in the labor force.
  • Although Spain had average labor force participation, this masks its relatively low employment rate and high unemployment. Estonia, Ireland, and Slovakia also had relatively low employment but high unemployment.

Back to Top Back to Top


Chart 2.5

Chart 2.5 Employment-population ratios, selected countries, 2007 and 2009

  • Employment-population ratios decreased between 2007 and 2009 in 31 of the 36 countries, with the steepest declines in Estonia, Spain, Ireland, and the United States.
  • In 2009, China and Brazil had the highest proportions of employed persons, while Hungary and Italy had the lowest.

Back to Top Back to Top


Chart 2.6

Chart 2.6 Employment growth, selected countries, average annual rates, 2000–2007 and 2007–2009

  • Employment grew from 2000 to 2007 in all countries except for Japan but decreased in almost half of the countries from 2007 to 2009.
  • Between 2007 and 2009, the sharpest declines in employment were in Estonia and Spain, followed by Ireland and the United States.
  • The largest gains in employment between 2007 and 2009 were in three Asian countries: Singapore, the Philippines, and India. Singapore and India were 2 of 3 countries (Germany was the third) that had more employment growth during 2007–2009 than during 2000–2007.

Back to Top Back to Top


Chart 2.7

Chart 2.7 Part-time employment rates by sex, selected countries, 2009

  • The part-time employment rate for women was roughly 2 to 5 times higher than the men’s rate in most countries.
  • The largest difference between men and women’s part-time employment rates was in the Netherlands, although it had the highest rate for both men (17.0 percent) and women (59.9 percent).
  • Part-time employment was least common for both men and women in three Eastern European countries: Slovakia, Hungary, and the Czech Republic.

Back to Top Back to Top


Chart 2.8

Chart 2.8 Share of employment by sector, selected countries, 2009

  • More than half of employment was in the service sector in all countries.
  • The Netherlands, the United States, and the United Kingdom had the largest shares of service employment (above 80 percent).
  • The largest shares of industry employment (above 30 percent) were in five Eastern European countries.
  • Poland, Mexico, Greece, and Portugal had the largest agricultural sectors.

Back to Top Back to Top


Chart 2.9

Chart 2.9 Unemployment rates, selected countries, 2000–2009

  • In 2009, Spain had, by far, the highest unemployment rate, and Norway had the lowest.
  • Unemployment rates were higher in 2009 than 2000 in a majority of countries, due in part to the effects of the global recession at the end of the decade. Unemployment rates increased in 11 countries between 2007 and 2008, and in all countries between 2008 and 2009.
  • Poland recorded the highest unemployment rate of the period (20.0 percent in 2002), and Switzerland had the lowest (2.2 percent in 2001).

Back to Top Back to Top


Chart 2.10

Chart 2.10 Unemployment rates by age, selected countries, 2009

  • Unemployment rates for teenagers and young adults are generally higher than those for adults, partly due to young people’s greater vulnerability to economic downturns and lack of experience.
  • Slovakia had the largest difference between rates for teenagers and adults, and Germany had the smallest.
  • Only Switzerland had a higher unemployment rate for young adults than for teenagers.

Back to Top Back to Top


Chart 2.11

Chart 2.11 Unemployment rates by education, selected countries, 2008

  • In 23 out of 30 countries, college graduates had the lowest unemployment rates, followed by high school graduates; high school dropouts had the highest rates.
  • College graduates had the highest unemployment rate only in Mexico.
  • The unemployment rate gap between high school dropouts and high school graduates was generally larger than the gap between college graduates and high school graduates, reflecting the value of a high school education in seeking employment.

Back to Top Back to Top


Chart 2.12

Chart 2.12 Various measures of labor underutilization, selected countries, 2009

  • Long-term unemployment (UR1) was most prevalent in Slovakia and Spain.
  • UR1 is the most restrictive rate of labor underutilization and consists only of the subset of the unemployed who were unemployed for at least 1 year. UR3 is the official unemployment rate and the most widely recognized. The broadest rate, UR6, includes the unemployed, the marginally attached, and persons who are employed but who worked fewer hours than they would like (i.e., the time-related underemployed).
  • Spain had the highest UR3 and UR6. Although Australia had the second highest UR6, its UR3 was relatively low.

Back to Top Back to Top


Chart 2.13

Chart 2.13 UR6: A broad rate of labor underutilization, selected countries, 2007 and 2009

  • During the global recession, UR6 increased between 2007 and 2009 in all countries, except for Poland. The largest increases were in Spain, the United States, and Ireland.
  • UR6 is a broader measure of labor underutilization than the unemployment rate because it includes the marginally attached and those who are employed but who worked fewer hours than they would like (i.e., time-related underemployed). This broader measure is popular during times of recession, when unemployment and other types of labor market difficulty are on the rise.

Back to Top Back to Top


Notes


Sources

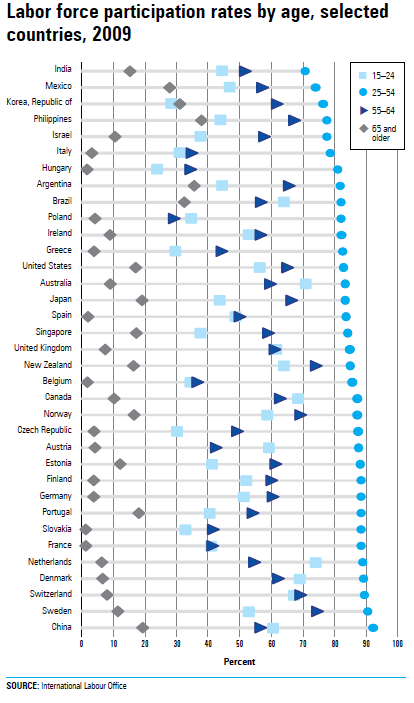
Data for 10 countries for most indicators are based on the BLS report International Comparisons of Annual Labor Force Statistics, Adjusted to U.S. Concepts, 10 Countries, 1970-2010. To facilitate international comparisons, foreign-country data are adjusted to U.S. concepts. Data for the remaining countries and some indicators in their entirety— labor force participation rates by age, part-time employment rates, unemployment rates by education and measures of underutilization—are based on data from the International Labour Office (ILO) or the Organisation for Economic Co-operation and Development (OECD).

Labor force participation rates, employment-population ratios, and employment growth are supplemented with data from the ILO database Key Indicators of the Labour Market (KILM). The KILM harmonizes data using econometric models to account for differences in national data and scope of coverage, collection and tabulation methodologies, and other country-specific factors, such as military service requirements. Although some differences remain between the KILM and ILC series, they do not materially affect comparisons across countries.

Part-time employment rates, employment by sector, unemployment rates, and measures of underutilization are supplemented with data from the OECD database OECD.Stat. The OECD generally uses labor force surveys and captures labor force statistics according to ILO guidelines, which facilitate cross-country comparisons, because these guidelines create a common conceptual framework for countries. However, except for total unemployment rates, the OECD does not adjust data for differences that remain across countries in coverage and definitions that can affect international comparisons. See Labor Force Statistics in OECD Countries: Sources, Coverage and Definitions. For total unemployment rates, the OECD series used is the “harmonized unemployment rates” (HURs), which are adjusted to conform to the ILO guidelines in countries where deviations occur. For a full discussion of comparability issues, see the BLS article, "International Unemployment Rates: How Comparable are they?"

Using multiple sources for an indicator to extend country coverage can introduce additional comparability issues, since each organization employs different methods for harmonizing data, if adjustments are made at all. Users should use caution when making international comparisons using the actual values underlying these charts and are encouraged to review the methodological documents associated with each source.

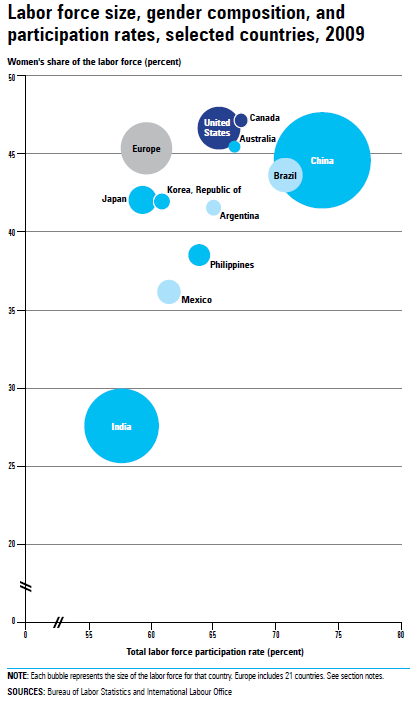
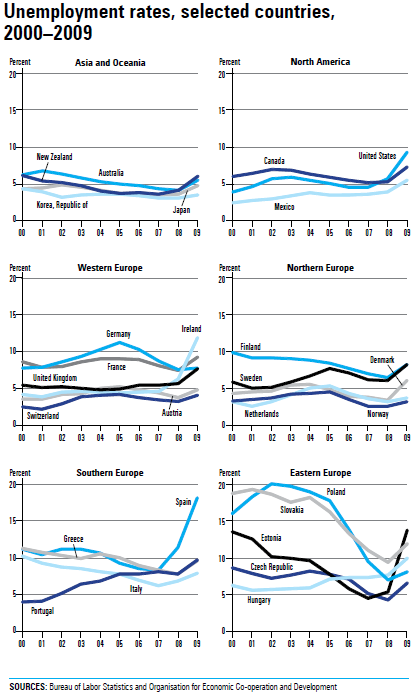
In this section, Europe includes 21 countries: Austria, Belgium, Czech Republic, Denmark, Estonia, Finland, France, Germany, Greece, Hungary, Ireland, Italy, the Netherlands, Norway, Poland, Portugal, Slovakia, Spain, Sweden, Switzerland, and the United Kingdom.

Definitions

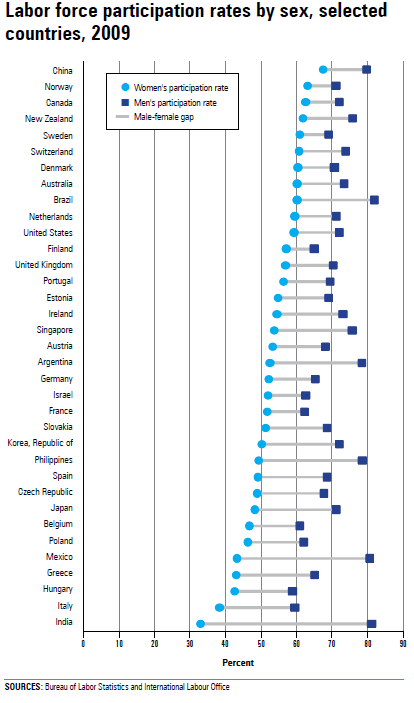
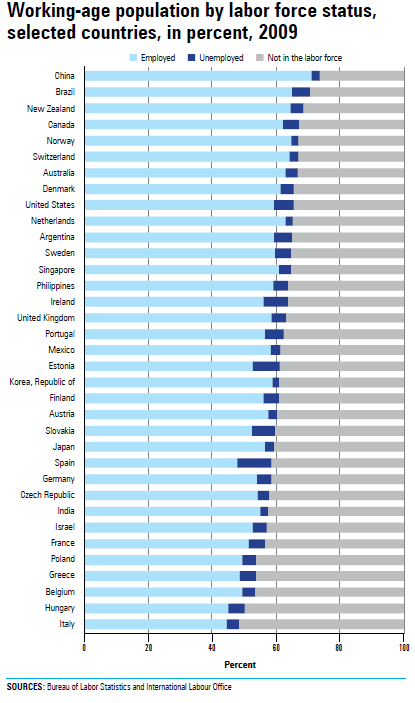
Labor Labor market data are on a civilian basis (i.e., members of the Armed Forces are not included). The labor force participation rate is the labor force as a percent of the working-age population; it is an overall indicator of the level of labor market activity. The labor force is the sum of the employed plus the unemployed; it provides an indication of the size of the labor supply. The working-age population is the population ages 15 or 16 and older. (Lower age limits vary by country. See source documents.)

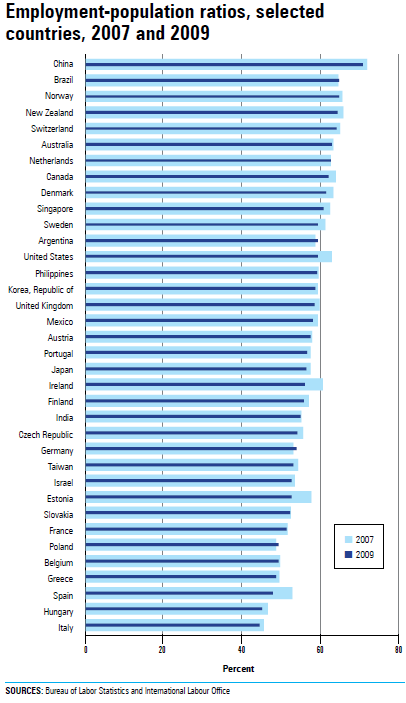
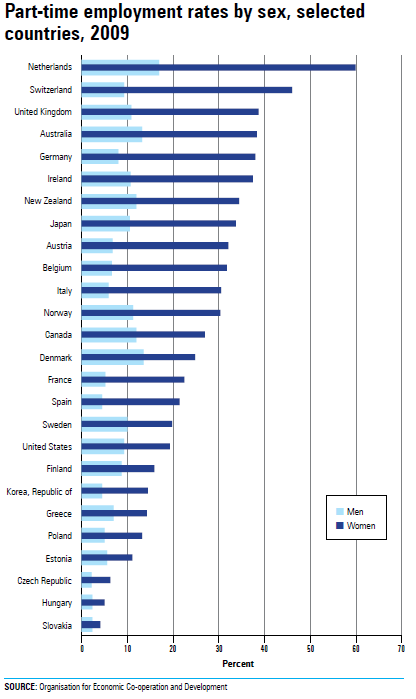
The employed are persons who, during the reference week, did work for at least 1 hour as paid employees, worked in their own business, profession, or on their own farm, or as unpaid workers in an enterprise operated by a family member (at least 1 hour according to the ILO guidelines but at least 15 hours according to U.S. concepts). Definitions of the employed vary by country. See source documents. The employment-population ratio is employment as a percent of the working-age population. Part-time employment refers to employed persons who usually work less than 30 hours per week in their main job; in some countries, “actual” rather than “usual” hours are used. The part-time employment rate is the share of employment that is part time and is also referred to as the incidence of part-time employment.

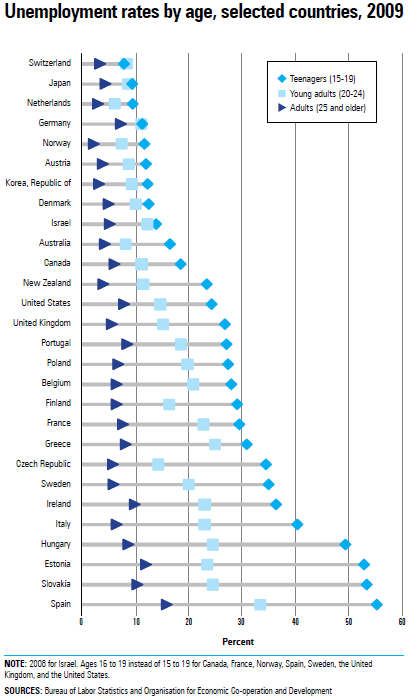
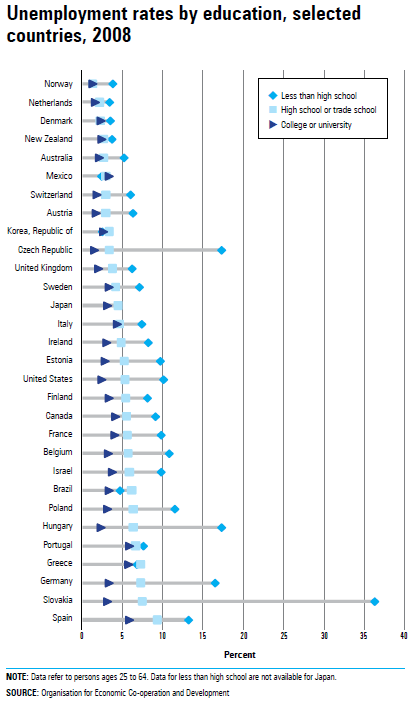
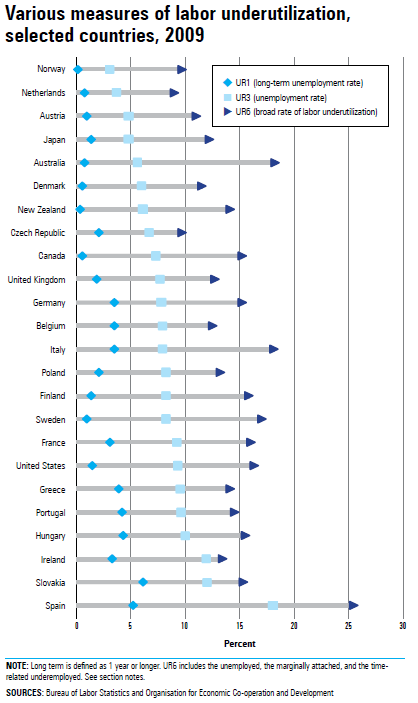
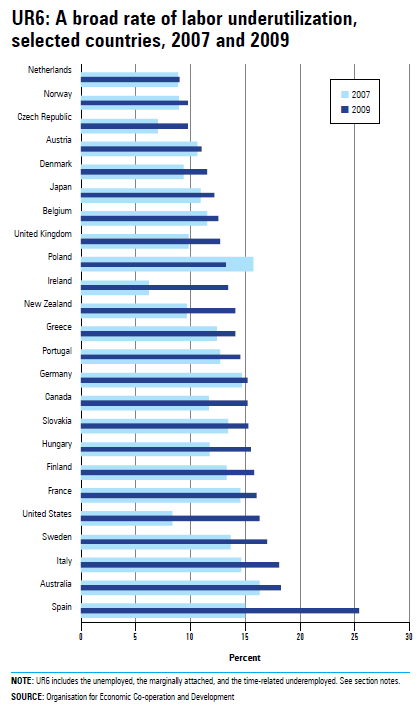
The unemployed are persons without work, actively seeking employment and currently available to start work. Definitions of the unemployed vary by country; see source documents. The unemployment rate is unemployment as a percent of the labor force; it is the most widely used measure of an economy’s unused labor supply. Persons marginally attached to the labor force are those who did not look for work in the past 4 weeks, but who wish to work, are available to work and, in some countries, have looked for work sometime in the past 12 months. Discouraged workers are the subset of the marginally attached who are not currently searching for a job because they believe none are available. The time-related underemployed are either: (1) full-time workers working less than a full week (less than 35 hours in the United States) during the survey reference week for economic reasons or (2) part-time workers who want but cannot find full-time work. For unemployment rates by education, the levels of educational attainment accord with the International Standard Classification for Education (ISCED) in its current version, known as ISCED 1997. Less than high school corresponds to “less than upper secondary education” and includes ISCED levels 0-3C. High school or trade school corresponds to “upper secondary and post-secondary education” and includes levels 3-4. College or university corresponds to “tertiary non-university and university” and includes levels 5-6.


Go to:


Last Modified Date: August 2, 2011