
An official website of the United States government
An official website of the United States government
The .gov means it's official.
Federal government websites often end in .gov or .mil. Before sharing sensitive information,
make sure you're on a federal government site.
The site is secure.
The
https:// ensures that you are connecting to the official website and that any
information you provide is encrypted and transmitted securely.
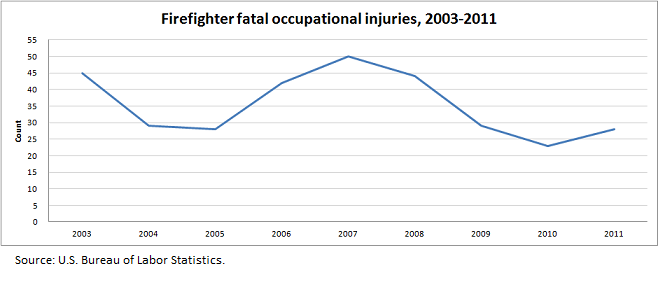
Firefighting can be perilous work. Over the past 4 years, an average of 31 firefighters were killed on the job each year and 14,700 suffered work-related nonfatal injuries and illnesses that resulted in time away from work.
Firefighters are described under the 2010 Standard Occupational Classification system as individuals who control and extinguish fires or respond to emergency situations where life, property, or the environment is at risk. Duties may include fire prevention, emergency medical service, hazardous material response, search and rescue, and disaster assistance. This occupational category does not include fire inspectors or fire investigators. Firefighters are mainly employed in local government (91 percent in 2010), with the remainder employed by federal or state governments. 1
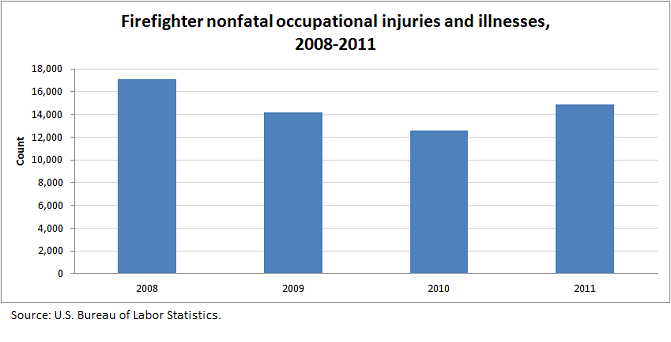
A total of 28 firefighters were fatally injured at work in 2011.2 The 2011 total represents a 29-percent decrease over the average number of firefighters killed per year from 2003 to 2010. The 2011 fatal injury rate for firefighters was 2.5 per 100,000 full-time equivalent workers, compared with 3.5 for all occupations. In addition, there were 14,890 nonfatal occupational injury and illness cases involving days away from work to firefighters in 2011, an 18-percent increase from 2010. The 2011 rate of nonfatal occupational injuries and illnesses for firefighters was 475.2 per 10,000 full-time workers, compared with 117.3 for all occupations and ownerships.3
Men accounted for all the job-related firefighter fatalities from 2007 to 2011. Similarly, nonfatal occupational injuries and illnesses occurred predominately among men. Women accounted for approximately 8 percent of the nonfatal cases in 2011, although women represented just 4.5 percent of all employed firefighters in 2011. 4
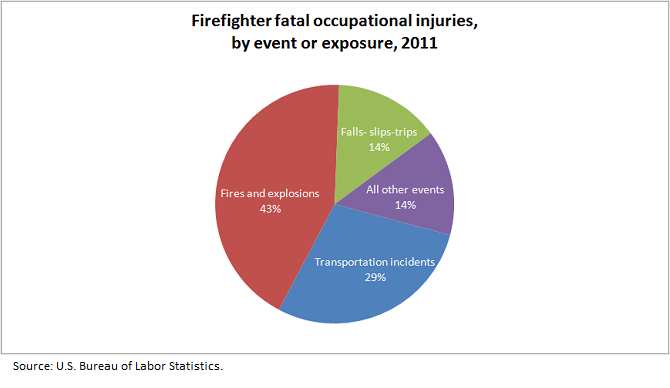
The two primary events or exposures resulting in fatal occupational injuries to firefighters in 2011 were fires (36 percent) and transportation incidents (29 percent). Half of the 2011 fatal fire events were associated with a collapsing building, structure, or structural elements during the fire. Of the 8 fatal transportation incidents, 5 were due to roadway incidents, 2 involved pedestrians, and 1 was the result of an aircraft incident.
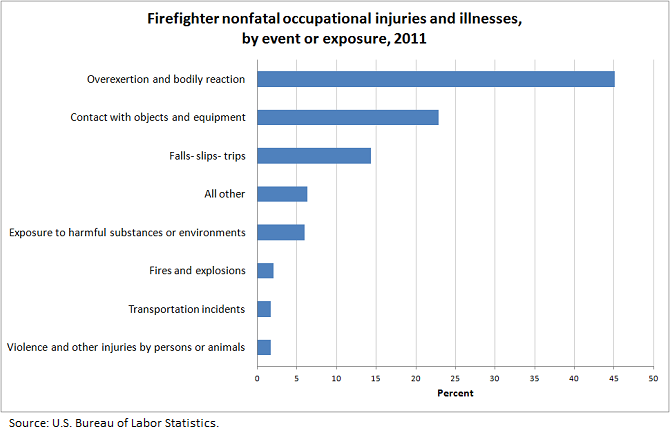
Alternatively, nonfatal firefighter injuries and illnesses in 2011 were generally associated with overexertion and bodily reaction (45 percent), contact with objects and equipment (23 percent), and falls, slips and trips (14 percent). The parts of body most frequently associated with nonfatal firefighter occupational injuries were the lower extremities (26 percent), upper extremities (23 percent), and the trunk (22 percent).
U.S. Bureau of Labor Statistics. Fatality data are from the Census of Fatal Occupational Injuries. Nonfatal injury and illness data are from the Survey of Occupational Injuries and Illnesses.
1 See Occupational Outlook Handbook (U.S. Bureau of Labor Statistics, March 2012), https://www.bls.gov/ooh/home.htm.
2 Volunteer firefighters are included in fatal injury counts.
3 Volunteer firefighters are not included in fatal rate calculations to maintain consistency with the CPS employment. For additional information see: Stop, drop, and roll: workplace hazards of local government firefighters, 2009 by Gary M. Kurlick.
4 Source: Bureau of Labor Statistics Labor Force Statistics from the Current Population Survey, 2011.
Last Modified Date: July 19, 2013