
An official website of the United States government
An official website of the United States government
The .gov means it's official.
Federal government websites often end in .gov or .mil. Before sharing sensitive information,
make sure you're on a federal government site.
The site is secure.
The
https:// ensures that you are connecting to the official website and that any
information you provide is encrypted and transmitted securely.
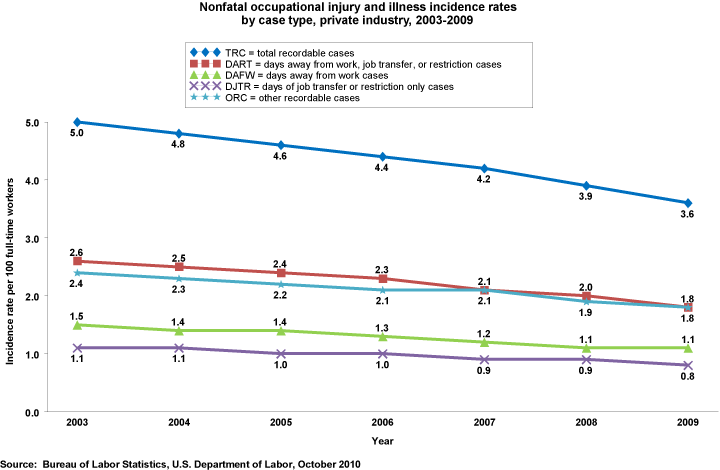
Incidence rates for all case types declined significantly in 2009, with the exception of days-away-from-work cases whose rate remained relatively unchanged from 2008 at the level of detail at which data are presented in this chart.
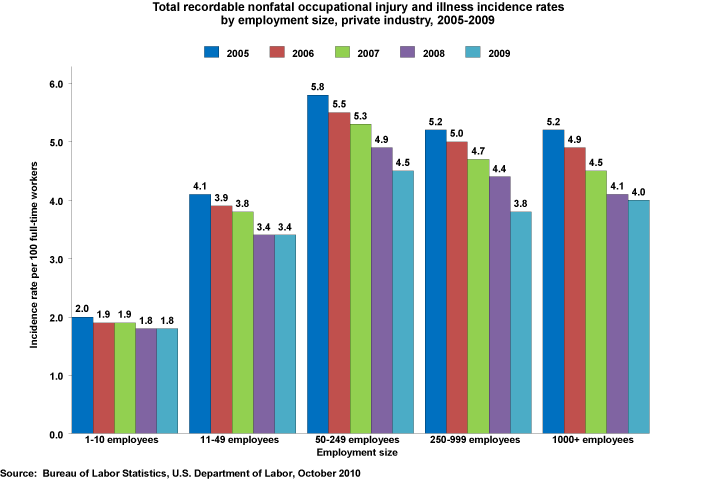
The total recordable case injury and illness incidence rate was highest among mid-size establishments (those employing between 50 and 249 workers) in 2009 and lowest among small establishments (those employing fewer than 11 workers) compared to establishments of other sizes.
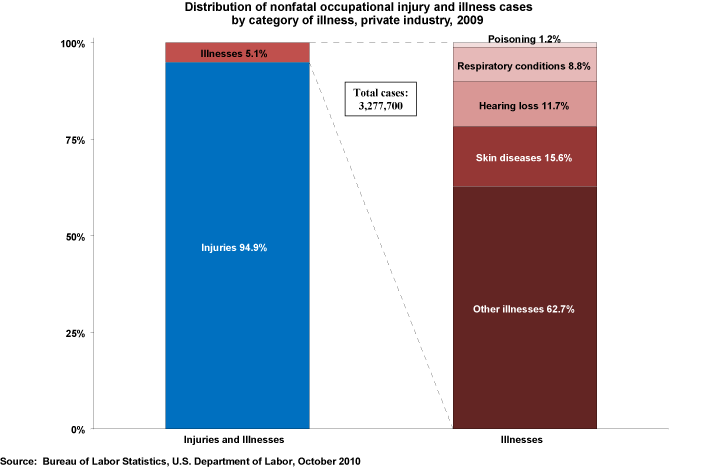
Injuries accounted for the overwhelming majority of cases reported for the SOII—94.9 percent, with illnesses accounting for the remaining 5.1 percent of cases. Most illnesses are classified as “All other illnesses,” which includes such things as repetitive motion cases and systemic diseases and disorders.
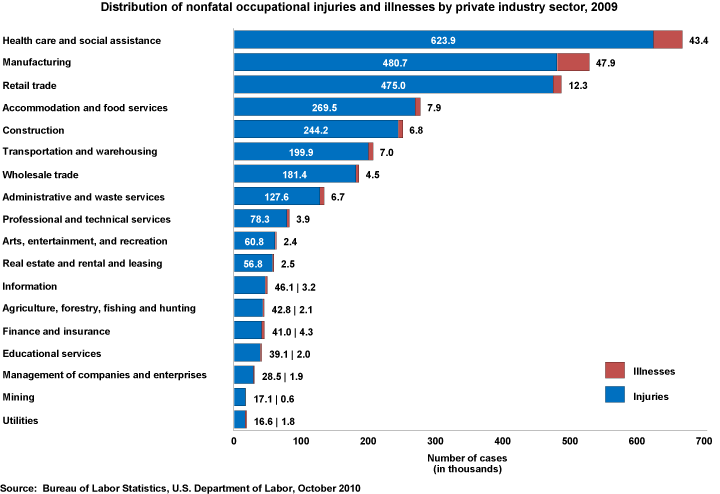
Similar to the distribution of injuries and illnesses reported among all private industry establishments in 2009, injuries accounted for most cases reported among individual private industry sectors—illnesses accounted for only a fraction of cases reported in each industry sector.
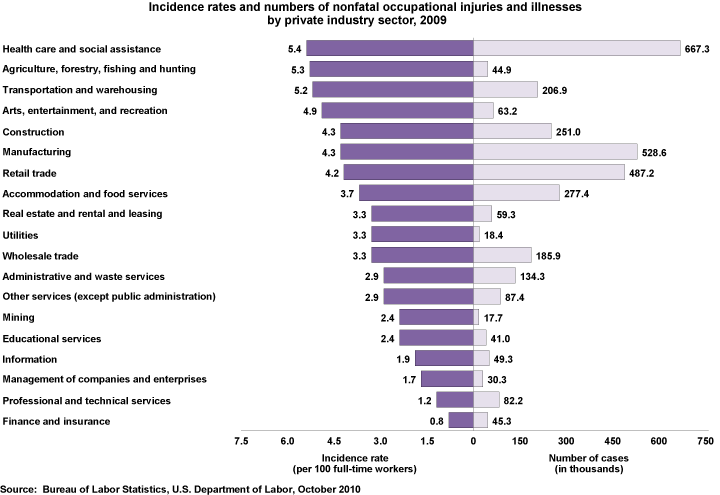
Three sectors alone—Health care & social assistance, Manufacturing, and Retail trade—combined to account for more than half of all cases reported among private industry establishments in 2009.
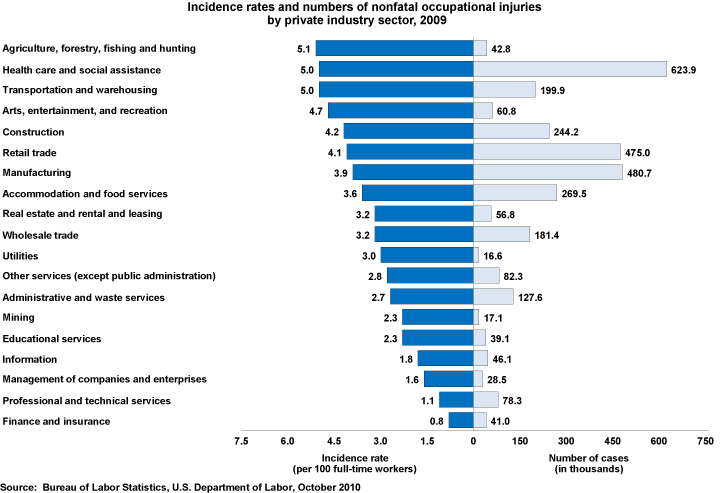
Health care and social assistance reported more injury cases than any other private industry sector—623,900 cases—and accounted for 20.1 percent of all injury cases reported among private industry workplaces in 2009.
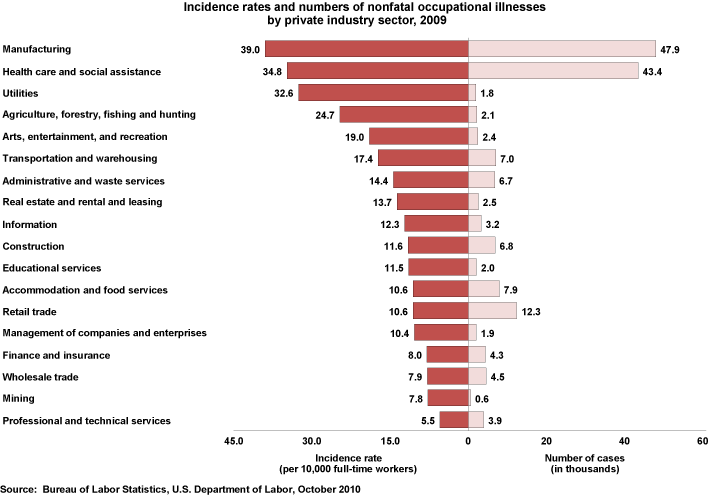
Manufacturing and Health care & social assistance together reported the majority of private industry illnesses in 2009, resulting in an illness rate in Manufacturing that was more than twice the rate of illnesses nationally (18.3 cases per 10,000 full-time workers).
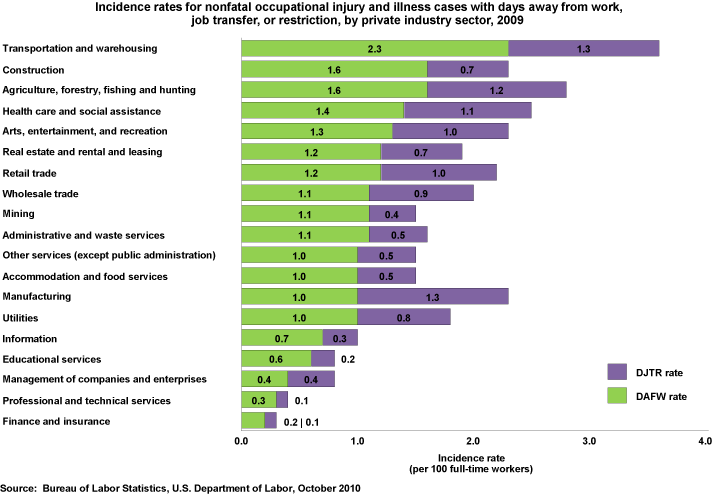
Manufacturing was the only private industry sector in which the rate of cases involving job transfer or restriction (DJTR) exceeded the rate of cases involving days away from work (DAFW) in 2009. This has been the case in Manufacturing since 1998.
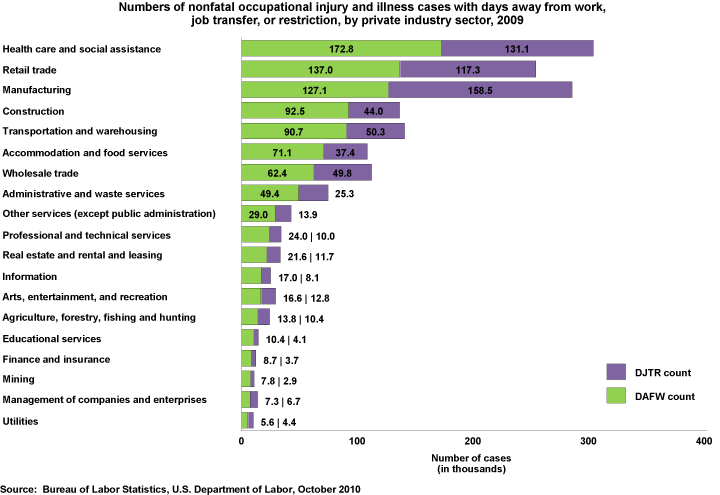
Manufacturing reported the most cases involving days of job transfer or restriction (DJTR) among all private industry sectors and was the only sector in which the of number DJTR cases exceeded the number of cases involving days away from work (DAFW) in 2009.
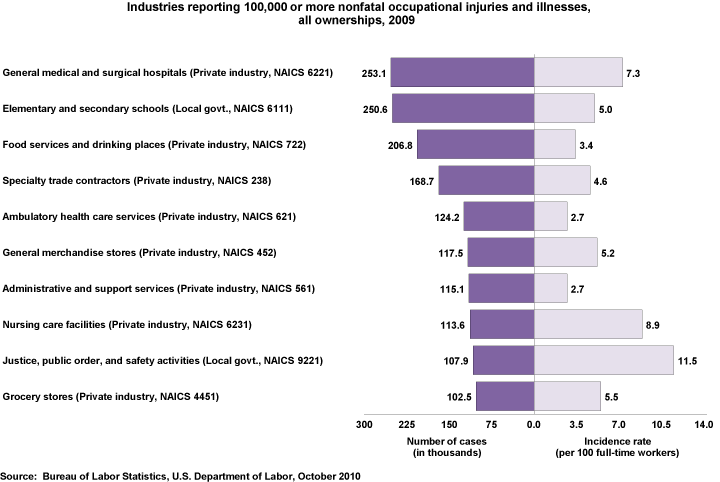
Ten industries reported 100,000 or more injury and illness cases in 2009. Together these industries combined to account for nearly 4 in 10 cases reported among private industry and State and local government workers in 2009.
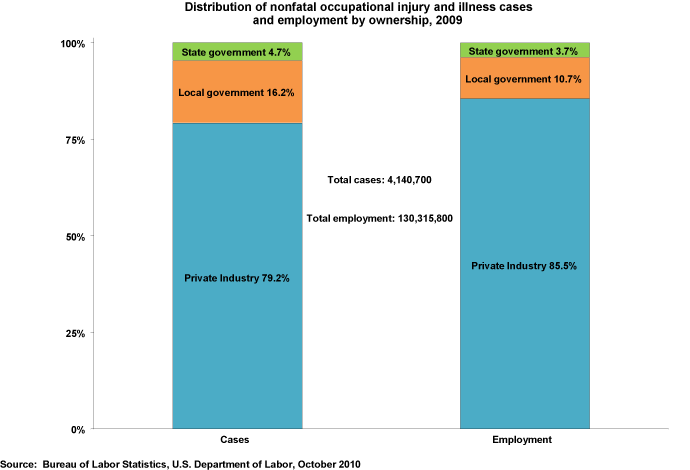
Nearly 8 in 10 nonfatal injury and illness cases reported in 2009 occurred among private industry workplaces which accounted for 85.5 percent of total employment covered by the SOII. The remaining 20.9 percent of injury and illness cases occurred among public sector workers who accounted for 14.4 percent of the employees covered by this survey.
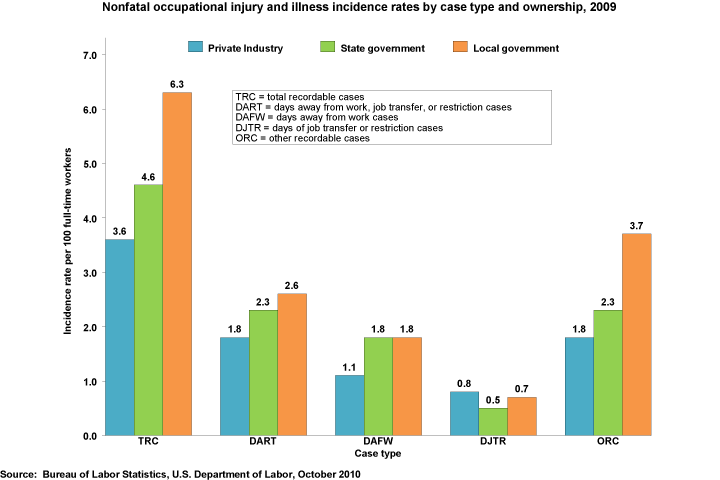
The rate of total recordable cases of injuries and illnesses was highest among local government workplaces in 2009 (6.3 cases per 100 full-time workers), compared to State government and private industry workplaces whose rates were 4.6 cases and 3.6 cases, respectively.
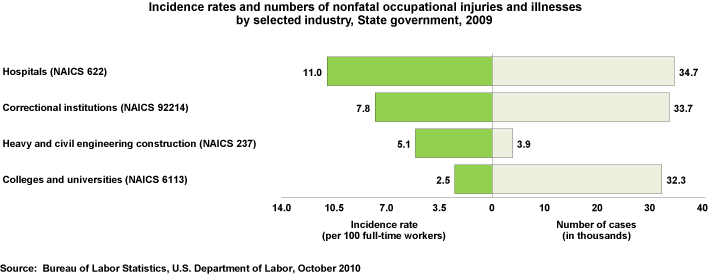
National public sector estimates covering nearly five million State government workers are available from the SOII in 2009 for just the second consecutive year, presenting injury and illness estimates for select industries.
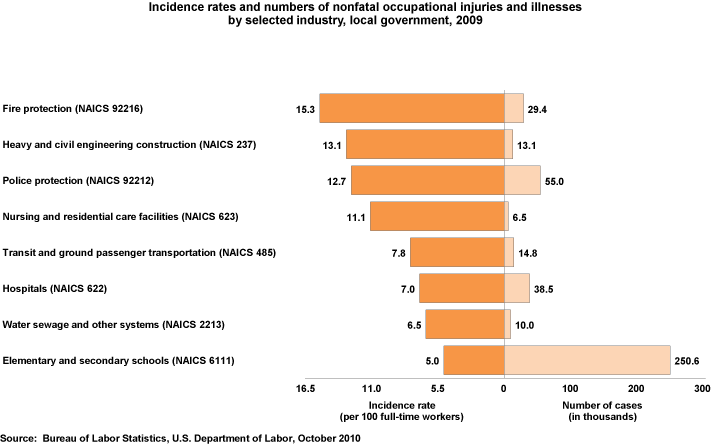
National public sector estimates covering nearly 14 million local government employees show that nearly 4 in 10 nonfatal injuries and illnesses reported in local government workplaces occurred among elementary and secondary school workers in 2009, although the rate of occurrence in this industry was comparatively lower than rates in other industries.
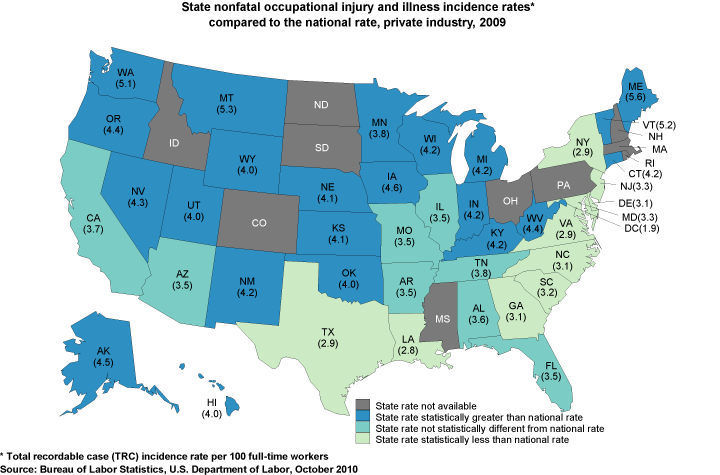
Among the 41 States for which estimates of nonfatal workplace injuries and illnesses are available for 2009, 22 States experienced a higher incidence of injuries and illnesses than the national rate (3.6 cases per 100 full-time workers); 11 States experienced a lower rate; and eight States had rates that were not significantly different from the national rate.