
An official website of the United States government
An official website of the United States government
The .gov means it's official.
Federal government websites often end in .gov or .mil. Before sharing sensitive information,
make sure you're on a federal government site.
The site is secure.
The
https:// ensures that you are connecting to the official website and that any
information you provide is encrypted and transmitted securely.
Plan, direct, or coordinate the actual distribution or movement of a product or service to the customer. Coordinate sales distribution by establishing sales territories, quotas, and goals and establish training programs for sales representatives. Analyze sales statistics gathered by staff to determine sales potential and inventory requirements and monitor the preferences of customers.
Employment estimate and mean wage estimates for this occupation:
| Employment (1) | Employment RSE (3) |
Mean hourly wage |
Mean annual wage (2) |
Wage RSE (3) |
|---|---|---|---|---|
| 371,410 | 0.6 % | $66.18 | $137,650 | 0.3 % |
Percentile wage estimates for this occupation:
| Percentile | 10% | 25% | 50% (Median) |
75% | 90% |
|---|---|---|---|---|---|
| Hourly Wage | $27.69 | $39.66 | $58.20 | $82.11 | (5) |
| Annual Wage (2) | $57,590 | $82,490 | $121,060 | $170,790 | (5) |
Industries with the highest published employment and wages for this occupation are provided. For a list of all industries with employment in this occupation, see the Create Customized Tables function.
Industries with the highest levels of employment in this occupation:
| Industry | Employment (1) | Percent of industry employment | Hourly mean wage | Annual mean wage (2) |
|---|---|---|---|---|
| Management of Companies and Enterprises | 29,050 | 1.25 | $72.99 | $151,810 |
| Automobile Dealers | 25,920 | 2.01 | $63.94 | $133,000 |
| Computer Systems Design and Related Services | 17,690 | 0.88 | $75.30 | $156,620 |
| Wholesale Electronic Markets and Agents and Brokers | 17,270 | 1.97 | $70.88 | $147,420 |
| Merchant Wholesalers, Durable Goods (4232, 4233, 4235, 4236, 4237, and 4239 only) | 14,820 | 1.12 | $64.93 | $135,060 |
Industries with the highest concentration of employment in this occupation:
| Industry | Employment (1) | Percent of industry employment | Hourly mean wage | Annual mean wage (2) |
|---|---|---|---|---|
| Automobile Dealers | 25,920 | 2.01 | $63.94 | $133,000 |
| Wholesale Electronic Markets and Agents and Brokers | 17,270 | 1.97 | $70.88 | $147,420 |
| Merchant Wholesalers, Nondurable Goods (4242 and 4246 only) | 6,000 | 1.82 | $71.25 | $148,210 |
| Professional and Commercial Equipment and Supplies Merchant Wholesalers | 9,800 | 1.59 | $71.26 | $148,220 |
| Apparel, Piece Goods, and Notions Merchant Wholesalers | 2,200 | 1.49 | $78.95 | $164,220 |
Top paying industries for this occupation:
| Industry | Employment (1) | Percent of industry employment | Hourly mean wage | Annual mean wage (2) |
|---|---|---|---|---|
| Securities, Commodity Contracts, and Other Financial Investments and Related Activities | 7,720 | 0.84 | $103.85 | $216,000 |
| Oil and Gas Extraction | 190 | 0.14 | $93.03 | $193,500 |
| Legal Services | 430 | 0.04 | $84.93 | $176,640 |
| Scientific Research and Development Services | 2,340 | 0.36 | $84.31 | $175,360 |
| Other Information Services | 4,000 | 1.45 | $84.26 | $175,270 |
States and areas with the highest published employment, location quotients, and wages for this occupation are provided. For a list of all areas with employment in this occupation, see the Create Customized Tables function.
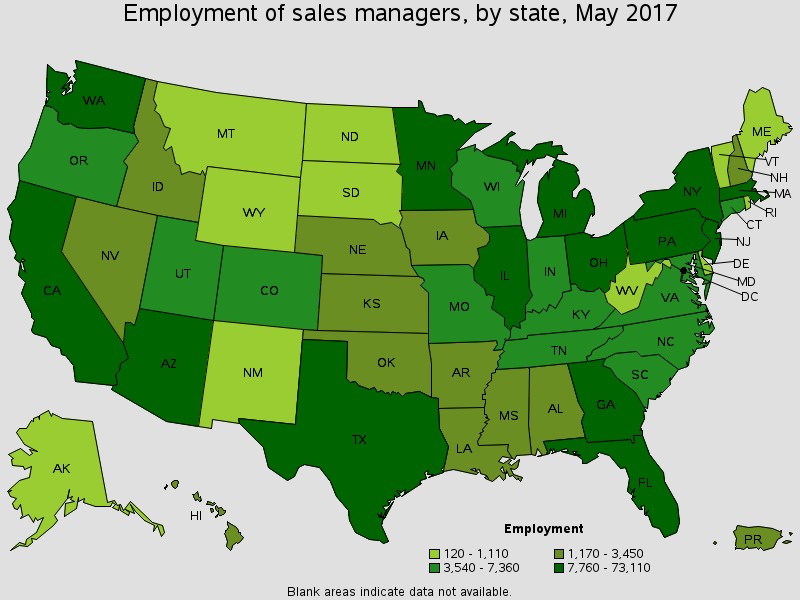
States with the highest employment level in this occupation:
| State | Employment (1) | Employment per thousand jobs | Location quotient (9) | Hourly mean wage | Annual mean wage (2) |
|---|---|---|---|---|---|
| California | 73,110 | 4.38 | 1.68 | $63.03 | $131,100 |
| Texas | 24,410 | 2.05 | 0.79 | $69.87 | $145,330 |
| Illinois | 24,380 | 4.11 | 1.58 | $61.70 | $128,340 |
| New York | 21,420 | 2.33 | 0.89 | $95.09 | $197,780 |
| Florida | 16,490 | 1.96 | 0.75 | $62.59 | $130,190 |
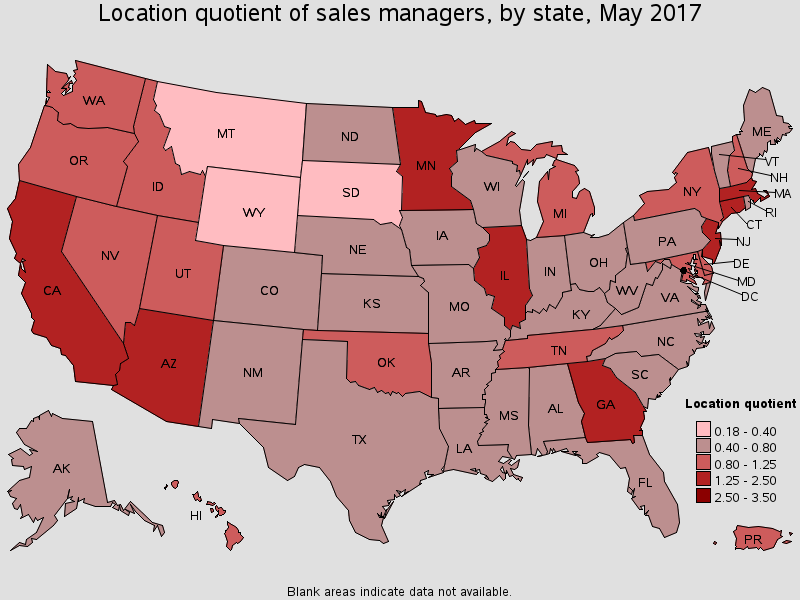
States with the highest concentration of jobs and location quotients in this occupation:
| State | Employment (1) | Employment per thousand jobs | Location quotient (9) | Hourly mean wage | Annual mean wage (2) |
|---|---|---|---|---|---|
| Massachusetts | 15,820 | 4.48 | 1.72 | $72.78 | $151,380 |
| California | 73,110 | 4.38 | 1.68 | $63.03 | $131,100 |
| Minnesota | 11,950 | 4.21 | 1.62 | $65.83 | $136,930 |
| Connecticut | 6,870 | 4.15 | 1.59 | $70.86 | $147,390 |
| Illinois | 24,380 | 4.11 | 1.58 | $61.70 | $128,340 |
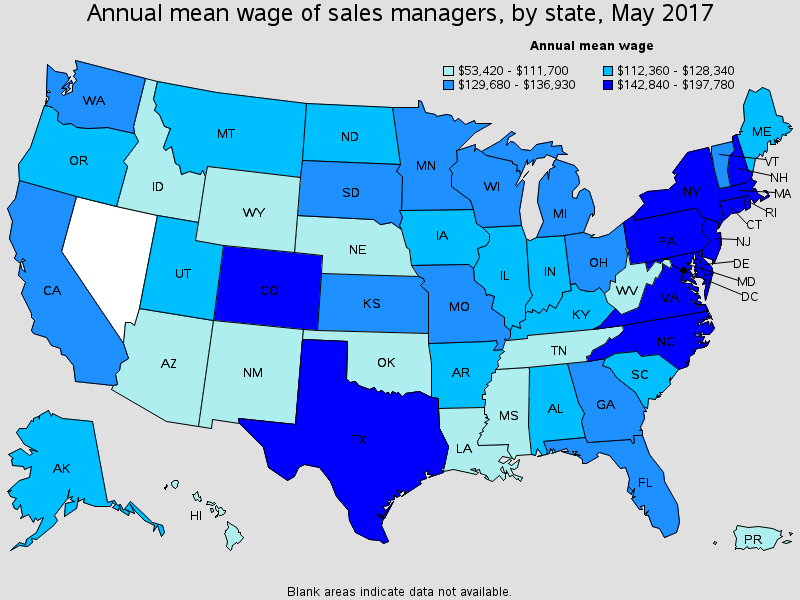
Top paying States for this occupation:
| State | Employment (1) | Employment per thousand jobs | Location quotient (9) | Hourly mean wage | Annual mean wage (2) |
|---|---|---|---|---|---|
| New York | 21,420 | 2.33 | 0.89 | $95.09 | $197,780 |
| Delaware | 1,020 | 2.30 | 0.88 | $88.62 | $184,330 |
| Virginia | 5,330 | 1.41 | 0.54 | $80.48 | $167,400 |
| New Jersey | 13,150 | 3.28 | 1.26 | $79.70 | $165,780 |
| Colorado | 4,870 | 1.91 | 0.73 | $75.13 | $156,280 |
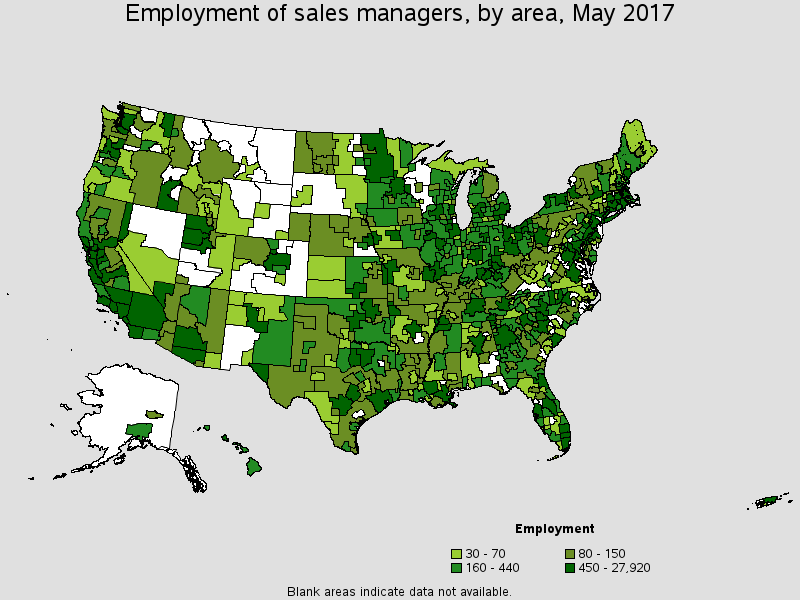
Metropolitan areas with the highest employment level in this occupation:
| Metropolitan area | Employment (1) | Employment per thousand jobs | Location quotient (9) | Hourly mean wage | Annual mean wage (2) |
|---|---|---|---|---|---|
| New York-Jersey City-White Plains, NY-NJ Metropolitan Division | 20,560 | 3.07 | 1.18 | $96.31 | $200,320 |
| Los Angeles-Long Beach-Glendale, CA Metropolitan Division | 19,120 | 4.32 | 1.66 | $61.21 | $127,320 |
| Chicago-Naperville-Arlington Heights, IL Metropolitan Division | 16,740 | 4.57 | 1.75 | $62.96 | $130,960 |
| Atlanta-Sandy Springs-Roswell, GA | 12,350 | 4.72 | 1.81 | $65.37 | $135,960 |
| Boston-Cambridge-Newton, MA NECTA Division | 9,940 | 5.40 | 2.07 | $77.04 | $160,250 |
| Minneapolis-St. Paul-Bloomington, MN-WI | 9,530 | 4.93 | 1.89 | $69.67 | $144,920 |
| Phoenix-Mesa-Scottsdale, AZ | 9,310 | 4.70 | 1.80 | $54.24 | $112,820 |
| Anaheim-Santa Ana-Irvine, CA Metropolitan Division | 8,800 | 5.45 | 2.09 | $68.10 | $141,640 |
| Houston-The Woodlands-Sugar Land, TX | 7,230 | 2.47 | 0.95 | $72.83 | $151,490 |
| San Jose-Sunnyvale-Santa Clara, CA | 6,860 | 6.30 | 2.42 | $75.83 | $157,720 |
Metropolitan areas with the highest concentration of jobs and location quotients in this occupation:
| Metropolitan area | Employment (1) | Employment per thousand jobs | Location quotient (9) | Hourly mean wage | Annual mean wage (2) |
|---|---|---|---|---|---|
| San Jose-Sunnyvale-Santa Clara, CA | 6,860 | 6.30 | 2.42 | $75.83 | $157,720 |
| Bridgeport-Stamford-Norwalk, CT | 2,610 | 6.29 | 2.41 | $82.83 | $172,290 |
| Framingham, MA NECTA Division | 1,050 | 6.07 | 2.33 | $75.52 | $157,080 |
| San Francisco-Redwood City-South San Francisco, CA Metropolitan Division | 6,220 | 5.57 | 2.14 | $75.34 | $156,700 |
| Napa, CA | 410 | 5.57 | 2.14 | $72.48 | $150,760 |
| Anaheim-Santa Ana-Irvine, CA Metropolitan Division | 8,800 | 5.45 | 2.09 | $68.10 | $141,640 |
| Boston-Cambridge-Newton, MA NECTA Division | 9,940 | 5.40 | 2.07 | $77.04 | $160,250 |
| Danbury, CT | 400 | 5.10 | 1.96 | $64.64 | $134,450 |
| Minneapolis-St. Paul-Bloomington, MN-WI | 9,530 | 4.93 | 1.89 | $69.67 | $144,920 |
| San Rafael, CA Metropolitan Division | 560 | 4.88 | 1.87 | $62.41 | $129,810 |
Top paying metropolitan areas for this occupation:
| Metropolitan area | Employment (1) | Employment per thousand jobs | Location quotient (9) | Hourly mean wage | Annual mean wage (2) |
|---|---|---|---|---|---|
| New York-Jersey City-White Plains, NY-NJ Metropolitan Division | 20,560 | 3.07 | 1.18 | $96.31 | $200,320 |
| Wilmington, DE-MD-NJ Metropolitan Division | 900 | 2.60 | 1.00 | $87.28 | $181,550 |
| Naples-Immokalee-Marco Island, FL | 230 | 1.61 | 0.62 | $87.19 | $181,360 |
| California-Lexington Park, MD | 40 | 0.93 | 0.36 | $87.15 | $181,280 |
| Fort Collins, CO | 210 | 1.36 | 0.52 | $86.62 | $180,170 |
| Newark, NJ-PA Metropolitan Division | 4,170 | 3.58 | 1.37 | $86.61 | $180,160 |
| Glens Falls, NY | 50 | 0.96 | 0.37 | $86.08 | $179,050 |
| Nassau County-Suffolk County, NY Metropolitan Division | 2,440 | 1.87 | 0.72 | $85.55 | $177,940 |
| Philadelphia, PA Metropolitan Division | 1,150 | 1.27 | 0.49 | $83.14 | $172,930 |
| Bridgeport-Stamford-Norwalk, CT | 2,610 | 6.29 | 2.41 | $82.83 | $172,290 |
Nonmetropolitan areas with the highest employment in this occupation:
| Nonmetropolitan area | Employment (1) | Employment per thousand jobs | Location quotient (9) | Hourly mean wage | Annual mean wage (2) |
|---|---|---|---|---|---|
| North Northeastern Ohio non-metropolitan area (non-contiguous) | 530 | 1.60 | 0.61 | $51.12 | $106,340 |
| Northwest Minnesota nonmetropolitan area | 520 | 2.76 | 1.06 | $45.74 | $95,140 |
| West Central Illinois nonmetropolitan area | 440 | 2.57 | 0.99 | $50.24 | $104,490 |
| Southeast Minnesota nonmetropolitan area | 420 | 2.67 | 1.03 | $54.46 | $113,270 |
| Northwest Illinois nonmetropolitan area | 370 | 2.73 | 1.05 | $61.49 | $127,900 |
Nonmetropolitan areas with the highest concentration of jobs and location quotients in this occupation:
| Nonmetropolitan area | Employment (1) | Employment per thousand jobs | Location quotient (9) | Hourly mean wage | Annual mean wage (2) |
|---|---|---|---|---|---|
| Connecticut nonmetropolitan area | 150 | 4.45 | 1.71 | $67.77 | $140,960 |
| Hawaii / Kauai nonmetropolitan area | 350 | 3.56 | 1.37 | $42.23 | $87,830 |
| Southwest New Hampshire nonmetropolitan area | 120 | 3.17 | 1.22 | $67.40 | $140,200 |
| Northwest Massachusetts nonmetropolitan area | 80 | 3.02 | 1.16 | $54.70 | $113,780 |
| North Coast Region of California nonmetropolitan area | 290 | 2.79 | 1.07 | $33.79 | $70,280 |
Top paying nonmetropolitan areas for this occupation:
| Nonmetropolitan area | Employment (1) | Employment per thousand jobs | Location quotient (9) | Hourly mean wage | Annual mean wage (2) |
|---|---|---|---|---|---|
| Coastal Plains Region of Texas nonmetropolitan area | 120 | 0.82 | 0.31 | $88.20 | $183,460 |
| Western Pennsylvania nonmetropolitan area | 100 | 0.66 | 0.25 | $83.54 | $173,760 |
| Southwest Virginia nonmetropolitan area | (8) | (8) | (8) | $80.94 | $168,350 |
| Hill Country Region of Texas nonmetropolitan area | 150 | 0.79 | 0.30 | $75.48 | $156,990 |
| West Central New Hampshire nonmetropolitan area | 60 | 0.99 | 0.38 | $72.61 | $151,030 |
These estimates are calculated with data collected from employers in all industry sectors, all metropolitan and nonmetropolitan areas, and all states and the District of Columbia. The top employment and wage figures are provided above. The complete list is available in the downloadable XLS files.
The percentile wage estimate is the value of a wage below which a certain percent of workers fall. The median wage is the 50th percentile wage estimate--50 percent of workers earn less than the median and 50 percent of workers earn more than the median. More about percentile wages.
(1) Estimates for detailed occupations do not sum to the totals because the totals include occupations not shown separately. Estimates do not include self-employed workers.
(2) Annual wages have been calculated by multiplying the hourly mean wage by a "year-round, full-time" hours figure of 2,080 hours; for those occupations where there is not an hourly wage published, the annual wage has been directly calculated from the reported survey data.
(3) The relative standard error (RSE) is a measure of the reliability of a survey statistic. The smaller the relative standard error, the more precise the estimate.
(5) This wage is equal to or greater than $100.00 per hour or $208,000 per year.
(8) Estimate not released.
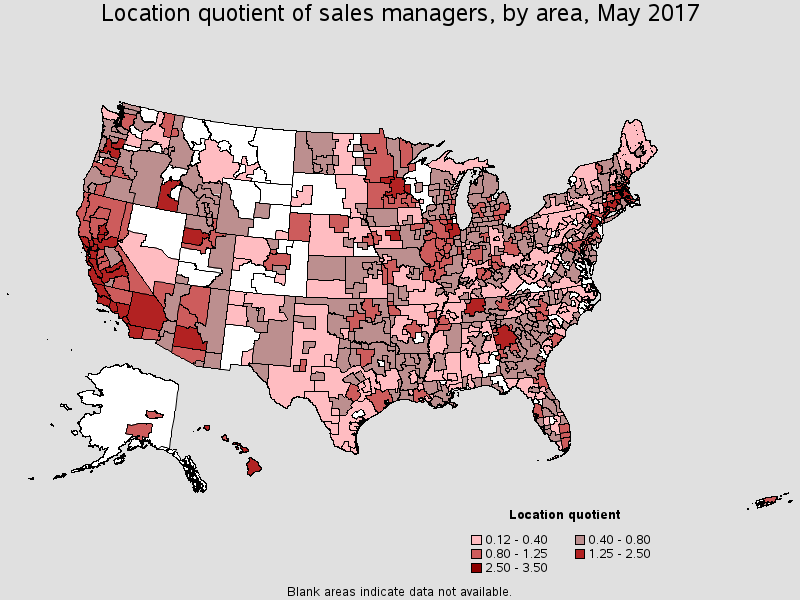
(9) The location quotient is the ratio of the area concentration of occupational employment to the national average concentration. A location quotient greater than one indicates the occupation has a higher share of employment than average, and a location quotient less than one indicates the occupation is less prevalent in the area than average.
Other OES estimates and related information:
May 2017 National Occupational Employment and Wage Estimates
May 2017 State Occupational Employment and Wage Estimates
May 2017 Metropolitan and Nonmetropolitan Area Occupational Employment and Wage Estimates
May 2017 National Industry-Specific Occupational Employment and Wage Estimates
Last Modified Date: March 30, 2018