
An official website of the United States government
An official website of the United States government
The .gov means it's official.
Federal government websites often end in .gov or .mil. Before sharing sensitive information,
make sure you're on a federal government site.
The site is secure.
The
https:// ensures that you are connecting to the official website and that any
information you provide is encrypted and transmitted securely.
Evaluate, authorize, or recommend approval of commercial, real estate, or credit loans. Advise borrowers on financial status and payment methods. Includes mortgage loan officers and agents, collection analysts, loan servicing officers, and loan underwriters.
Employment estimate and mean wage estimates for this occupation:
| Employment (1) | Employment RSE (3) |
Mean hourly wage |
Mean annual wage (2) |
Wage RSE (3) |
|---|---|---|---|---|
| 307,240 | 1.1 % | $37.46 | $77,920 | 0.6 % |
Percentile wage estimates for this occupation:
| Percentile | 10% | 25% | 50% (Median) |
75% | 90% |
|---|---|---|---|---|---|
| Hourly Wage | $15.71 | $21.95 | $31.09 | $45.27 | $65.19 |
| Annual Wage (2) | $32,670 | $45,660 | $64,660 | $94,150 | $135,590 |
Industries with the highest published employment and wages for this occupation are provided. For a list of all industries with employment in this occupation, see the Create Customized Tables function.
Industries with the highest levels of employment in this occupation:
| Industry | Employment (1) | Percent of industry employment | Hourly mean wage | Annual mean wage (2) |
|---|---|---|---|---|
| Credit Intermediation and Related Activities (5221 And 5223 only) | 161,710 | 8.13 | $36.70 | $76,340 |
| Nondepository Credit Intermediation | 91,110 | 14.47 | $36.89 | $76,720 |
| Management of Companies and Enterprises | 17,170 | 0.74 | $38.63 | $80,350 |
| Automobile Dealers | 12,630 | 0.98 | $47.25 | $98,270 |
| Securities, Commodity Contracts, and Other Financial Investments and Related Activities | 4,730 | 0.52 | $51.87 | $107,900 |
Industries with the highest concentration of employment in this occupation:
| Industry | Employment (1) | Percent of industry employment | Hourly mean wage | Annual mean wage (2) |
|---|---|---|---|---|
| Nondepository Credit Intermediation | 91,110 | 14.47 | $36.89 | $76,720 |
| Credit Intermediation and Related Activities (5221 And 5223 only) | 161,710 | 8.13 | $36.70 | $76,340 |
| Automobile Dealers | 12,630 | 0.98 | $47.25 | $98,270 |
| Management of Companies and Enterprises | 17,170 | 0.74 | $38.63 | $80,350 |
| Securities, Commodity Contracts, and Other Financial Investments and Related Activities | 4,730 | 0.52 | $51.87 | $107,900 |
Top paying industries for this occupation:
| Industry | Employment (1) | Percent of industry employment | Hourly mean wage | Annual mean wage (2) |
|---|---|---|---|---|
| Securities, Commodity Contracts, and Other Financial Investments and Related Activities | 4,730 | 0.52 | $51.87 | $107,900 |
| Other Investment Pools and Funds | (8) | (8) | $51.39 | $106,890 |
| Merchant Wholesalers, Durable Goods (4232, 4233, 4235, 4236, 4237, and 4239 only) | 30 | (7) | $47.59 | $98,990 |
| Automobile Dealers | 12,630 | 0.98 | $47.25 | $98,270 |
| Business, Professional, Labor, Political, and Similar Organizations | 80 | 0.02 | $43.17 | $89,790 |
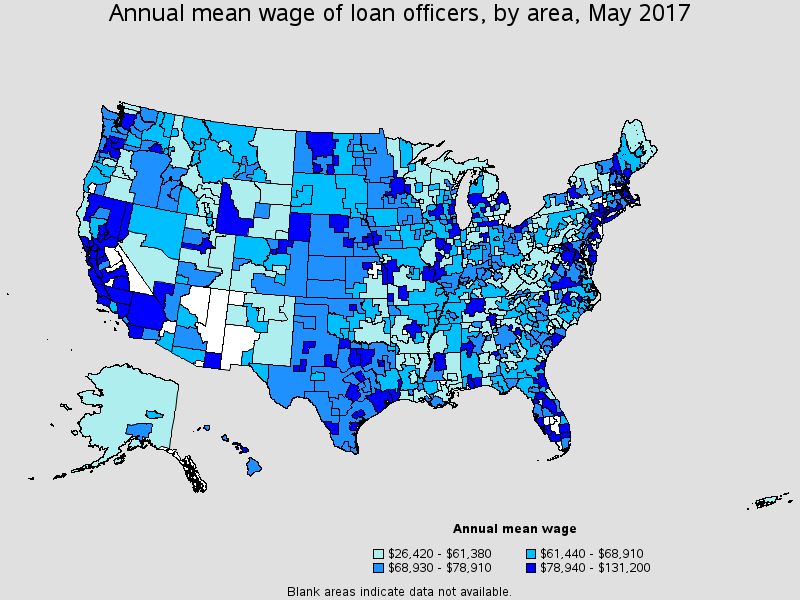
States and areas with the highest published employment, location quotients, and wages for this occupation are provided. For a list of all areas with employment in this occupation, see the Create Customized Tables function.

States with the highest employment level in this occupation:
| State | Employment (1) | Employment per thousand jobs | Location quotient (9) | Hourly mean wage | Annual mean wage (2) |
|---|---|---|---|---|---|
| California | 39,520 | 2.37 | 1.10 | $40.46 | $84,150 |
| Texas | 20,810 | 1.75 | 0.81 | $41.57 | $86,460 |
| Florida | 19,900 | 2.36 | 1.10 | $38.29 | $79,650 |
| North Carolina | 13,100 | 3.05 | 1.41 | $34.92 | $72,630 |
| New York | 12,670 | 1.38 | 0.64 | $52.12 | $108,410 |
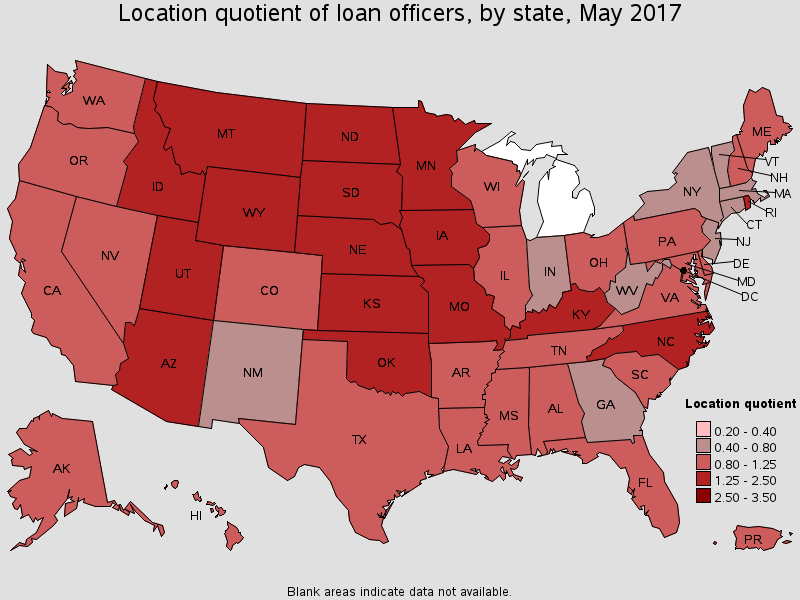
States with the highest concentration of jobs and location quotients in this occupation:
| State | Employment (1) | Employment per thousand jobs | Location quotient (9) | Hourly mean wage | Annual mean wage (2) |
|---|---|---|---|---|---|
| Idaho | 2,580 | 3.77 | 1.75 | $32.05 | $66,660 |
| South Dakota | 1,570 | 3.75 | 1.74 | $30.76 | $63,990 |
| Rhode Island | 1,560 | 3.29 | 1.52 | $33.45 | $69,570 |
| Arizona | 8,480 | 3.14 | 1.45 | $34.21 | $71,160 |
| Utah | 4,410 | 3.12 | 1.45 | $32.04 | $66,650 |
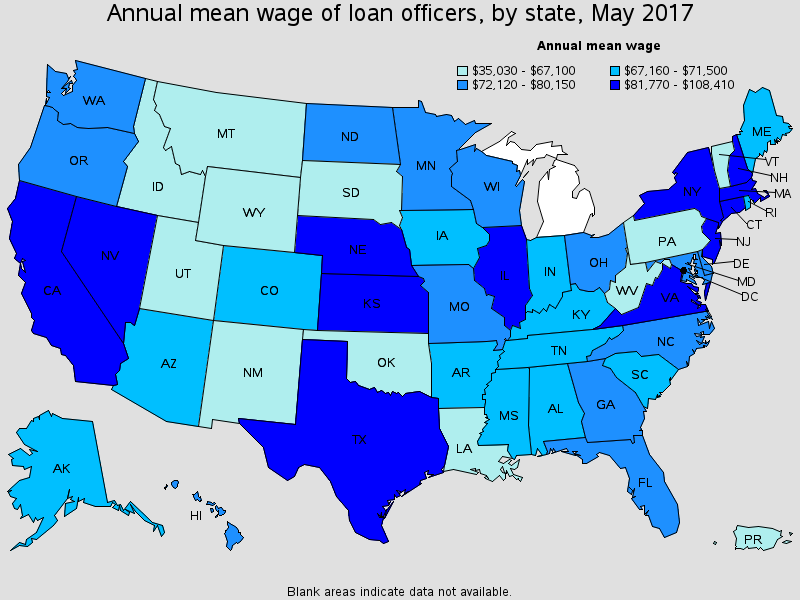
Top paying States for this occupation:
| State | Employment (1) | Employment per thousand jobs | Location quotient (9) | Hourly mean wage | Annual mean wage (2) |
|---|---|---|---|---|---|
| New York | 12,670 | 1.38 | 0.64 | $52.12 | $108,410 |
| District of Columbia | 500 | 0.71 | 0.33 | $50.46 | $104,960 |
| Connecticut | 2,440 | 1.47 | 0.68 | $45.29 | $94,200 |
| Massachusetts | 5,640 | 1.60 | 0.74 | $45.11 | $93,820 |
| New Hampshire | 1,120 | 1.72 | 0.80 | $43.61 | $90,720 |
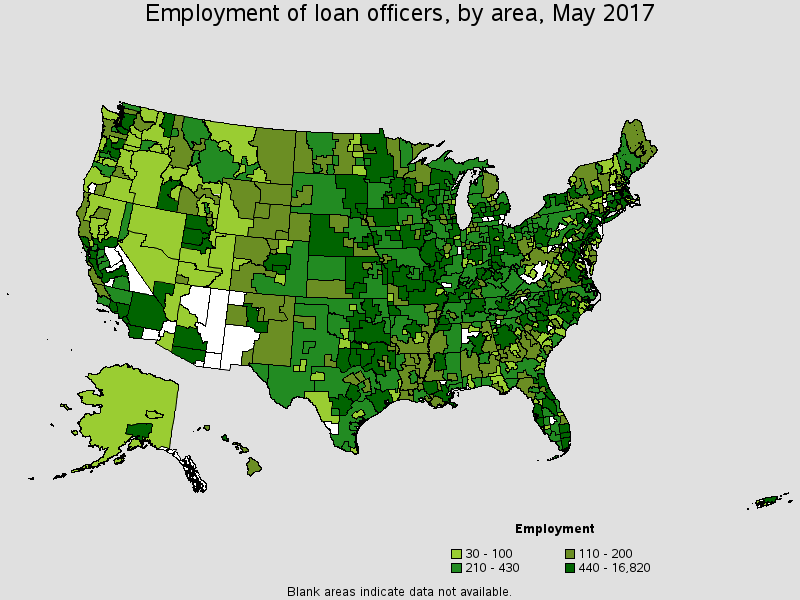
Metropolitan areas with the highest employment level in this occupation:
| Metropolitan area | Employment (1) | Employment per thousand jobs | Location quotient (9) | Hourly mean wage | Annual mean wage (2) |
|---|---|---|---|---|---|
| New York-Jersey City-White Plains, NY-NJ Metropolitan Division | 9,220 | 1.38 | 0.64 | $56.95 | $118,450 |
| Anaheim-Santa Ana-Irvine, CA Metropolitan Division | 8,660 | 5.36 | 2.48 | $36.92 | $76,800 |
| Los Angeles-Long Beach-Glendale, CA Metropolitan Division | 8,160 | 1.84 | 0.85 | $39.20 | $81,540 |
| Chicago-Naperville-Arlington Heights, IL Metropolitan Division | 7,880 | 2.15 | 1.00 | $43.03 | $89,510 |
| Phoenix-Mesa-Scottsdale, AZ | 7,240 | 3.65 | 1.70 | $34.37 | $71,500 |
| Dallas-Plano-Irving, TX Metropolitan Division | 6,010 | 2.41 | 1.12 | $41.81 | $86,970 |
| Minneapolis-St. Paul-Bloomington, MN-WI | 5,720 | 2.96 | 1.37 | $39.03 | $81,180 |
| Washington-Arlington-Alexandria, DC-VA-MD-WV Metropolitan Division | 5,250 | 2.08 | 0.97 | $45.43 | $94,500 |
| Charlotte-Concord-Gastonia, NC-SC | 5,250 | 4.42 | 2.05 | $36.20 | $75,290 |
| Houston-The Woodlands-Sugar Land, TX | 4,280 | 1.46 | 0.68 | $46.13 | $95,940 |
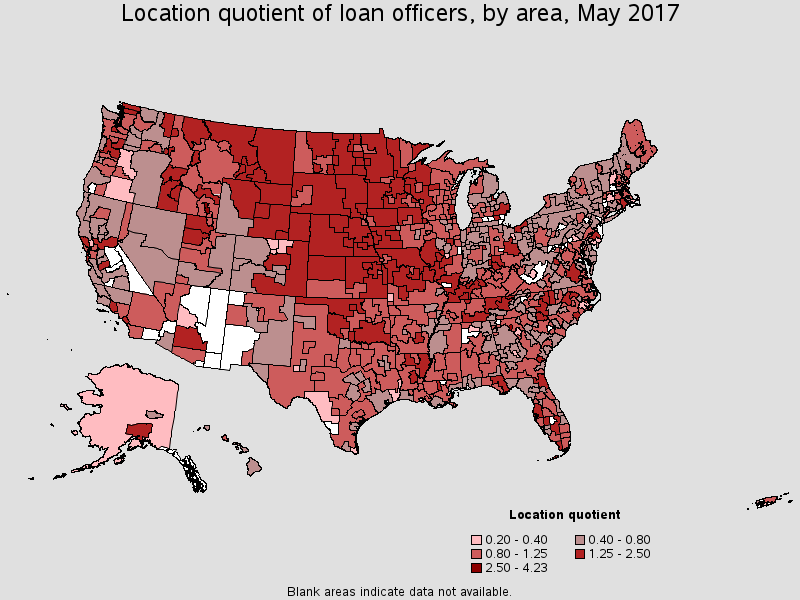
Metropolitan areas with the highest concentration of jobs and location quotients in this occupation:
| Metropolitan area | Employment (1) | Employment per thousand jobs | Location quotient (9) | Hourly mean wage | Annual mean wage (2) |
|---|---|---|---|---|---|
| Pocatello, ID | 300 | 9.12 | 4.23 | $23.46 | $48,790 |
| Gainesville, GA | 530 | 6.21 | 2.88 | $39.85 | $82,890 |
| Anaheim-Santa Ana-Irvine, CA Metropolitan Division | 8,660 | 5.36 | 2.48 | $36.92 | $76,800 |
| Owensboro, KY | 270 | 5.31 | 2.46 | $26.82 | $55,790 |
| Coeur d'Alene, ID | 280 | 4.71 | 2.18 | $29.54 | $61,440 |
| Jacksonville, FL | 3,130 | 4.68 | 2.17 | $38.07 | $79,180 |
| Springfield, IL | 490 | 4.56 | 2.11 | $41.24 | $85,780 |
| Des Moines-West Des Moines, IA | 1,620 | 4.44 | 2.06 | $33.13 | $68,910 |
| Charlotte-Concord-Gastonia, NC-SC | 5,250 | 4.42 | 2.05 | $36.20 | $75,290 |
| Winston-Salem, NC | 1,110 | 4.21 | 1.95 | $41.68 | $86,690 |
Top paying metropolitan areas for this occupation:
| Metropolitan area | Employment (1) | Employment per thousand jobs | Location quotient (9) | Hourly mean wage | Annual mean wage (2) |
|---|---|---|---|---|---|
| Laredo, TX | (8) | (8) | (8) | $63.08 | $131,200 |
| Santa Maria-Santa Barbara, CA | 270 | 1.43 | 0.66 | $63.07 | $131,180 |
| Yuba City, CA | 70 | 1.71 | 0.79 | $62.67 | $130,340 |
| Bridgeport-Stamford-Norwalk, CT | 850 | 2.04 | 0.95 | $57.01 | $118,580 |
| New York-Jersey City-White Plains, NY-NJ Metropolitan Division | 9,220 | 1.38 | 0.64 | $56.95 | $118,450 |
| Lubbock, TX | 260 | 1.83 | 0.85 | $56.49 | $117,500 |
| Victoria, TX | 70 | 1.77 | 0.82 | $54.92 | $114,230 |
| Danbury, CT | 120 | 1.58 | 0.73 | $54.67 | $113,710 |
| Enid, OK | 70 | 2.73 | 1.27 | $54.25 | $112,830 |
| San Rafael, CA Metropolitan Division | 270 | 2.39 | 1.11 | $53.32 | $110,910 |
Nonmetropolitan areas with the highest employment in this occupation:
| Nonmetropolitan area | Employment (1) | Employment per thousand jobs | Location quotient (9) | Hourly mean wage | Annual mean wage (2) |
|---|---|---|---|---|---|
| Southeast Coastal North Carolina nonmetropolitan area | 640 | 2.60 | 1.21 | $29.68 | $61,730 |
| Northwest Minnesota nonmetropolitan area | 570 | 3.04 | 1.41 | $34.32 | $71,390 |
| North Texas Region of Texas nonmetropolitan area | 540 | 2.00 | 0.93 | $34.59 | $71,950 |
| Northeast Kansas nonmetropolitan area | 530 | 3.90 | 1.81 | $37.36 | $77,710 |
| Northeastern Wisconsin nonmetropolitan area | 530 | 2.65 | 1.23 | $28.98 | $60,280 |
Nonmetropolitan areas with the highest concentration of jobs and location quotients in this occupation:
| Nonmetropolitan area | Employment (1) | Employment per thousand jobs | Location quotient (9) | Hourly mean wage | Annual mean wage (2) |
|---|---|---|---|---|---|
| West Central North Dakota nonmetropolitan area | 250 | 4.47 | 2.07 | $39.76 | $82,700 |
| West South Dakota nonmetropolitan area | 260 | 4.32 | 2.01 | $30.92 | $64,300 |
| East Central North Dakota nonmetropolitan area | 170 | 4.29 | 1.99 | $30.73 | $63,930 |
| Central Nebraska nonmetropolitan area | 460 | 4.20 | 1.95 | $34.32 | $71,380 |
| Southwest Oklahoma nonmetropolitan area | 260 | 4.19 | 1.94 | $29.78 | $61,940 |
Top paying nonmetropolitan areas for this occupation:
| Nonmetropolitan area | Employment (1) | Employment per thousand jobs | Location quotient (9) | Hourly mean wage | Annual mean wage (2) |
|---|---|---|---|---|---|
| Northern New Hampshire nonmetropolitan area | 50 | 1.30 | 0.60 | $40.94 | $85,150 |
| Northern Mountains Region of California nonmetropolitan area | 70 | 1.04 | 0.48 | $40.82 | $84,900 |
| Southwest Wyoming nonmetropolitan area | 90 | 1.44 | 0.67 | $40.77 | $84,790 |
| West Central North Dakota nonmetropolitan area | 250 | 4.47 | 2.07 | $39.76 | $82,700 |
| Southside Virginia nonmetropolitan area | 110 | 1.00 | 0.46 | $39.59 | $82,350 |
These estimates are calculated with data collected from employers in all industry sectors, all metropolitan and nonmetropolitan areas, and all states and the District of Columbia. The top employment and wage figures are provided above. The complete list is available in the downloadable XLS files.
The percentile wage estimate is the value of a wage below which a certain percent of workers fall. The median wage is the 50th percentile wage estimate--50 percent of workers earn less than the median and 50 percent of workers earn more than the median. More about percentile wages.
(1) Estimates for detailed occupations do not sum to the totals because the totals include occupations not shown separately. Estimates do not include self-employed workers.
(2) Annual wages have been calculated by multiplying the hourly mean wage by a "year-round, full-time" hours figure of 2,080 hours; for those occupations where there is not an hourly wage published, the annual wage has been directly calculated from the reported survey data.
(3) The relative standard error (RSE) is a measure of the reliability of a survey statistic. The smaller the relative standard error, the more precise the estimate.
(7) The value is less than .005 percent of industry employment.
(8) Estimate not released.
(9) The location quotient is the ratio of the area concentration of occupational employment to the national average concentration. A location quotient greater than one indicates the occupation has a higher share of employment than average, and a location quotient less than one indicates the occupation is less prevalent in the area than average.
Other OES estimates and related information:
May 2017 National Occupational Employment and Wage Estimates
May 2017 State Occupational Employment and Wage Estimates
May 2017 Metropolitan and Nonmetropolitan Area Occupational Employment and Wage Estimates
May 2017 National Industry-Specific Occupational Employment and Wage Estimates
Last Modified Date: March 30, 2018