
An official website of the United States government
An official website of the United States government
The .gov means it's official.
Federal government websites often end in .gov or .mil. Before sharing sensitive information,
make sure you're on a federal government site.
The site is secure.
The
https:// ensures that you are connecting to the official website and that any
information you provide is encrypted and transmitted securely.
Physicians who diagnose, treat, and help prevent diseases and injuries that commonly occur in the general population. May refer patients to specialists when needed for further diagnosis or treatment.
Employment estimate and mean wage estimates for this occupation:
| Employment (1) | Employment RSE (3) |
Mean hourly wage |
Mean annual wage (2) |
Wage RSE (3) |
|---|---|---|---|---|
| 126,440 | 2.0 % | $100.27 | $208,560 | 1.0 % |
Percentile wage estimates for this occupation:
| Percentile | 10% | 25% | 50% (Median) |
75% | 90% |
|---|---|---|---|---|---|
| Hourly Wage | $35.21 | $66.39 | $95.55 | (5) | (5) |
| Annual Wage (2) | $73,240 | $138,100 | $198,740 | (5) | (5) |
Industries with the highest published employment and wages for this occupation are provided. For a list of all industries with employment in this occupation, see the Create Customized Tables function.
Industries with the highest levels of employment in this occupation:
| Industry | Employment (1) | Percent of industry employment | Hourly mean wage | Annual mean wage (2) |
|---|---|---|---|---|
| Offices of Physicians | 83,320 | 3.27 | $102.73 | $213,670 |
| General Medical and Surgical Hospitals | 22,620 | 0.41 | $97.66 | $203,140 |
| Outpatient Care Centers | 9,440 | 1.07 | $102.84 | $213,900 |
| Colleges, Universities, and Professional Schools | 3,820 | 0.13 | $57.35 | $119,280 |
| Local Government, excluding schools and hospitals (OES Designation) | 1,510 | 0.03 | $98.21 | $204,280 |
Industries with the highest concentration of employment in this occupation:
| Industry | Employment (1) | Percent of industry employment | Hourly mean wage | Annual mean wage (2) |
|---|---|---|---|---|
| Offices of Physicians | 83,320 | 3.27 | $102.73 | $213,670 |
| Outpatient Care Centers | 9,440 | 1.07 | $102.84 | $213,900 |
| General Medical and Surgical Hospitals | 22,620 | 0.41 | $97.66 | $203,140 |
| Psychiatric and Substance Abuse Hospitals | 560 | 0.24 | $95.97 | $199,620 |
| Colleges, Universities, and Professional Schools | 3,820 | 0.13 | $57.35 | $119,280 |
Top paying industries for this occupation:
| Industry | Employment (1) | Percent of industry employment | Hourly mean wage | Annual mean wage (2) |
|---|---|---|---|---|
| Specialty (except Psychiatric and Substance Abuse) Hospitals | 190 | 0.07 | $112.63 | $234,270 |
| Medical and Diagnostic Laboratories | 90 | 0.03 | $112.48 | $233,950 |
| Residential Intellectual and Developmental Disability, Mental Health, and Substance Abuse Facilities | 50 | 0.01 | $112.11 | $233,200 |
| Management of Companies and Enterprises | 150 | 0.01 | $111.78 | $232,510 |
| Management, Scientific, and Technical Consulting Services | 90 | 0.01 | $106.36 | $221,220 |
States and areas with the highest published employment, location quotients, and wages for this occupation are provided. For a list of all areas with employment in this occupation, see the Create Customized Tables function.
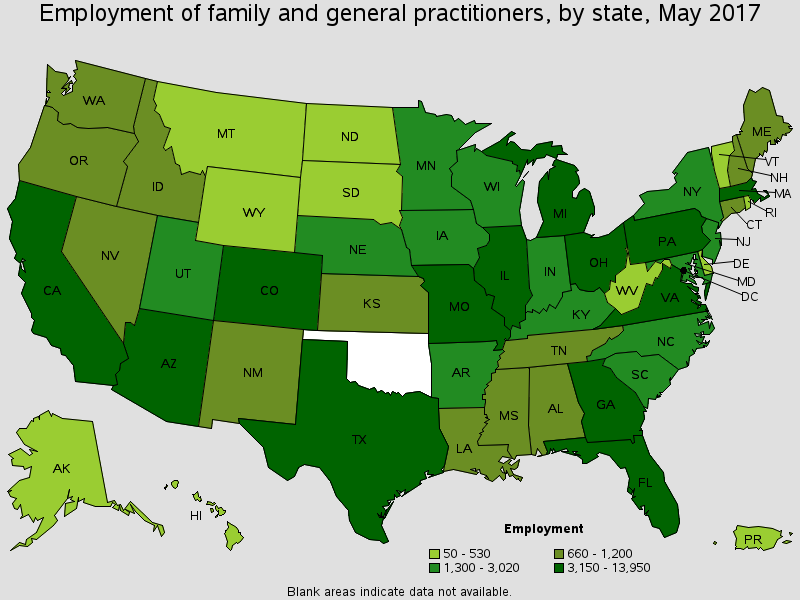
States with the highest employment level in this occupation:
| State | Employment (1) | Employment per thousand jobs | Location quotient (9) | Hourly mean wage | Annual mean wage (2) |
|---|---|---|---|---|---|
| California | 13,950 | 0.84 | 0.94 | $94.32 | $196,180 |
| Florida | 12,710 | 1.51 | 1.70 | $103.51 | $215,300 |
| Illinois | 9,160 | 1.54 | 1.74 | $105.91 | $220,290 |
| Texas | 7,910 | 0.67 | 0.75 | $98.39 | $204,660 |
| Missouri | 5,280 | 1.89 | 2.14 | $83.14 | $172,940 |
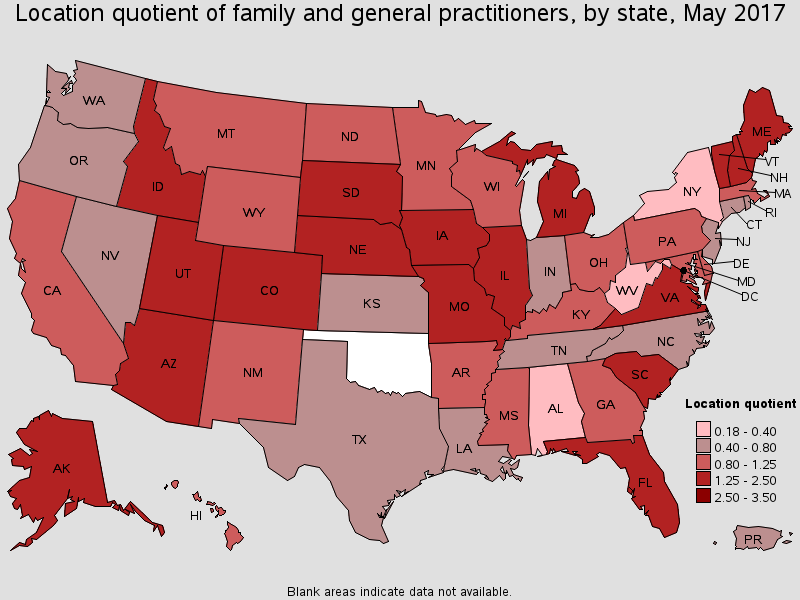
States with the highest concentration of jobs and location quotients in this occupation:
| State | Employment (1) | Employment per thousand jobs | Location quotient (9) | Hourly mean wage | Annual mean wage (2) |
|---|---|---|---|---|---|
| Missouri | 5,280 | 1.89 | 2.14 | $83.14 | $172,940 |
| Nebraska | 1,680 | 1.73 | 1.95 | $109.15 | $227,020 |
| Illinois | 9,160 | 1.54 | 1.74 | $105.91 | $220,290 |
| Idaho | 1,060 | 1.54 | 1.73 | $106.03 | $220,550 |
| Florida | 12,710 | 1.51 | 1.70 | $103.51 | $215,300 |
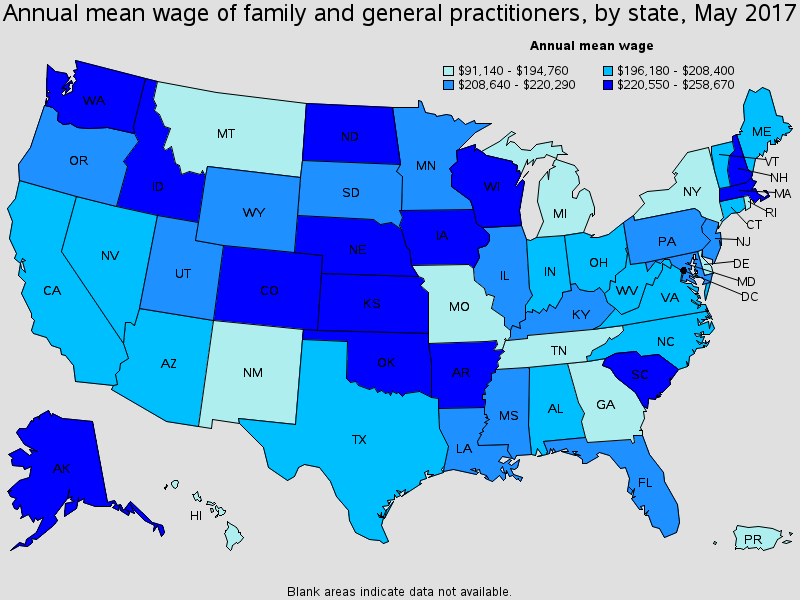
Top paying States for this occupation:
| State | Employment (1) | Employment per thousand jobs | Location quotient (9) | Hourly mean wage | Annual mean wage (2) |
|---|---|---|---|---|---|
| New Hampshire | 910 | 1.41 | 1.58 | $124.36 | $258,670 |
| Wisconsin | 2,420 | 0.86 | 0.96 | $116.51 | $242,340 |
| Iowa | 1,840 | 1.20 | 1.35 | $116.23 | $241,760 |
| South Carolina | 2,670 | 1.33 | 1.50 | $112.70 | $234,420 |
| Washington | 1,200 | 0.38 | 0.42 | $110.73 | $230,330 |
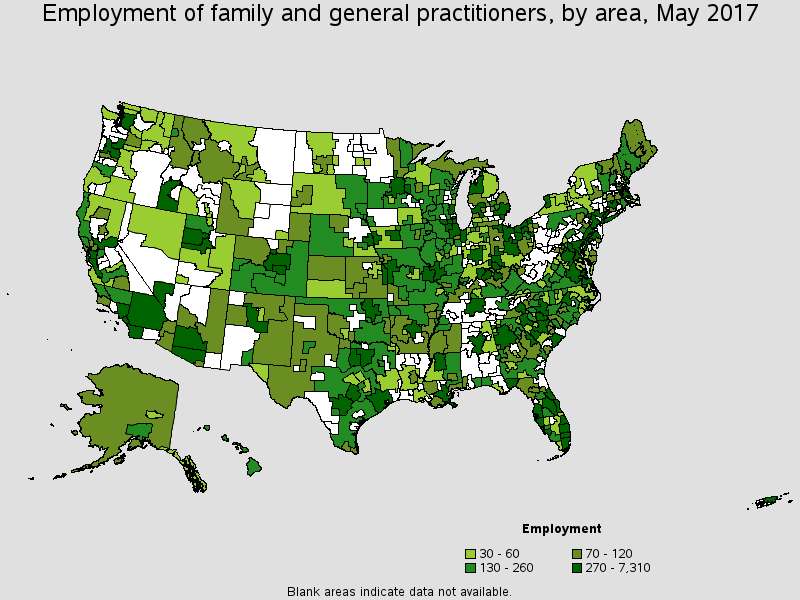
Metropolitan areas with the highest employment level in this occupation:
| Metropolitan area | Employment (1) | Employment per thousand jobs | Location quotient (9) | Hourly mean wage | Annual mean wage (2) |
|---|---|---|---|---|---|
| Chicago-Naperville-Arlington Heights, IL Metropolitan Division | 6,200 | 1.69 | 1.91 | $101.36 | $210,820 |
| Los Angeles-Long Beach-Glendale, CA Metropolitan Division | 4,440 | 1.00 | 1.13 | $86.25 | $179,400 |
| Houston-The Woodlands-Sugar Land, TX | 2,760 | 0.94 | 1.06 | $102.55 | $213,300 |
| St. Louis, MO-IL | 2,570 | 1.89 | 2.13 | $68.11 | $141,670 |
| Boston-Cambridge-Newton, MA NECTA Division | 2,500 | 1.36 | 1.53 | $104.78 | $217,940 |
| Phoenix-Mesa-Scottsdale, AZ | 2,330 | 1.18 | 1.33 | $96.32 | $200,340 |
| Atlanta-Sandy Springs-Roswell, GA | 1,880 | 0.72 | 0.81 | $97.17 | $202,100 |
| Tampa-St. Petersburg-Clearwater, FL | 1,850 | 1.44 | 1.63 | $108.25 | $225,160 |
| Washington-Arlington-Alexandria, DC-VA-MD-WV Metropolitan Division | 1,750 | 0.69 | 0.78 | $82.65 | $171,900 |
| Minneapolis-St. Paul-Bloomington, MN-WI | 1,740 | 0.90 | 1.01 | $103.07 | $214,390 |
Metropolitan areas with the highest concentration of jobs and location quotients in this occupation:
| Metropolitan area | Employment (1) | Employment per thousand jobs | Location quotient (9) | Hourly mean wage | Annual mean wage (2) |
|---|---|---|---|---|---|
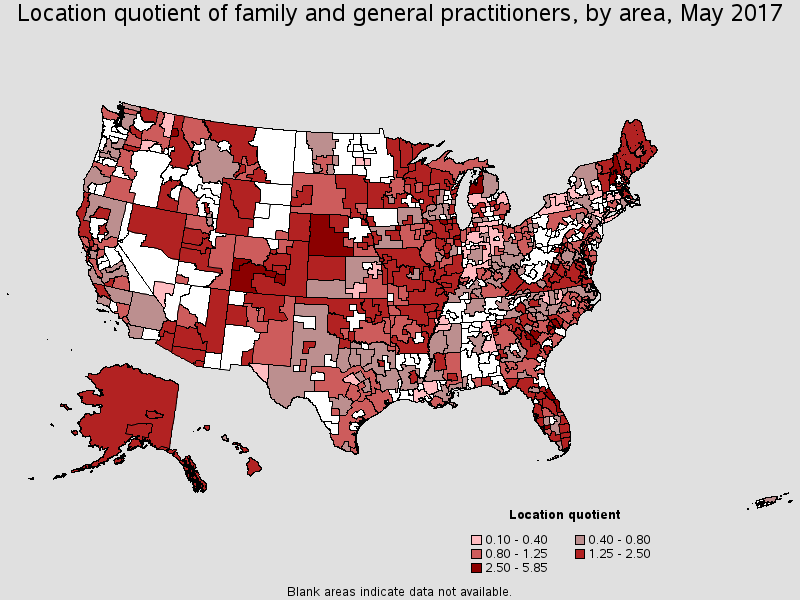
| Columbia, MO | 480 | 5.19 | 5.85 | $115.06 | $239,320 |
| Punta Gorda, FL | 170 | 3.60 | 4.06 | $93.56 | $194,600 |
| Coeur d'Alene, ID | 190 | 3.20 | 3.60 | $128.54 | $267,370 |
| Staunton-Waynesboro, VA | 150 | 3.17 | 3.57 | $114.01 | $237,130 |
| New Bedford, MA | 200 | 3.05 | 3.44 | $130.36 | $271,140 |
| Sumter, SC | 110 | 3.01 | 3.39 | $124.85 | $259,690 |
| Augusta-Richmond County, GA-SC | 630 | 2.87 | 3.23 | $60.19 | $125,190 |
| Florence, SC | 240 | 2.85 | 3.21 | $118.12 | $245,680 |
| Ames, IA | 130 | 2.85 | 3.22 | $132.48 | $275,550 |
| Palm Bay-Melbourne-Titusville, FL | 560 | 2.72 | 3.06 | $108.50 | $225,690 |
Top paying metropolitan areas for this occupation:
| Metropolitan area | Employment (1) | Employment per thousand jobs | Location quotient (9) | Hourly mean wage | Annual mean wage (2) |
|---|---|---|---|---|---|
| The Villages, FL | 30 | 1.28 | 1.45 | (5) | (5) |
| St. Joseph, MO-KS | 100 | 1.90 | 2.15 | (5) | (5) |
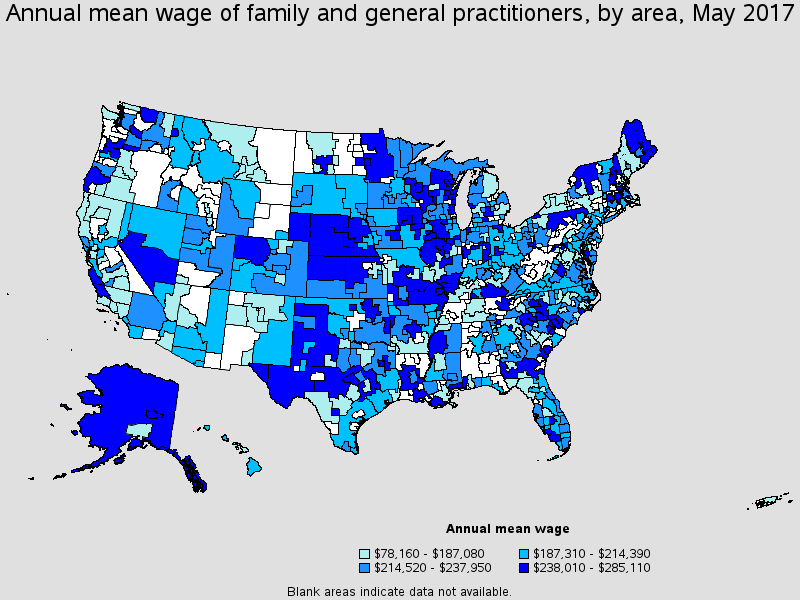
| Enid, OK | (8) | (8) | (8) | $137.07 | $285,110 |
| Longview, TX | (8) | (8) | (8) | $134.69 | $280,150 |
| Hilton Head Island-Bluffton-Beaufort, SC | 120 | 1.67 | 1.88 | $133.82 | $278,350 |
| Sebring, FL | (8) | (8) | (8) | $133.66 | $278,020 |
| Appleton, WI | (8) | (8) | (8) | $133.59 | $277,870 |
| Kankakee, IL | 110 | 2.55 | 2.87 | $133.24 | $277,140 |
| Portsmouth, NH-ME | 130 | 1.40 | 1.58 | $133.02 | $276,680 |
| Knoxville, TN | 140 | 0.37 | 0.42 | $132.54 | $275,680 |
Nonmetropolitan areas with the highest employment in this occupation:
| Nonmetropolitan area | Employment (1) | Employment per thousand jobs | Location quotient (9) | Hourly mean wage | Annual mean wage (2) |
|---|---|---|---|---|---|
| North Northeastern Ohio non-metropolitan area (non-contiguous) | 330 | 0.99 | 1.12 | $103.05 | $214,350 |
| Northwest Lower Peninsula of Michigan nonmetropolitan area | 270 | 2.23 | 2.51 | $107.10 | $222,770 |
| Southeast Missouri nonmetropolitan area | 260 | 1.60 | 1.80 | $115.81 | $240,880 |
| Central Missouri nonmetropolitan area | 260 | 1.61 | 1.82 | $115.81 | $240,880 |
| Central Nebraska nonmetropolitan area | 250 | 2.35 | 2.65 | $127.51 | $265,220 |
Nonmetropolitan areas with the highest concentration of jobs and location quotients in this occupation:
| Nonmetropolitan area | Employment (1) | Employment per thousand jobs | Location quotient (9) | Hourly mean wage | Annual mean wage (2) |
|---|---|---|---|---|---|
| West Central New Hampshire nonmetropolitan area | 200 | 3.06 | 3.45 | $127.98 | $266,210 |
| Northern New Hampshire nonmetropolitan area | 90 | 2.54 | 2.87 | $132.12 | $274,810 |
| Southwest Colorado nonmetropolitan area | 240 | 2.50 | 2.82 | $93.24 | $193,940 |
| Central Nebraska nonmetropolitan area | 250 | 2.35 | 2.65 | $127.51 | $265,220 |
| Northwest Lower Peninsula of Michigan nonmetropolitan area | 270 | 2.23 | 2.51 | $107.10 | $222,770 |
Top paying nonmetropolitan areas for this occupation:
| Nonmetropolitan area | Employment (1) | Employment per thousand jobs | Location quotient (9) | Hourly mean wage | Annual mean wage (2) |
|---|---|---|---|---|---|
| West Texas Region of Texas nonmetropolitan area | 80 | 0.39 | 0.44 | $134.51 | $279,780 |
| South Georgia nonmetropolitan area | 150 | 0.83 | 0.93 | $133.62 | $277,930 |
| Balance of Alaska nonmetropolitan area | 120 | 1.66 | 1.87 | $133.23 | $277,110 |
| Northeast Nebraska nonmetropolitan area | (8) | (8) | (8) | $132.66 | $275,930 |
| Northern New Hampshire nonmetropolitan area | 90 | 2.54 | 2.87 | $132.12 | $274,810 |
These estimates are calculated with data collected from employers in all industry sectors, all metropolitan and nonmetropolitan areas, and all states and the District of Columbia. The top employment and wage figures are provided above. The complete list is available in the downloadable XLS files.
The percentile wage estimate is the value of a wage below which a certain percent of workers fall. The median wage is the 50th percentile wage estimate--50 percent of workers earn less than the median and 50 percent of workers earn more than the median. More about percentile wages.
(1) Estimates for detailed occupations do not sum to the totals because the totals include occupations not shown separately. Estimates do not include self-employed workers.
(2) Annual wages have been calculated by multiplying the hourly mean wage by a "year-round, full-time" hours figure of 2,080 hours; for those occupations where there is not an hourly wage published, the annual wage has been directly calculated from the reported survey data.
(3) The relative standard error (RSE) is a measure of the reliability of a survey statistic. The smaller the relative standard error, the more precise the estimate.
(5) This wage is equal to or greater than $100.00 per hour or $208,000 per year.
(8) Estimate not released.
(9) The location quotient is the ratio of the area concentration of occupational employment to the national average concentration. A location quotient greater than one indicates the occupation has a higher share of employment than average, and a location quotient less than one indicates the occupation is less prevalent in the area than average.
Other OES estimates and related information:
May 2017 National Occupational Employment and Wage Estimates
May 2017 State Occupational Employment and Wage Estimates
May 2017 Metropolitan and Nonmetropolitan Area Occupational Employment and Wage Estimates
May 2017 National Industry-Specific Occupational Employment and Wage Estimates
Last Modified Date: March 30, 2018