
An official website of the United States government
An official website of the United States government
The .gov means it's official.
Federal government websites often end in .gov or .mil. Before sharing sensitive information,
make sure you're on a federal government site.
The site is secure.
The
https:// ensures that you are connecting to the official website and that any
information you provide is encrypted and transmitted securely.
All services sales representatives not listed separately.
Employment estimate and mean wage estimates for this occupation:
| Employment (1) | Employment RSE (3) |
Mean hourly wage |
Mean annual wage (2) |
Wage RSE (3) |
|---|---|---|---|---|
| 1,004,020 | 0.7 % | $30.31 | $63,050 | 0.4 % |
Percentile wage estimates for this occupation:
| Percentile | 10% | 25% | 50% (Median) |
75% | 90% |
|---|---|---|---|---|---|
| Hourly Wage | $12.16 | $16.94 | $25.24 | $36.95 | $54.47 |
| Annual Wage (2) | $25,290 | $35,240 | $52,510 | $76,850 | $113,310 |
Industries with the highest published employment and wages for this occupation are provided. For a list of all industries with employment in this occupation, see the Create Customized Tables function.
Industries with the highest levels of employment in this occupation:
| Industry | Employment (1) | Percent of industry employment | Hourly mean wage | Annual mean wage (2) |
|---|---|---|---|---|
| Electronics and Appliance Stores | 85,600 | 16.82 | $20.02 | $41,650 |
| Telecommunications | 76,340 | 9.77 | $30.27 | $62,960 |
| Computer Systems Design and Related Services | 65,610 | 3.26 | $38.67 | $80,430 |
| Management, Scientific, and Technical Consulting Services | 51,430 | 3.76 | $37.10 | $77,170 |
| Business Support Services | 35,650 | 3.91 | $24.95 | $51,890 |
Industries with the highest concentration of employment in this occupation:
| Industry | Employment (1) | Percent of industry employment | Hourly mean wage | Annual mean wage (2) |
|---|---|---|---|---|
| Electronics and Appliance Stores | 85,600 | 16.82 | $20.02 | $41,650 |
| Telecommunications | 76,340 | 9.77 | $30.27 | $62,960 |
| Lessors of Nonfinancial Intangible Assets (except Copyrighted Works) | 2,220 | 9.70 | $30.95 | $64,390 |
| Cable and Other Subscription Programming | 4,530 | 8.48 | $28.46 | $59,190 |
| Other Information Services | 22,980 | 8.31 | $36.35 | $75,610 |
Top paying industries for this occupation:
| Industry | Employment (1) | Percent of industry employment | Hourly mean wage | Annual mean wage (2) |
|---|---|---|---|---|
| Communications Equipment Manufacturing | 170 | 0.19 | $50.13 | $104,270 |
| Securities, Commodity Contracts, and Other Financial Investments and Related Activities | 4,090 | 0.45 | $49.30 | $102,550 |
| Pipeline Transportation of Crude Oil | (8) | (8) | $48.90 | $101,700 |
| Pipeline Transportation of Natural Gas | 70 | 0.24 | $48.73 | $101,360 |
| Aerospace Product and Parts Manufacturing | 140 | 0.03 | $46.41 | $96,530 |
States and areas with the highest published employment, location quotients, and wages for this occupation are provided. For a list of all areas with employment in this occupation, see the Create Customized Tables function.
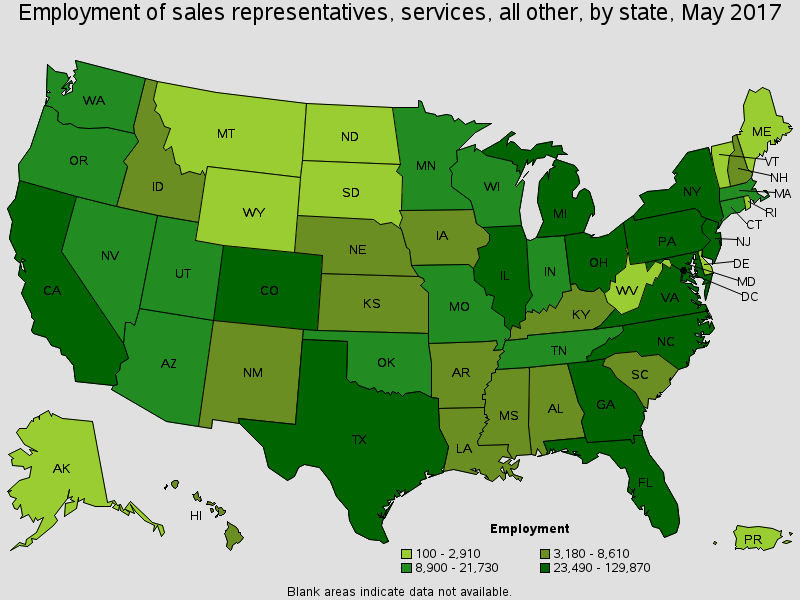
States with the highest employment level in this occupation:
| State | Employment (1) | Employment per thousand jobs | Location quotient (9) | Hourly mean wage | Annual mean wage (2) |
|---|---|---|---|---|---|
| California | 129,870 | 7.78 | 1.10 | $31.73 | $66,000 |
| Texas | 115,580 | 9.72 | 1.38 | $29.36 | $61,070 |
| Florida | 77,050 | 9.15 | 1.30 | $27.42 | $57,040 |
| New York | 68,000 | 7.38 | 1.05 | $36.23 | $75,360 |
| Illinois | 44,730 | 7.55 | 1.07 | $29.77 | $61,930 |
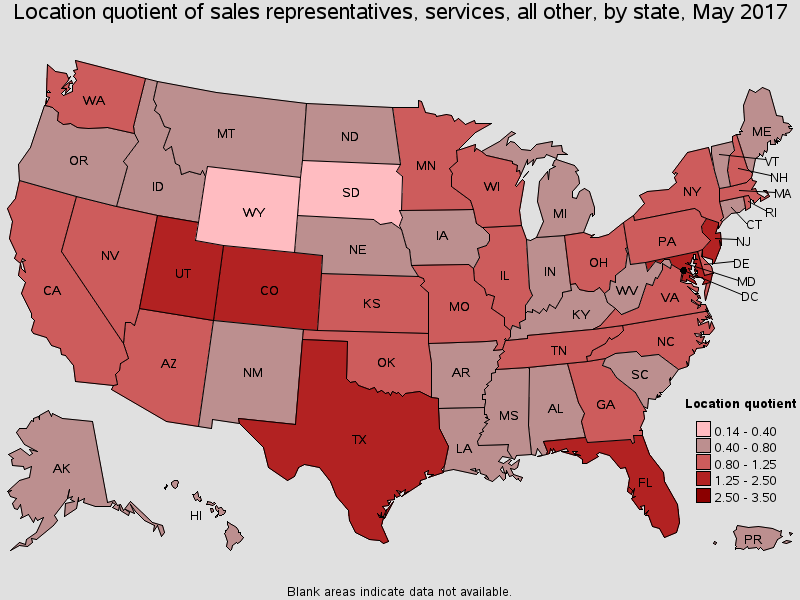
States with the highest concentration of jobs and location quotients in this occupation:
| State | Employment (1) | Employment per thousand jobs | Location quotient (9) | Hourly mean wage | Annual mean wage (2) |
|---|---|---|---|---|---|
| Colorado | 27,330 | 10.70 | 1.52 | $33.20 | $69,050 |
| Maryland | 27,240 | 10.23 | 1.45 | $34.39 | $71,530 |
| Texas | 115,580 | 9.72 | 1.38 | $29.36 | $61,070 |
| New Jersey | 38,210 | 9.53 | 1.35 | $37.50 | $78,010 |
| Florida | 77,050 | 9.15 | 1.30 | $27.42 | $57,040 |
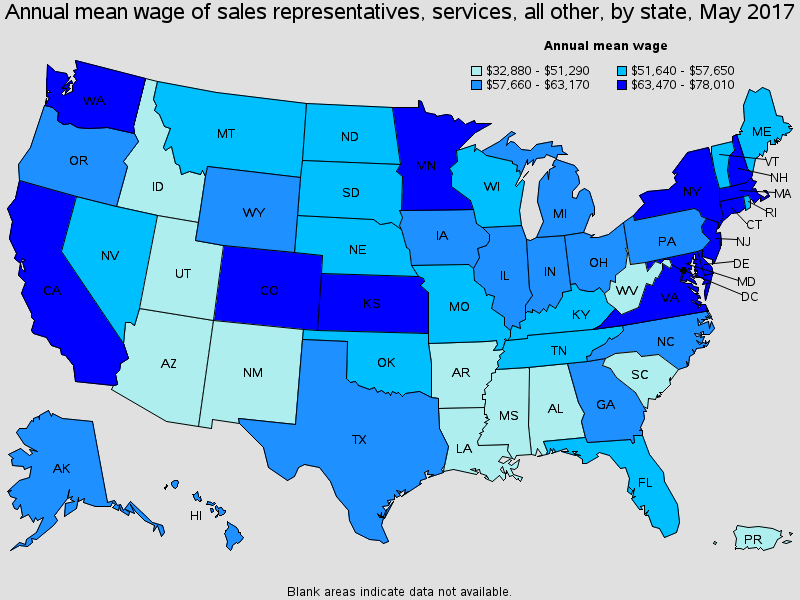
Top paying States for this occupation:
| State | Employment (1) | Employment per thousand jobs | Location quotient (9) | Hourly mean wage | Annual mean wage (2) |
|---|---|---|---|---|---|
| New Jersey | 38,210 | 9.53 | 1.35 | $37.50 | $78,010 |
| Virginia | 28,970 | 7.64 | 1.09 | $37.15 | $77,270 |
| District of Columbia | 3,670 | 5.18 | 0.74 | $36.43 | $75,770 |
| New York | 68,000 | 7.38 | 1.05 | $36.23 | $75,360 |
| Massachusetts | 20,240 | 5.74 | 0.81 | $35.68 | $74,220 |
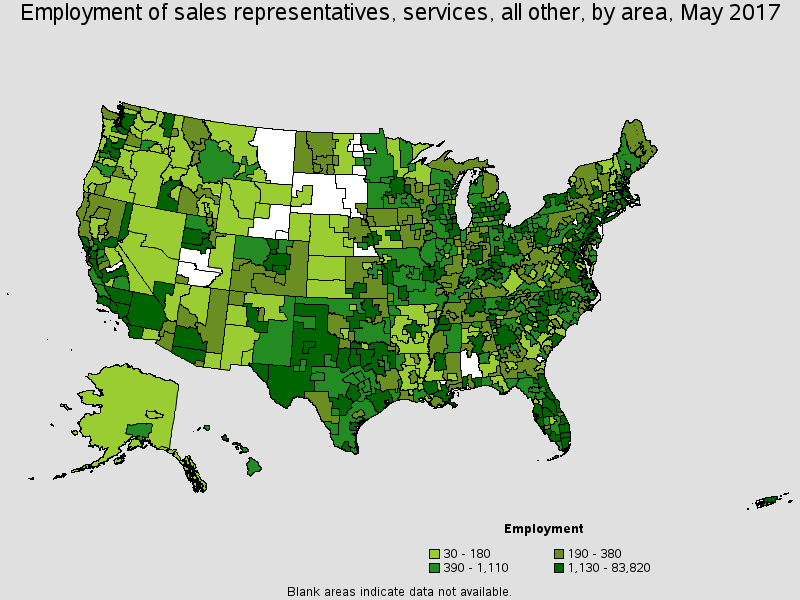
Metropolitan areas with the highest employment level in this occupation:
| Metropolitan area | Employment (1) | Employment per thousand jobs | Location quotient (9) | Hourly mean wage | Annual mean wage (2) |
|---|---|---|---|---|---|
| New York-Jersey City-White Plains, NY-NJ Metropolitan Division | 60,300 | 9.01 | 1.28 | $38.94 | $80,990 |
| Chicago-Naperville-Arlington Heights, IL Metropolitan Division | 33,530 | 9.16 | 1.30 | $31.24 | $64,980 |
| Los Angeles-Long Beach-Glendale, CA Metropolitan Division | 31,300 | 7.06 | 1.00 | $29.84 | $62,080 |
| Houston-The Woodlands-Sugar Land, TX | 31,030 | 10.59 | 1.50 | $31.60 | $65,720 |
| Dallas-Plano-Irving, TX Metropolitan Division | 29,780 | 11.95 | 1.70 | $31.63 | $65,790 |
| Atlanta-Sandy Springs-Roswell, GA | 26,170 | 9.99 | 1.42 | $29.34 | $61,030 |
| Washington-Arlington-Alexandria, DC-VA-MD-WV Metropolitan Division | 23,720 | 9.42 | 1.34 | $39.80 | $82,790 |
| Denver-Aurora-Lakewood, CO | 18,860 | 13.07 | 1.86 | $33.97 | $70,670 |
| Minneapolis-St. Paul-Bloomington, MN-WI | 17,170 | 8.89 | 1.26 | $31.62 | $65,770 |
| San Jose-Sunnyvale-Santa Clara, CA | 16,020 | 14.71 | 2.09 | $38.38 | $79,830 |
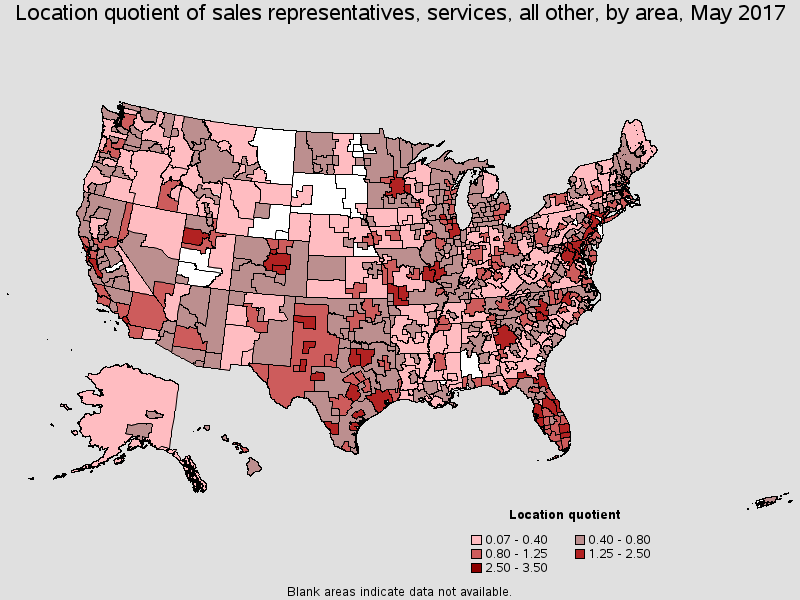
Metropolitan areas with the highest concentration of jobs and location quotients in this occupation:
| Metropolitan area | Employment (1) | Employment per thousand jobs | Location quotient (9) | Hourly mean wage | Annual mean wage (2) |
|---|---|---|---|---|---|
| San Jose-Sunnyvale-Santa Clara, CA | 16,020 | 14.71 | 2.09 | $38.38 | $79,830 |
| San Francisco-Redwood City-South San Francisco, CA Metropolitan Division | 15,240 | 13.65 | 1.94 | $39.70 | $82,570 |
| Austin-Round Rock, TX | 13,120 | 13.16 | 1.87 | $26.18 | $54,450 |
| Denver-Aurora-Lakewood, CO | 18,860 | 13.07 | 1.86 | $33.97 | $70,670 |
| Salt Lake City, UT | 8,710 | 12.54 | 1.78 | $23.15 | $48,150 |
| Boulder, CO | 2,180 | 12.22 | 1.73 | $30.77 | $64,000 |
| San Angelo, TX | 550 | 12.00 | 1.70 | $21.59 | $44,910 |
| Dallas-Plano-Irving, TX Metropolitan Division | 29,780 | 11.95 | 1.70 | $31.63 | $65,790 |
| Fort Lauderdale-Pompano Beach-Deerfield Beach, FL Metropolitan Division | 9,760 | 11.92 | 1.69 | $27.53 | $57,260 |
| Raleigh, NC | 7,210 | 11.88 | 1.69 | $27.83 | $57,880 |
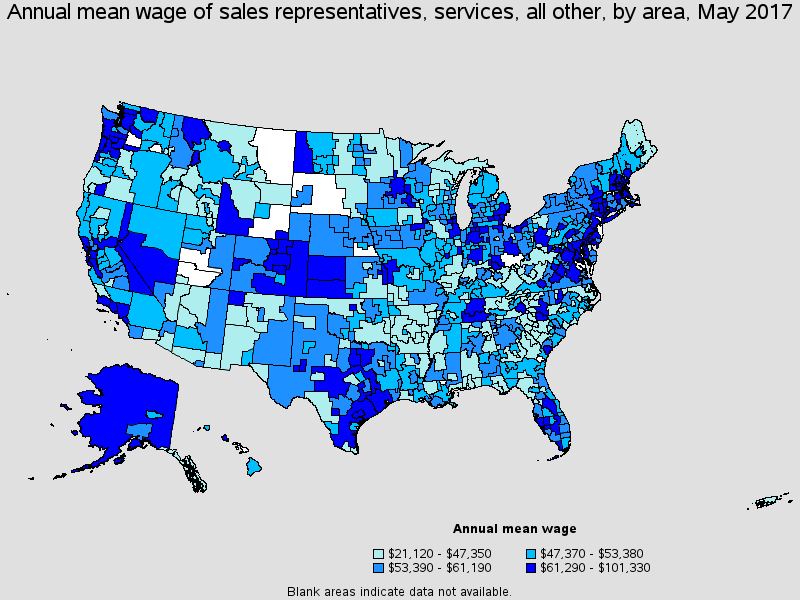
Top paying metropolitan areas for this occupation:
| Metropolitan area | Employment (1) | Employment per thousand jobs | Location quotient (9) | Hourly mean wage | Annual mean wage (2) |
|---|---|---|---|---|---|
| California-Lexington Park, MD | 250 | 5.51 | 0.78 | $48.72 | $101,330 |
| Grand Junction, CO | 270 | 4.58 | 0.65 | $47.80 | $99,410 |
| Bridgeport-Stamford-Norwalk, CT | 2,750 | 6.62 | 0.94 | $45.04 | $93,680 |
| Silver Spring-Frederick-Rockville, MD Metropolitan Division | 6,810 | 11.65 | 1.65 | $40.99 | $85,260 |
| Washington-Arlington-Alexandria, DC-VA-MD-WV Metropolitan Division | 23,720 | 9.42 | 1.34 | $39.80 | $82,790 |
| San Francisco-Redwood City-South San Francisco, CA Metropolitan Division | 15,240 | 13.65 | 1.94 | $39.70 | $82,570 |
| Haverhill-Newburyport-Amesbury Town, MA-NH NECTA Division | 330 | 4.95 | 0.70 | $39.02 | $81,160 |
| Newark, NJ-PA Metropolitan Division | 12,300 | 10.54 | 1.50 | $38.95 | $81,010 |
| New York-Jersey City-White Plains, NY-NJ Metropolitan Division | 60,300 | 9.01 | 1.28 | $38.94 | $80,990 |
| Portsmouth, NH-ME | 670 | 7.31 | 1.04 | $38.68 | $80,460 |
Nonmetropolitan areas with the highest employment in this occupation:
| Nonmetropolitan area | Employment (1) | Employment per thousand jobs | Location quotient (9) | Hourly mean wage | Annual mean wage (2) |
|---|---|---|---|---|---|
| West Texas Region of Texas nonmetropolitan area | 1,180 | 6.15 | 0.87 | $29.06 | $60,440 |
| North Texas Region of Texas nonmetropolitan area | 1,160 | 4.31 | 0.61 | $26.81 | $55,770 |
| North Northeastern Ohio non-metropolitan area (non-contiguous) | 1,050 | 3.17 | 0.45 | $26.37 | $54,850 |
| Hill Country Region of Texas nonmetropolitan area | 1,000 | 5.20 | 0.74 | $33.30 | $69,260 |
| Piedmont North Carolina nonmetropolitan area | 990 | 3.85 | 0.55 | $21.86 | $45,460 |
Nonmetropolitan areas with the highest concentration of jobs and location quotients in this occupation:
| Nonmetropolitan area | Employment (1) | Employment per thousand jobs | Location quotient (9) | Hourly mean wage | Annual mean wage (2) |
|---|---|---|---|---|---|
| Southwest Missouri nonmetropolitan area | 700 | 9.60 | 1.36 | $21.04 | $43,750 |
| South Florida nonmetropolitan area | 500 | 6.46 | 0.92 | $30.10 | $62,600 |
| West Texas Region of Texas nonmetropolitan area | 1,180 | 6.15 | 0.87 | $29.06 | $60,440 |
| Wasatch Back nonmetropolitan area | 190 | 5.62 | 0.80 | $17.83 | $37,080 |
| Northwest Colorado nonmetropolitan area | 620 | 5.32 | 0.76 | $27.94 | $58,110 |
Top paying nonmetropolitan areas for this occupation:
| Nonmetropolitan area | Employment (1) | Employment per thousand jobs | Location quotient (9) | Hourly mean wage | Annual mean wage (2) |
|---|---|---|---|---|---|
| Nantucket Island and Martha's Vineyard nonmetropolitan area | (8) | (8) | (8) | $40.34 | $83,910 |
| Southwest New Hampshire nonmetropolitan area | 140 | 3.68 | 0.52 | $39.68 | $82,540 |
| Central Washington nonmetropolitan area | 100 | 2.96 | 0.42 | $39.14 | $81,410 |
| Connecticut nonmetropolitan area | 70 | 2.23 | 0.32 | $35.53 | $73,890 |
| West Central New Hampshire nonmetropolitan area | 160 | 2.46 | 0.35 | $35.31 | $73,450 |
These estimates are calculated with data collected from employers in all industry sectors, all metropolitan and nonmetropolitan areas, and all states and the District of Columbia. The top employment and wage figures are provided above. The complete list is available in the downloadable XLS files.
The percentile wage estimate is the value of a wage below which a certain percent of workers fall. The median wage is the 50th percentile wage estimate--50 percent of workers earn less than the median and 50 percent of workers earn more than the median. More about percentile wages.
(1) Estimates for detailed occupations do not sum to the totals because the totals include occupations not shown separately. Estimates do not include self-employed workers.
(2) Annual wages have been calculated by multiplying the hourly mean wage by a "year-round, full-time" hours figure of 2,080 hours; for those occupations where there is not an hourly wage published, the annual wage has been directly calculated from the reported survey data.
(3) The relative standard error (RSE) is a measure of the reliability of a survey statistic. The smaller the relative standard error, the more precise the estimate.
(8) Estimate not released.
(9) The location quotient is the ratio of the area concentration of occupational employment to the national average concentration. A location quotient greater than one indicates the occupation has a higher share of employment than average, and a location quotient less than one indicates the occupation is less prevalent in the area than average.
Other OES estimates and related information:
May 2017 National Occupational Employment and Wage Estimates
May 2017 State Occupational Employment and Wage Estimates
May 2017 Metropolitan and Nonmetropolitan Area Occupational Employment and Wage Estimates
May 2017 National Industry-Specific Occupational Employment and Wage Estimates
Last Modified Date: March 30, 2018