
An official website of the United States government
An official website of the United States government
The .gov means it's official.
Federal government websites often end in .gov or .mil. Before sharing sensitive information,
make sure you're on a federal government site.
The site is secure.
The
https:// ensures that you are connecting to the official website and that any
information you provide is encrypted and transmitted securely.
All office and administrative support workers not listed separately.
Employment estimate and mean wage estimates for this occupation:
| Employment (1) | Employment RSE (3) |
Mean hourly wage |
Mean annual wage (2) |
Wage RSE (3) |
|---|---|---|---|---|
| 209,070 | 1.3 % | $17.96 | $37,360 | 0.6 % |
Percentile wage estimates for this occupation:
| Percentile | 10% | 25% | 50% (Median) |
75% | 90% |
|---|---|---|---|---|---|
| Hourly Wage | $10.22 | $12.67 | $17.11 | $21.74 | $27.24 |
| Annual Wage (2) | $21,260 | $26,350 | $35,590 | $45,230 | $56,660 |
Industries with the highest published employment and wages for this occupation are provided. For a list of all industries with employment in this occupation, see the Create Customized Tables function.
Industries with the highest levels of employment in this occupation:
| Industry | Employment (1) | Percent of industry employment | Hourly mean wage | Annual mean wage (2) |
|---|---|---|---|---|
| Local Government, excluding schools and hospitals (OES Designation) | 29,870 | 0.55 | $16.74 | $34,810 |
| Colleges, Universities, and Professional Schools | 23,810 | 0.79 | $16.97 | $35,300 |
| Federal Executive Branch (OES Designation) | 12,320 | 0.61 | $21.31 | $44,330 |
| Elementary and Secondary Schools | 11,760 | 0.14 | $15.56 | $32,370 |
| Junior Colleges | 11,100 | 1.51 | $15.95 | $33,180 |
Industries with the highest concentration of employment in this occupation:
| Industry | Employment (1) | Percent of industry employment | Hourly mean wage | Annual mean wage (2) |
|---|---|---|---|---|
| Junior Colleges | 11,100 | 1.51 | $15.95 | $33,180 |
| Colleges, Universities, and Professional Schools | 23,810 | 0.79 | $16.97 | $35,300 |
| Federal Executive Branch (OES Designation) | 12,320 | 0.61 | $21.31 | $44,330 |
| Community Food and Housing, and Emergency and Other Relief Services | 1,010 | 0.60 | $16.15 | $33,590 |
| Local Government, excluding schools and hospitals (OES Designation) | 29,870 | 0.55 | $16.74 | $34,810 |
Top paying industries for this occupation:
| Industry | Employment (1) | Percent of industry employment | Hourly mean wage | Annual mean wage (2) |
|---|---|---|---|---|
| Aerospace Product and Parts Manufacturing | 250 | 0.05 | $26.74 | $55,620 |
| Water, Sewage and Other Systems | 30 | 0.07 | $25.97 | $54,020 |
| Electric Power Generation, Transmission and Distribution | 370 | 0.10 | $25.95 | $53,970 |
| Converted Paper Product Manufacturing | 70 | 0.02 | $25.63 | $53,310 |
| Foundries | 30 | 0.03 | $24.42 | $50,800 |
States and areas with the highest published employment, location quotients, and wages for this occupation are provided. For a list of all areas with employment in this occupation, see the Create Customized Tables function.
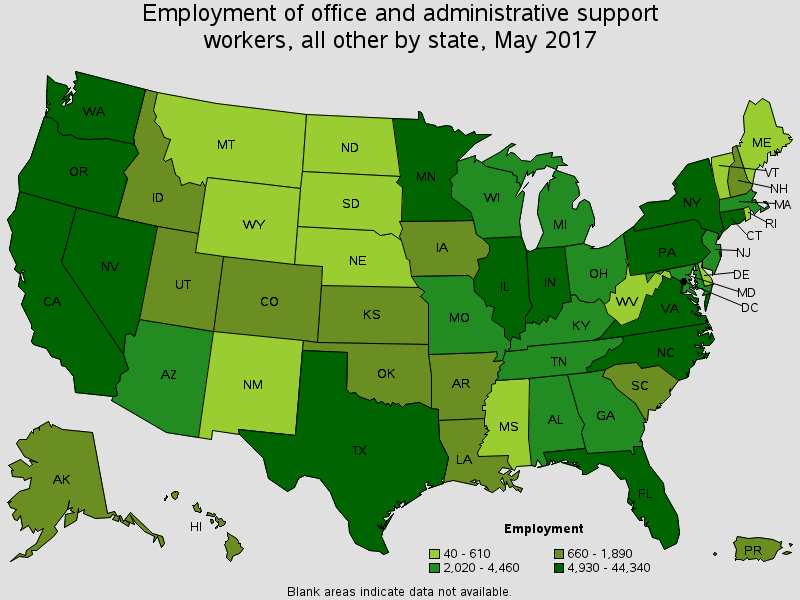
States with the highest employment level in this occupation:
| State | Employment (1) | Employment per thousand jobs | Location quotient (9) | Hourly mean wage | Annual mean wage (2) |
|---|---|---|---|---|---|
| California | 44,340 | 2.66 | 1.81 | $17.36 | $36,110 |
| New York | 16,490 | 1.79 | 1.22 | $18.77 | $39,050 |
| Florida | 9,940 | 1.18 | 0.80 | $18.95 | $39,420 |
| Illinois | 9,750 | 1.65 | 1.12 | $19.07 | $39,670 |
| Nevada | 7,850 | 5.99 | 4.09 | $14.10 | $29,330 |
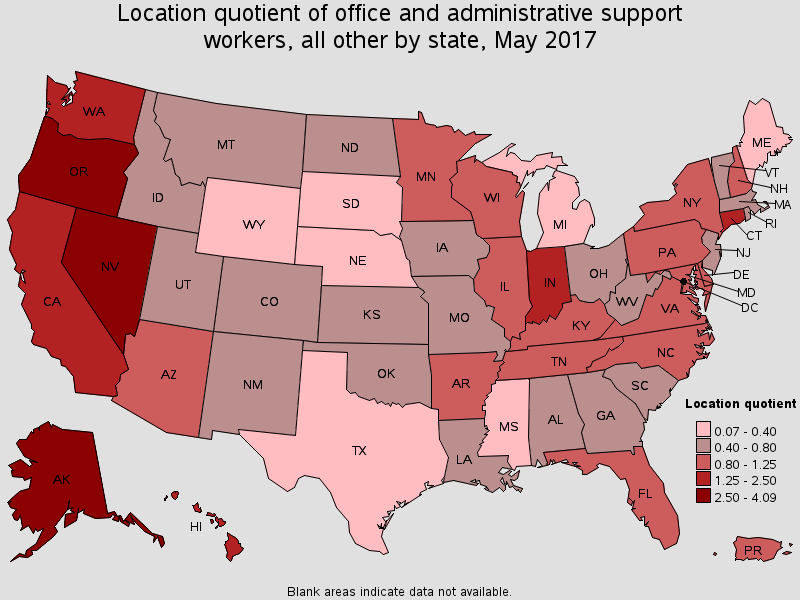
States with the highest concentration of jobs and location quotients in this occupation:
| State | Employment (1) | Employment per thousand jobs | Location quotient (9) | Hourly mean wage | Annual mean wage (2) |
|---|---|---|---|---|---|
| Nevada | 7,850 | 5.99 | 4.09 | $14.10 | $29,330 |
| Alaska | 1,280 | 4.03 | 2.75 | $23.80 | $49,500 |
| Oregon | 7,200 | 3.94 | 2.68 | $17.61 | $36,630 |
| Connecticut | 5,900 | 3.57 | 2.43 | $14.63 | $30,420 |
| District of Columbia | 2,510 | 3.54 | 2.41 | $23.45 | $48,770 |
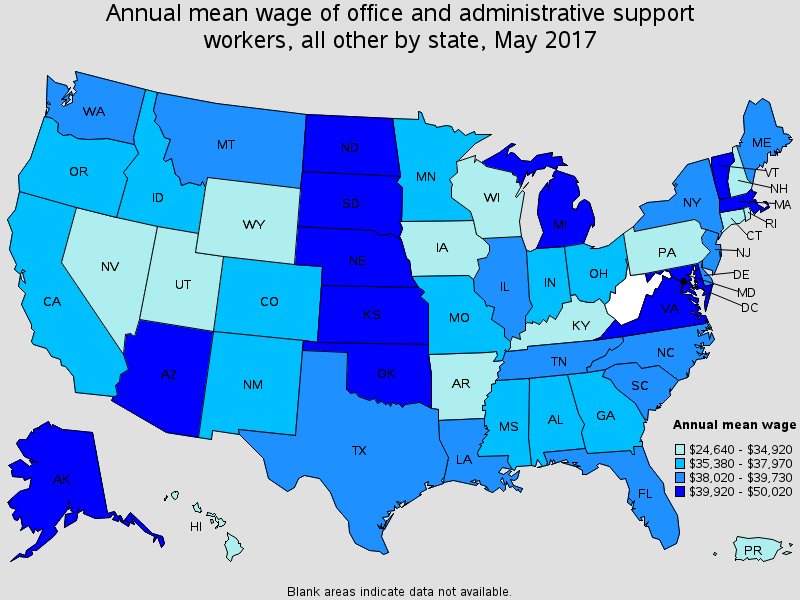
Top paying States for this occupation:
| State | Employment (1) | Employment per thousand jobs | Location quotient (9) | Hourly mean wage | Annual mean wage (2) |
|---|---|---|---|---|---|
| Massachusetts | 2,570 | 0.73 | 0.50 | $24.05 | $50,020 |
| Alaska | 1,280 | 4.03 | 2.75 | $23.80 | $49,500 |
| District of Columbia | 2,510 | 3.54 | 2.41 | $23.45 | $48,770 |
| Michigan | 2,160 | 0.51 | 0.34 | $22.50 | $46,790 |
| Vermont | 210 | 0.68 | 0.47 | $22.35 | $46,500 |
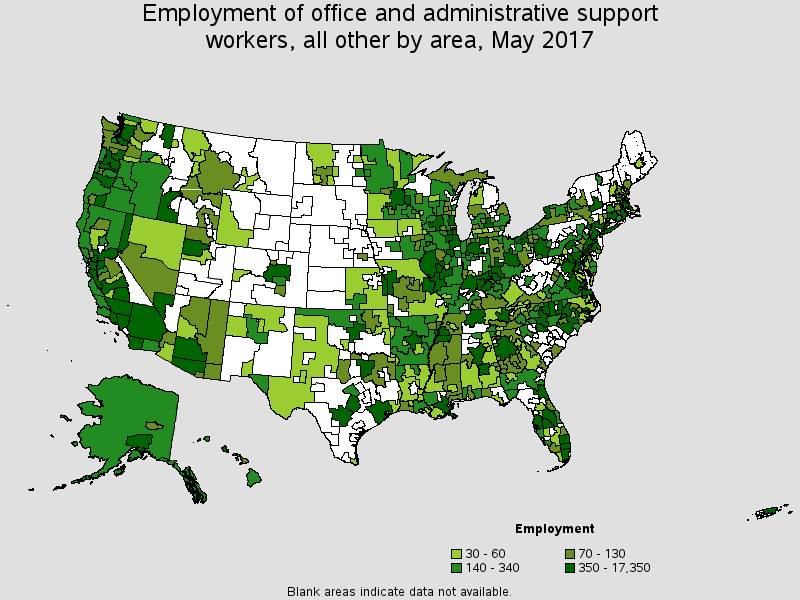
Metropolitan areas with the highest employment level in this occupation:
| Metropolitan area | Employment (1) | Employment per thousand jobs | Location quotient (9) | Hourly mean wage | Annual mean wage (2) |
|---|---|---|---|---|---|
| New York-Jersey City-White Plains, NY-NJ Metropolitan Division | 15,030 | 2.24 | 1.53 | $18.53 | $38,540 |
| Los Angeles-Long Beach-Glendale, CA Metropolitan Division | 11,530 | 2.60 | 1.77 | $17.87 | $37,170 |
| Las Vegas-Henderson-Paradise, NV | 6,850 | 7.11 | 4.85 | $13.71 | $28,520 |
| Chicago-Naperville-Arlington Heights, IL Metropolitan Division | 5,470 | 1.49 | 1.02 | $19.74 | $41,060 |
| Washington-Arlington-Alexandria, DC-VA-MD-WV Metropolitan Division | 4,470 | 1.77 | 1.21 | $22.79 | $47,400 |
| Portland-Vancouver-Hillsboro, OR-WA | 4,410 | 3.81 | 2.60 | $18.44 | $38,360 |
| San Diego-Carlsbad, CA | 3,890 | 2.71 | 1.85 | $15.85 | $32,960 |
| Minneapolis-St. Paul-Bloomington, MN-WI | 3,770 | 1.95 | 1.33 | $17.60 | $36,610 |
| Seattle-Bellevue-Everett, WA Metropolitan Division | 3,640 | 2.21 | 1.51 | $19.80 | $41,180 |
| Riverside-San Bernardino-Ontario, CA | 3,440 | 2.40 | 1.64 | $14.88 | $30,940 |
Metropolitan areas with the highest concentration of jobs and location quotients in this occupation:
| Metropolitan area | Employment (1) | Employment per thousand jobs | Location quotient (9) | Hourly mean wage | Annual mean wage (2) |
|---|---|---|---|---|---|
| Las Vegas-Henderson-Paradise, NV | 6,850 | 7.11 | 4.85 | $13.71 | $28,520 |
| Carson City, NV | 150 | 5.36 | 3.65 | $16.03 | $33,340 |
| Albany, OR | 220 | 5.26 | 3.58 | $15.78 | $32,830 |
| Salem, OR | 830 | 4.99 | 3.40 | $15.63 | $32,510 |
| Medford, OR | 420 | 4.95 | 3.37 | $15.79 | $32,840 |
| Lansing-East Lansing, MI | 980 | 4.58 | 3.12 | $24.47 | $50,890 |
| Anchorage, AK | 760 | 4.39 | 3.00 | $23.69 | $49,270 |
| Hartford-West Hartford-East Hartford, CT | 2,280 | 3.93 | 2.68 | $16.24 | $33,780 |
| Portland-Vancouver-Hillsboro, OR-WA | 4,410 | 3.81 | 2.60 | $18.44 | $38,360 |
| Eugene, OR | 580 | 3.81 | 2.60 | $17.96 | $37,370 |
Top paying metropolitan areas for this occupation:
| Metropolitan area | Employment (1) | Employment per thousand jobs | Location quotient (9) | Hourly mean wage | Annual mean wage (2) |
|---|---|---|---|---|---|
| Lowell-Billerica-Chelmsford, MA-NH NECTA Division | 50 | 0.31 | 0.21 | $28.01 | $58,260 |
| Framingham, MA NECTA Division | 280 | 1.60 | 1.09 | $25.68 | $53,410 |
| Boston-Cambridge-Newton, MA NECTA Division | 1,740 | 0.95 | 0.64 | $25.18 | $52,370 |
| Muncie, IN | (8) | (8) | (8) | $25.09 | $52,190 |
| Lansing-East Lansing, MI | 980 | 4.58 | 3.12 | $24.47 | $50,890 |
| Fairbanks, AK | 130 | 3.57 | 2.44 | $24.07 | $50,070 |
| Wilmington, NC | 210 | 1.70 | 1.16 | $24.05 | $50,020 |
| Detroit-Dearborn-Livonia, MI Metropolitan Division | 230 | 0.31 | 0.21 | $23.98 | $49,870 |
| Waterloo-Cedar Falls, IA | (8) | (8) | (8) | $23.87 | $49,660 |
| Syracuse, NY | 300 | 0.99 | 0.68 | $23.70 | $49,300 |
Nonmetropolitan areas with the highest employment in this occupation:
| Nonmetropolitan area | Employment (1) | Employment per thousand jobs | Location quotient (9) | Hourly mean wage | Annual mean wage (2) |
|---|---|---|---|---|---|
| Southern Indiana nonmetropolitan area | 750 | 4.02 | 2.74 | $13.83 | $28,770 |
| Southeast Coastal North Carolina nonmetropolitan area | 420 | 1.68 | 1.14 | $14.55 | $30,260 |
| West Central Illinois nonmetropolitan area | 370 | 2.16 | 1.47 | $16.00 | $33,270 |
| Northern Indiana nonmetropolitan area | 350 | 1.64 | 1.12 | $12.66 | $26,340 |
| Western Wisconsin nonmetropolitan area | 340 | 2.42 | 1.65 | $11.09 | $23,060 |
Nonmetropolitan areas with the highest concentration of jobs and location quotients in this occupation:
| Nonmetropolitan area | Employment (1) | Employment per thousand jobs | Location quotient (9) | Hourly mean wage | Annual mean wage (2) |
|---|---|---|---|---|---|
| Southeast Alaska nonmetropolitan area | 170 | 4.77 | 3.25 | $22.73 | $47,270 |
| Southern Indiana nonmetropolitan area | 750 | 4.02 | 2.74 | $13.83 | $28,770 |
| South Illinois nonmetropolitan area | 330 | 3.65 | 2.49 | $11.84 | $24,630 |
| North Coast Oregon nonmetropolitan area | 160 | 3.61 | 2.46 | $14.46 | $30,080 |
| Balance of Alaska nonmetropolitan area | 220 | 3.13 | 2.13 | $24.82 | $51,620 |
Top paying nonmetropolitan areas for this occupation:
| Nonmetropolitan area | Employment (1) | Employment per thousand jobs | Location quotient (9) | Hourly mean wage | Annual mean wage (2) |
|---|---|---|---|---|---|
| Balance of Alaska nonmetropolitan area | 220 | 3.13 | 2.13 | $24.82 | $51,620 |
| Connecticut nonmetropolitan area | 90 | 2.88 | 1.96 | $23.00 | $47,840 |
| Southeast Alaska nonmetropolitan area | 170 | 4.77 | 3.25 | $22.73 | $47,270 |
| Central Louisiana nonmetropolitan area | 50 | 0.61 | 0.41 | $22.56 | $46,930 |
| Northeast Florida nonmetropolitan area | (8) | (8) | (8) | $21.36 | $44,430 |
These estimates are calculated with data collected from employers in all industry sectors, all metropolitan and nonmetropolitan areas, and all states and the District of Columbia. The top employment and wage figures are provided above. The complete list is available in the downloadable XLS files.
The percentile wage estimate is the value of a wage below which a certain percent of workers fall. The median wage is the 50th percentile wage estimate--50 percent of workers earn less than the median and 50 percent of workers earn more than the median. More about percentile wages.
(1) Estimates for detailed occupations do not sum to the totals because the totals include occupations not shown separately. Estimates do not include self-employed workers.
(2) Annual wages have been calculated by multiplying the hourly mean wage by a "year-round, full-time" hours figure of 2,080 hours; for those occupations where there is not an hourly wage published, the annual wage has been directly calculated from the reported survey data.
(3) The relative standard error (RSE) is a measure of the reliability of a survey statistic. The smaller the relative standard error, the more precise the estimate.
(8) Estimate not released.
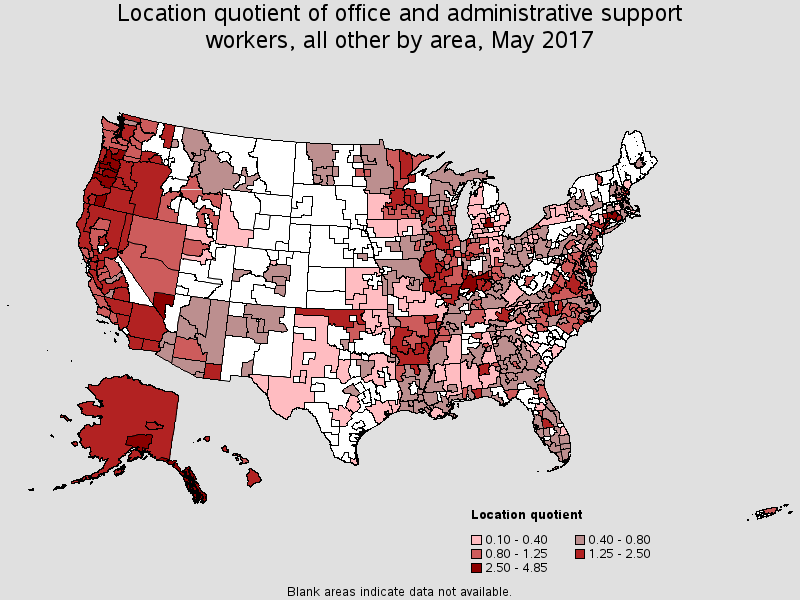
(9) The location quotient is the ratio of the area concentration of occupational employment to the national average concentration. A location quotient greater than one indicates the occupation has a higher share of employment than average, and a location quotient less than one indicates the occupation is less prevalent in the area than average.
Other OES estimates and related information:
May 2017 National Occupational Employment and Wage Estimates
May 2017 State Occupational Employment and Wage Estimates
May 2017 Metropolitan and Nonmetropolitan Area Occupational Employment and Wage Estimates
May 2017 National Industry-Specific Occupational Employment and Wage Estimates
Last Modified Date: March 30, 2018