
An official website of the United States government
An official website of the United States government
The .gov means it's official.
Federal government websites often end in .gov or .mil. Before sharing sensitive information,
make sure you're on a federal government site.
The site is secure.
The
https:// ensures that you are connecting to the official website and that any
information you provide is encrypted and transmitted securely.
Plan, direct, or coordinate one or more administrative services of an organization, such as records and information management, mail distribution, facilities planning and maintenance, custodial operations, and other office support services. Medical records administrators are included in "Medical and Health Services Managers" (11-9111). Excludes "Purchasing Managers" (11-3061).
Employment estimate and mean wage estimates for this occupation:
| Employment (1) | Employment RSE (3) |
Mean hourly wage |
Mean annual wage (2) |
Wage RSE (3) |
|---|---|---|---|---|
| 283,570 | 0.5 % | $50.99 | $106,050 | 0.3 % |
Percentile wage estimates for this occupation:
| Percentile | 10% | 25% | 50% (Median) |
75% | 90% |
|---|---|---|---|---|---|
| Hourly Wage | $26.44 | $34.54 | $46.24 | $61.11 | $79.55 |
| Annual Wage (2) | $55,000 | $71,850 | $96,180 | $127,100 | $165,470 |
Industries with the highest published employment and wages for this occupation are provided. For a list of all industries with employment in this occupation, see the Create Customized Tables function.
Industries with the highest levels of employment in this occupation:
| Industry | Employment (1) | Percent of industry employment | Hourly mean wage | Annual mean wage (2) |
|---|---|---|---|---|
| Local Government, excluding schools and hospitals (OES Designation) | 23,520 | 0.43 | $46.90 | $97,550 |
| Management of Companies and Enterprises | 20,560 | 0.87 | $58.04 | $120,730 |
| Colleges, Universities, and Professional Schools | 14,840 | 0.49 | $48.02 | $99,870 |
| General Medical and Surgical Hospitals | 13,490 | 0.24 | $53.42 | $111,120 |
| State Government, excluding schools and hospitals (OES Designation) | 12,360 | 0.57 | $44.25 | $92,050 |
Industries with the highest concentration of employment in this occupation:
| Industry | Employment (1) | Percent of industry employment | Hourly mean wage | Annual mean wage (2) |
|---|---|---|---|---|
| Monetary Authorities-Central Bank | 470 | 2.58 | $72.59 | $150,990 |
| Office Administrative Services | 5,340 | 1.08 | $56.16 | $116,810 |
| Management of Companies and Enterprises | 20,560 | 0.87 | $58.04 | $120,730 |
| Lessors of Nonfinancial Intangible Assets (except Copyrighted Works) | 150 | 0.67 | $57.65 | $119,920 |
| Business, Professional, Labor, Political, and Similar Organizations | 2,560 | 0.59 | $55.56 | $115,560 |
Top paying industries for this occupation:
| Industry | Employment (1) | Percent of industry employment | Hourly mean wage | Annual mean wage (2) |
|---|---|---|---|---|
| Oil and Gas Extraction | 630 | 0.44 | $72.88 | $151,590 |
| Monetary Authorities-Central Bank | 470 | 2.58 | $72.59 | $150,990 |
| Pipeline Transportation of Crude Oil | 50 | 0.43 | $69.27 | $144,090 |
| Aerospace Product and Parts Manufacturing | 1,200 | 0.25 | $66.99 | $139,340 |
| Natural Gas Distribution | 620 | 0.56 | $65.79 | $136,850 |
States and areas with the highest published employment, location quotients, and wages for this occupation are provided. For a list of all areas with employment in this occupation, see the Create Customized Tables function.
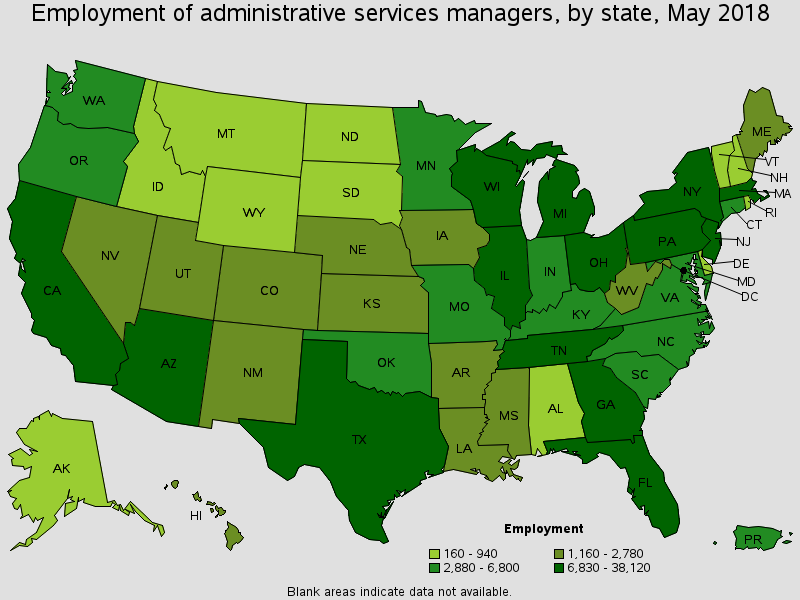
States with the highest employment level in this occupation:
| State | Employment (1) | Employment per thousand jobs | Location quotient (9) | Hourly mean wage | Annual mean wage (2) |
|---|---|---|---|---|---|
| California | 38,120 | 2.24 | 1.14 | $56.17 | $116,820 |
| Texas | 25,760 | 2.13 | 1.09 | $49.94 | $103,880 |
| New York | 18,350 | 1.95 | 1.00 | $66.09 | $137,480 |
| Illinois | 16,950 | 2.83 | 1.44 | $47.04 | $97,840 |
| Florida | 14,030 | 1.63 | 0.83 | $46.23 | $96,150 |
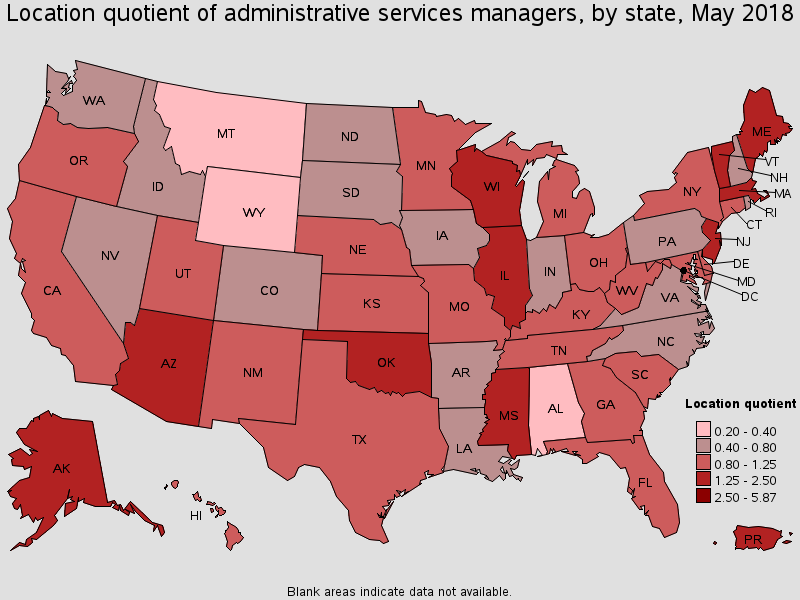
States with the highest concentration of jobs and location quotients in this occupation:
| State | Employment (1) | Employment per thousand jobs | Location quotient (9) | Hourly mean wage | Annual mean wage (2) |
|---|---|---|---|---|---|
| Oklahoma | 6,800 | 4.27 | 2.18 | $44.98 | $93,560 |
| Massachusetts | 12,770 | 3.57 | 1.82 | $53.53 | $111,340 |
| Arizona | 8,200 | 2.94 | 1.50 | $43.25 | $89,950 |
| Illinois | 16,950 | 2.83 | 1.44 | $47.04 | $97,840 |
| New Jersey | 10,960 | 2.71 | 1.38 | $62.87 | $130,770 |
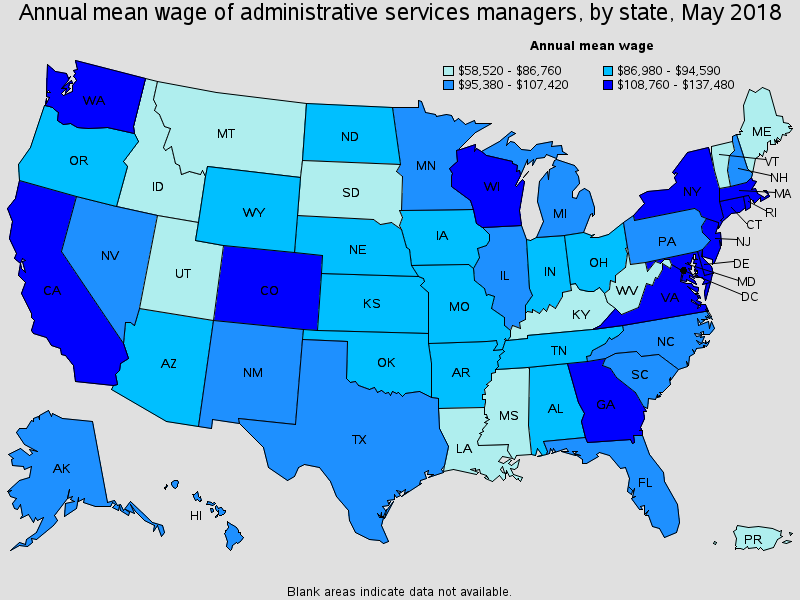
Top paying States for this occupation:
| State | Employment (1) | Employment per thousand jobs | Location quotient (9) | Hourly mean wage | Annual mean wage (2) |
|---|---|---|---|---|---|
| New York | 18,350 | 1.95 | 1.00 | $66.09 | $137,480 |
| New Jersey | 10,960 | 2.71 | 1.38 | $62.87 | $130,770 |
| Rhode Island | 570 | 1.17 | 0.60 | $62.44 | $129,870 |
| District of Columbia | 1,410 | 1.98 | 1.01 | $60.47 | $125,770 |
| Washington | 5,030 | 1.54 | 0.79 | $58.93 | $122,570 |
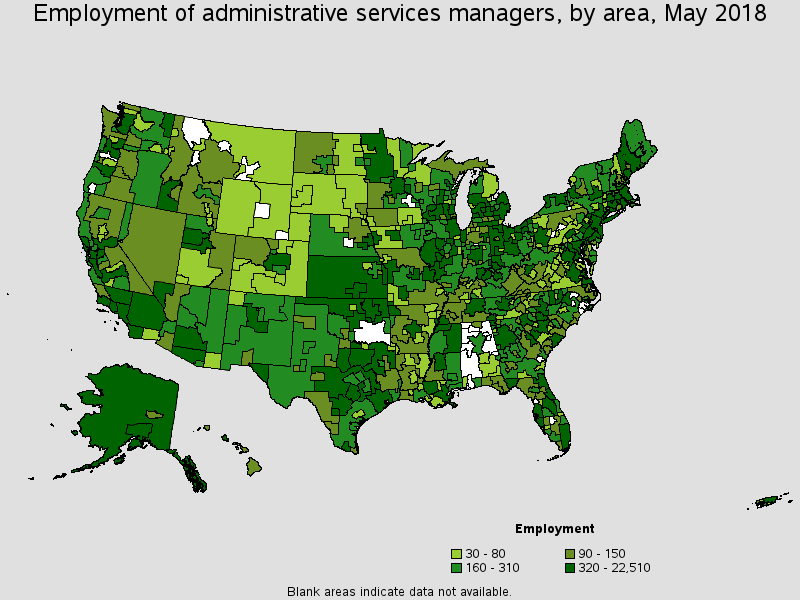
Metropolitan areas with the highest employment level in this occupation:
| Metropolitan area | Employment (1) | Employment per thousand jobs | Location quotient (9) | Hourly mean wage | Annual mean wage (2) |
|---|---|---|---|---|---|
| New York-Newark-Jersey City, NY-NJ-PA | 22,510 | 2.37 | 1.21 | $67.91 | $141,260 |
| Los Angeles-Long Beach-Anaheim, CA | 15,420 | 2.52 | 1.29 | $55.22 | $114,860 |
| Chicago-Naperville-Elgin, IL-IN-WI | 13,800 | 2.97 | 1.52 | $48.61 | $101,120 |
| Boston-Cambridge-Nashua, MA-NH | 10,450 | 3.79 | 1.93 | $55.50 | $115,440 |
| Dallas-Fort Worth-Arlington, TX | 8,040 | 2.25 | 1.15 | $51.81 | $107,760 |
| San Francisco-Oakland-Hayward, CA | 6,590 | 2.72 | 1.39 | $65.39 | $136,000 |
| Phoenix-Mesa-Scottsdale, AZ | 6,460 | 3.15 | 1.61 | $44.12 | $91,770 |
| Houston-The Woodlands-Sugar Land, TX | 6,340 | 2.13 | 1.08 | $53.78 | $111,860 |
| Atlanta-Sandy Springs-Roswell, GA | 5,980 | 2.23 | 1.14 | $60.12 | $125,040 |
| Washington-Arlington-Alexandria, DC-VA-MD-WV | 5,100 | 1.63 | 0.83 | $59.70 | $124,170 |
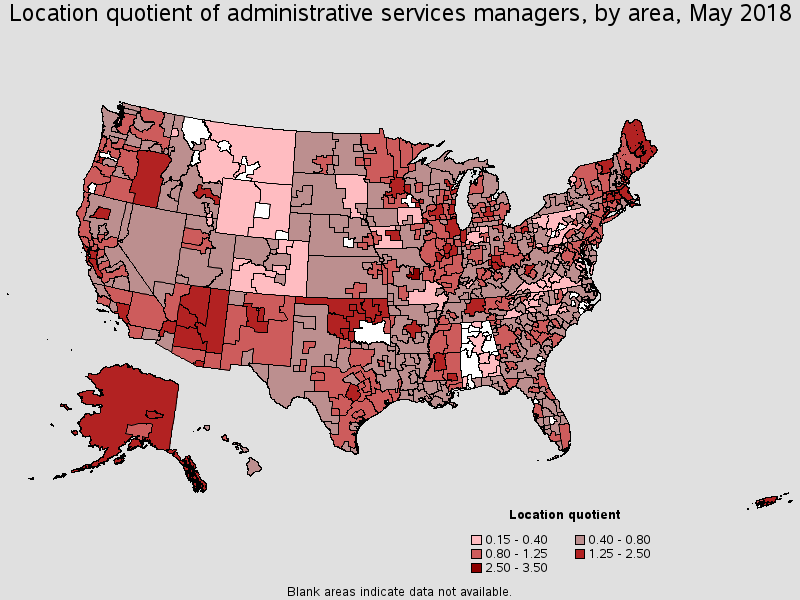
Metropolitan areas with the highest concentration of jobs and location quotients in this occupation:
| Metropolitan area | Employment (1) | Employment per thousand jobs | Location quotient (9) | Hourly mean wage | Annual mean wage (2) |
|---|---|---|---|---|---|
| Jefferson City, MO | 380 | 5.07 | 2.59 | $31.57 | $65,660 |
| Tulsa, OK | 2,110 | 4.86 | 2.48 | $50.38 | $104,790 |
| Lansing-East Lansing, MI | 1,020 | 4.75 | 2.42 | $47.47 | $98,740 |
| Oklahoma City, OK | 2,820 | 4.58 | 2.34 | $47.25 | $98,280 |
| Jackson, MS | 1,120 | 4.27 | 2.18 | $39.56 | $82,280 |
| Trenton, NJ | 880 | 3.80 | 1.94 | $61.04 | $126,960 |
| Boston-Cambridge-Nashua, MA-NH | 10,450 | 3.79 | 1.93 | $55.50 | $115,440 |
| Austin-Round Rock, TX | 3,800 | 3.70 | 1.89 | $52.25 | $108,680 |
| Madison, WI | 1,450 | 3.69 | 1.88 | $52.63 | $109,460 |
| Flagstaff, AZ | 230 | 3.68 | 1.88 | $37.98 | $79,010 |
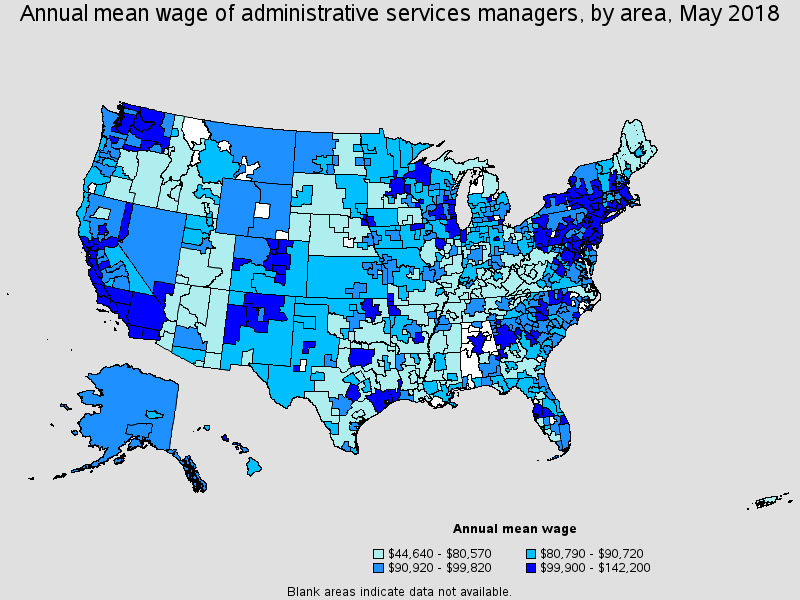
Top paying metropolitan areas for this occupation:
| Metropolitan area | Employment (1) | Employment per thousand jobs | Location quotient (9) | Hourly mean wage | Annual mean wage (2) |
|---|---|---|---|---|---|
| San Jose-Sunnyvale-Santa Clara, CA | 2,870 | 2.56 | 1.31 | $68.36 | $142,200 |
| New York-Newark-Jersey City, NY-NJ-PA | 22,510 | 2.37 | 1.21 | $67.91 | $141,260 |
| Columbus, GA-AL | 190 | 1.63 | 0.83 | $66.43 | $138,170 |
| San Francisco-Oakland-Hayward, CA | 6,590 | 2.72 | 1.39 | $65.39 | $136,000 |
| Ithaca, NY | 110 | 2.24 | 1.14 | $63.97 | $133,060 |
| Bridgeport-Stamford-Norwalk, CT | 1,330 | 3.20 | 1.63 | $63.68 | $132,460 |
| Kennewick-Richland, WA | 160 | 1.36 | 0.70 | $62.71 | $130,440 |
| Seattle-Tacoma-Bellevue, WA | 3,390 | 1.71 | 0.87 | $62.58 | $130,170 |
| Denver-Aurora-Lakewood, CO | 1,500 | 1.02 | 0.52 | $61.26 | $127,430 |
| Trenton, NJ | 880 | 3.80 | 1.94 | $61.04 | $126,960 |
Nonmetropolitan areas with the highest employment in this occupation:
| Nonmetropolitan area | Employment (1) | Employment per thousand jobs | Location quotient (9) | Hourly mean wage | Annual mean wage (2) |
|---|---|---|---|---|---|
| Kansas nonmetropolitan area | 460 | 1.17 | 0.60 | $39.00 | $81,110 |
| Hill Country Region of Texas nonmetropolitan area | 450 | 2.33 | 1.19 | $36.81 | $76,560 |
| North Northeastern Ohio non-metropolitan area (non-contiguous) | 450 | 1.33 | 0.68 | $35.29 | $73,400 |
| Southwest Maine nonmetropolitan area | 420 | 2.19 | 1.12 | $34.64 | $72,040 |
| Northeast Mississippi nonmetropolitan area | 420 | 1.79 | 0.91 | $38.50 | $80,080 |
Nonmetropolitan areas with the highest concentration of jobs and location quotients in this occupation:
| Nonmetropolitan area | Employment (1) | Employment per thousand jobs | Location quotient (9) | Hourly mean wage | Annual mean wage (2) |
|---|---|---|---|---|---|
| Northern Vermont nonmetropolitan area | 280 | 3.96 | 2.02 | $42.07 | $87,500 |
| Northwest Oklahoma nonmetropolitan area | 340 | 3.54 | 1.81 | $41.81 | $86,960 |
| Alaska nonmetropolitan area | 380 | 3.54 | 1.81 | $47.68 | $99,170 |
| Southwest Oklahoma nonmetropolitan area | 220 | 3.42 | 1.74 | $32.68 | $67,980 |
| Arizona nonmetropolitan area | 290 | 3.15 | 1.61 | $37.66 | $78,340 |
Top paying nonmetropolitan areas for this occupation:
| Nonmetropolitan area | Employment (1) | Employment per thousand jobs | Location quotient (9) | Hourly mean wage | Annual mean wage (2) |
|---|---|---|---|---|---|
| Northern New Mexico nonmetropolitan area | 190 | 2.42 | 1.23 | $53.75 | $111,810 |
| West Central-Southwest New Hampshire nonmetropolitan area | 160 | 1.54 | 0.79 | $53.35 | $110,970 |
| Central East New York nonmetropolitan area | 170 | 1.04 | 0.53 | $53.21 | $110,670 |
| Eastern Washington nonmetropolitan area | 160 | 1.65 | 0.84 | $52.46 | $109,110 |
| Western Pennsylvania nonmetropolitan area | 80 | 0.53 | 0.27 | $51.08 | $106,240 |
These estimates are calculated with data collected from employers in all industry sectors, all metropolitan and nonmetropolitan areas, and all states and the District of Columbia. The top employment and wage figures are provided above. The complete list is available in the downloadable XLS files.
The percentile wage estimate is the value of a wage below which a certain percent of workers fall. The median wage is the 50th percentile wage estimate--50 percent of workers earn less than the median and 50 percent of workers earn more than the median. More about percentile wages.
(1) Estimates for detailed occupations do not sum to the totals because the totals include occupations not shown separately. Estimates do not include self-employed workers.
(2) Annual wages have been calculated by multiplying the hourly mean wage by a "year-round, full-time" hours figure of 2,080 hours; for those occupations where there is not an hourly wage published, the annual wage has been directly calculated from the reported survey data.
(3) The relative standard error (RSE) is a measure of the reliability of a survey statistic. The smaller the relative standard error, the more precise the estimate.
(9) The location quotient is the ratio of the area concentration of occupational employment to the national average concentration. A location quotient greater than one indicates the occupation has a higher share of employment than average, and a location quotient less than one indicates the occupation is less prevalent in the area than average.
Other OES estimates and related information:
May 2018 National Occupational Employment and Wage Estimates
May 2018 State Occupational Employment and Wage Estimates
May 2018 Metropolitan and Nonmetropolitan Area Occupational Employment and Wage Estimates
May 2018 National Industry-Specific Occupational Employment and Wage Estimates
Last Modified Date: March 29, 2019