
An official website of the United States government
An official website of the United States government
The .gov means it's official.
Federal government websites often end in .gov or .mil. Before sharing sensitive information,
make sure you're on a federal government site.
The site is secure.
The
https:// ensures that you are connecting to the official website and that any
information you provide is encrypted and transmitted securely.
This major group comprises the following occupations: Art Directors ; Craft Artists ; Fine Artists, Including Painters, Sculptors, and Illustrators ; Multimedia Artists and Animators ; Artists and Related Workers, All Other ; Commercial and Industrial Designers ; Fashion Designers ; Floral Designers ; Graphic Designers ; Interior Designers ; Merchandise Displayers and Window Trimmers ; Set and Exhibit Designers ; Designers, All Other ; Actors ; Producers and Directors ; Athletes and Sports Competitors ; Coaches and Scouts ; Umpires, Referees, and Other Sports Officials ; Dancers ; Choreographers ; Music Directors and Composers ; Musicians and Singers ; Entertainers and Performers, Sports and Related Workers, All Other ; Radio and Television Announcers ; Public Address System and Other Announcers ; Broadcast News Analysts ; Reporters and Correspondents ; Public Relations Specialists ; Editors ; Technical Writers ; Writers and Authors ; Interpreters and Translators ; Media and Communication Workers, All Other ; Audio and Video Equipment Technicians ; Broadcast Technicians ; Radio Operators ; Sound Engineering Technicians ; Photographers ; Camera Operators, Television, Video, and Motion Picture ; Film and Video Editors ; Media and Communication Equipment Workers, All Other
Employment estimate and mean wage estimates for this major group:
| Employment (1) | Employment RSE (3) |
Mean hourly wage |
Mean annual wage (2) |
Wage RSE (3) |
|---|---|---|---|---|
| 1,951,170 | 0.5 % | $28.74 | $59,780 | 0.5 % |
Percentile wage estimates for this major group:
| Percentile | 10% | 25% | 50% (Median) |
75% | 90% |
|---|---|---|---|---|---|
| Hourly Wage | $10.99 | $15.39 | $23.70 | $35.43 | $50.36 |
| Annual Wage (2) | $22,850 | $32,010 | $49,290 | $73,690 | $104,740 |
Industries with the highest published employment and wages for this occupation are provided. For a list of all industries with employment in this occupation, see the Create Customized Tables function.
Industries with the highest levels of employment in this occupation:
| Industry | Employment (1) | Percent of industry employment | Hourly mean wage | Annual mean wage (2) |
|---|---|---|---|---|
| Motion Picture and Video Industries | 157,240 | 38.32 | $40.17 | $83,550 |
| Radio and Television Broadcasting | 125,400 | 57.89 | $29.27 | $60,880 |
| Advertising, Public Relations, and Related Services | 122,950 | 25.16 | $32.72 | $68,050 |
| Newspaper, Periodical, Book, and Directory Publishers | 98,680 | 29.70 | $28.61 | $59,510 |
| Colleges, Universities, and Professional Schools | 96,740 | 3.18 | $28.09 | $58,430 |
Industries with the highest concentration of employment in this occupation:
| Industry | Employment (1) | Percent of industry employment | Hourly mean wage | Annual mean wage (2) |
|---|---|---|---|---|
| Radio and Television Broadcasting | 125,400 | 57.89 | $29.27 | $60,880 |
| Independent Artists, Writers, and Performers | 30,000 | 57.83 | $34.74 | $72,250 |
| Florists | 28,480 | 45.49 | $13.76 | $28,610 |
| Specialized Design Services | 63,560 | 44.50 | $29.72 | $61,830 |
| Sound Recording Industries | 7,490 | 42.93 | $32.86 | $68,360 |
Top paying industries for this occupation:
| Industry | Employment (1) | Percent of industry employment | Hourly mean wage | Annual mean wage (2) |
|---|---|---|---|---|
| Computer and Peripheral Equipment Manufacturing | 2,100 | 1.34 | $44.66 | $92,900 |
| Federal Executive Branch (OES Designation) | 18,970 | 0.95 | $42.77 | $88,950 |
| Postal Service (federal government) | 150 | 0.02 | $42.22 | $87,810 |
| Metal Ore Mining | 50 | 0.12 | $41.80 | $86,950 |
| Natural Gas Distribution | 400 | 0.37 | $40.50 | $84,230 |
States and areas with the highest published employment, location quotients, and wages for this occupation are provided. For a list of all areas with employment in this occupation, see the Create Customized Tables function.
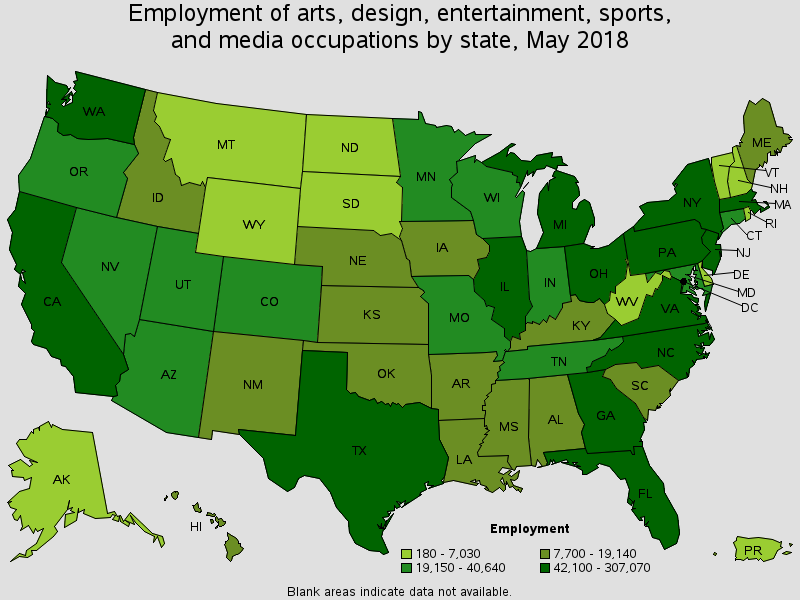
States with the highest employment level in this occupation:
| State | Employment (1) | Employment per thousand jobs | Location quotient (9) | Hourly mean wage | Annual mean wage (2) |
|---|---|---|---|---|---|
| California | 307,070 | 18.05 | 1.34 | $34.97 | $72,750 |
| New York | 207,900 | 22.15 | 1.64 | $38.40 | $79,870 |
| Texas | 137,980 | 11.39 | 0.84 | $25.73 | $53,520 |
| Florida | 105,100 | 12.21 | 0.91 | $24.83 | $51,650 |
| Illinois | 74,740 | 12.47 | 0.93 | $25.83 | $53,730 |
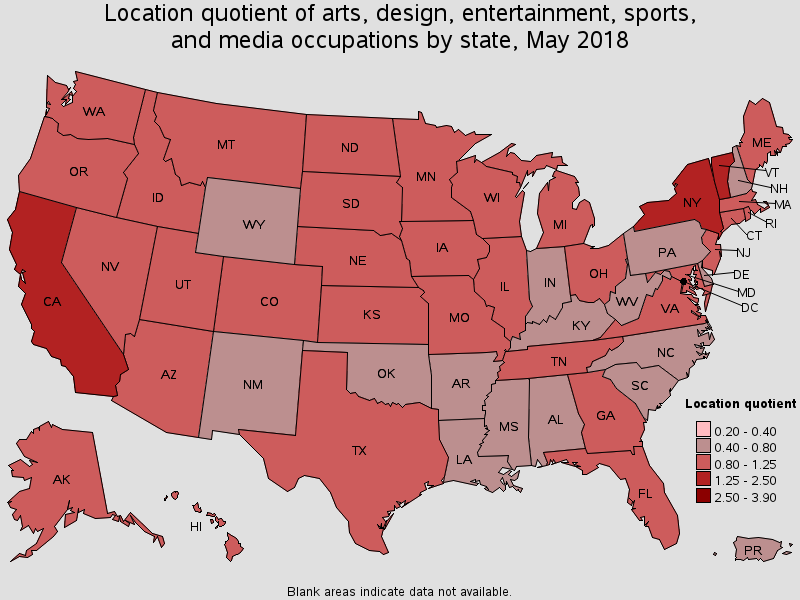
States with the highest concentration of jobs and location quotients in this occupation:
| State | Employment (1) | Employment per thousand jobs | Location quotient (9) | Hourly mean wage | Annual mean wage (2) |
|---|---|---|---|---|---|
| District of Columbia | 37,470 | 52.60 | 3.90 | $45.73 | $95,130 |
| New York | 207,900 | 22.15 | 1.64 | $38.40 | $79,870 |
| Vermont | 5,970 | 19.54 | 1.45 | $22.77 | $47,360 |
| California | 307,070 | 18.05 | 1.34 | $34.97 | $72,750 |
| Oregon | 30,730 | 16.29 | 1.21 | $27.11 | $56,390 |
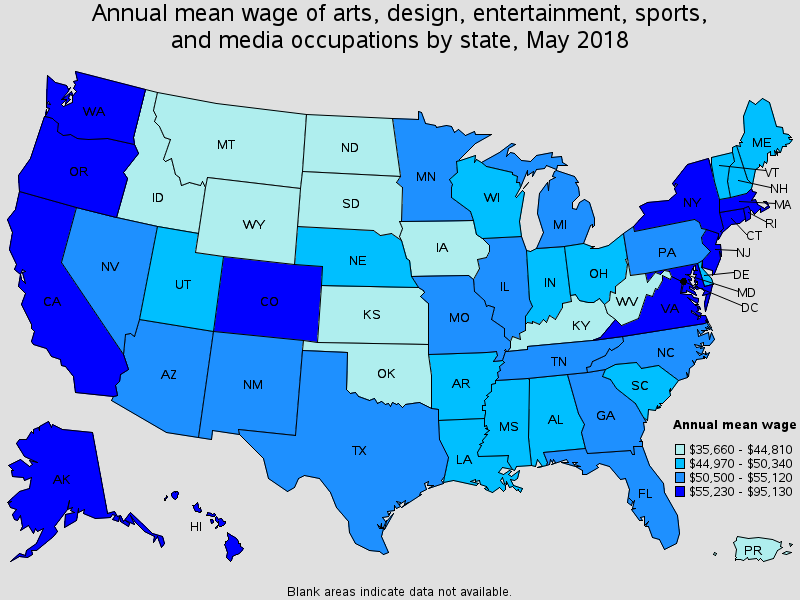
Top paying States for this occupation:
| State | Employment (1) | Employment per thousand jobs | Location quotient (9) | Hourly mean wage | Annual mean wage (2) |
|---|---|---|---|---|---|
| District of Columbia | 37,470 | 52.60 | 3.90 | $45.73 | $95,130 |
| New York | 207,900 | 22.15 | 1.64 | $38.40 | $79,870 |
| California | 307,070 | 18.05 | 1.34 | $34.97 | $72,750 |
| Massachusetts | 51,750 | 14.49 | 1.07 | $30.97 | $64,420 |
| Connecticut | 21,880 | 13.18 | 0.98 | $30.47 | $63,380 |
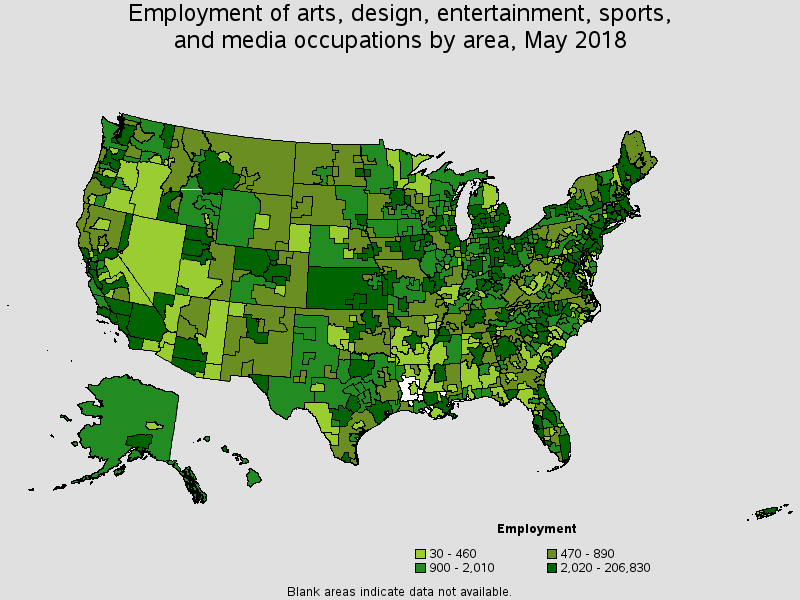
Metropolitan areas with the highest employment level in this occupation:
| Metropolitan area | Employment (1) | Employment per thousand jobs | Location quotient (9) | Hourly mean wage | Annual mean wage (2) |
|---|---|---|---|---|---|
| New York-Newark-Jersey City, NY-NJ-PA | 206,830 | 21.78 | 1.62 | $38.65 | $80,400 |
| Los Angeles-Long Beach-Anaheim, CA | 165,740 | 27.09 | 2.01 | $37.75 | $78,510 |
| Washington-Arlington-Alexandria, DC-VA-MD-WV | 73,050 | 23.30 | 1.73 | $39.24 | $81,620 |
| Chicago-Naperville-Elgin, IL-IN-WI | 61,690 | 13.29 | 0.99 | $26.81 | $55,770 |
| San Francisco-Oakland-Hayward, CA | 52,560 | 21.73 | 1.61 | $35.51 | $73,850 |
| Dallas-Fort Worth-Arlington, TX | 47,660 | 13.36 | 0.99 | $25.85 | $53,770 |
| Atlanta-Sandy Springs-Roswell, GA | 45,670 | 17.02 | 1.26 | $27.48 | $57,150 |
| Boston-Cambridge-Nashua, MA-NH | 42,130 | 15.27 | 1.13 | $32.11 | $66,780 |
| Miami-Fort Lauderdale-West Palm Beach, FL | 33,930 | 13.10 | 0.97 | $26.41 | $54,920 |
| Seattle-Tacoma-Bellevue, WA | 33,480 | 16.87 | 1.25 | $30.32 | $63,060 |
Metropolitan areas with the highest concentration of jobs and location quotients in this occupation:
| Metropolitan area | Employment (1) | Employment per thousand jobs | Location quotient (9) | Hourly mean wage | Annual mean wage (2) |
|---|---|---|---|---|---|
| Los Angeles-Long Beach-Anaheim, CA | 165,740 | 27.09 | 2.01 | $37.75 | $78,510 |
| Missoula, MT | 1,430 | 23.84 | 1.77 | $19.30 | $40,150 |
| Washington-Arlington-Alexandria, DC-VA-MD-WV | 73,050 | 23.30 | 1.73 | $39.24 | $81,620 |
| Lawrence, KS | 1,130 | 22.96 | 1.70 | $19.30 | $40,140 |
| New York-Newark-Jersey City, NY-NJ-PA | 206,830 | 21.78 | 1.62 | $38.65 | $80,400 |
| San Francisco-Oakland-Hayward, CA | 52,560 | 21.73 | 1.61 | $35.51 | $73,850 |
| Burlington-South Burlington, VT | 2,620 | 21.27 | 1.58 | $24.94 | $51,880 |
| Boulder, CO | 3,820 | 20.96 | 1.55 | $27.93 | $58,090 |
| Olympia-Tumwater, WA | 2,180 | 19.28 | 1.43 | $25.14 | $52,300 |
| Portland-Vancouver-Hillsboro, OR-WA | 22,810 | 19.16 | 1.42 | $28.64 | $59,580 |
Top paying metropolitan areas for this occupation:
| Metropolitan area | Employment (1) | Employment per thousand jobs | Location quotient (9) | Hourly mean wage | Annual mean wage (2) |
|---|---|---|---|---|---|
| Washington-Arlington-Alexandria, DC-VA-MD-WV | 73,050 | 23.30 | 1.73 | $39.24 | $81,620 |
| New York-Newark-Jersey City, NY-NJ-PA | 206,830 | 21.78 | 1.62 | $38.65 | $80,400 |
| Los Angeles-Long Beach-Anaheim, CA | 165,740 | 27.09 | 2.01 | $37.75 | $78,510 |
| San Jose-Sunnyvale-Santa Clara, CA | 16,610 | 14.84 | 1.10 | $36.30 | $75,500 |
| San Francisco-Oakland-Hayward, CA | 52,560 | 21.73 | 1.61 | $35.51 | $73,850 |
| Fayetteville, NC | 1,130 | 8.80 | 0.65 | $34.04 | $70,810 |
| Bridgeport-Stamford-Norwalk, CT | 7,610 | 18.29 | 1.36 | $33.36 | $69,390 |
| Oxnard-Thousand Oaks-Ventura, CA | 3,930 | 12.51 | 0.93 | $32.22 | $67,010 |
| Trenton, NJ | 2,690 | 11.61 | 0.86 | $32.16 | $66,900 |
| Boston-Cambridge-Nashua, MA-NH | 42,130 | 15.27 | 1.13 | $32.11 | $66,780 |
Nonmetropolitan areas with the highest employment in this occupation:
| Nonmetropolitan area | Employment (1) | Employment per thousand jobs | Location quotient (9) | Hourly mean wage | Annual mean wage (2) |
|---|---|---|---|---|---|
| Kansas nonmetropolitan area | 3,790 | 9.66 | 0.72 | $17.25 | $35,890 |
| North Northeastern Ohio non-metropolitan area (non-contiguous) | 2,960 | 8.83 | 0.66 | $16.51 | $34,340 |
| Northwest Colorado nonmetropolitan area | 2,430 | 20.21 | 1.50 | $24.33 | $50,600 |
| Southeast Iowa nonmetropolitan area | 2,310 | 10.18 | 0.76 | $17.95 | $37,330 |
| Balance of Lower Peninsula of Michigan nonmetropolitan area | 2,300 | 8.46 | 0.63 | $22.29 | $46,360 |
Nonmetropolitan areas with the highest concentration of jobs and location quotients in this occupation:
| Nonmetropolitan area | Employment (1) | Employment per thousand jobs | Location quotient (9) | Hourly mean wage | Annual mean wage (2) |
|---|---|---|---|---|---|
| Southern Vermont nonmetropolitan area | 2,240 | 21.01 | 1.56 | $19.27 | $40,090 |
| Northwest Colorado nonmetropolitan area | 2,430 | 20.21 | 1.50 | $24.33 | $50,600 |
| Southwest Missouri nonmetropolitan area | 1,470 | 19.46 | 1.44 | $21.48 | $44,680 |
| Northern Vermont nonmetropolitan area | 1,110 | 15.59 | 1.16 | $24.72 | $51,410 |
| Southwest Montana nonmetropolitan area | 2,060 | 14.94 | 1.11 | $19.19 | $39,920 |
Top paying nonmetropolitan areas for this occupation:
| Nonmetropolitan area | Employment (1) | Employment per thousand jobs | Location quotient (9) | Hourly mean wage | Annual mean wage (2) |
|---|---|---|---|---|---|
| Hawaii / Kauai nonmetropolitan area | 970 | 9.64 | 0.71 | $26.44 | $54,990 |
| West Central-Southwest New Hampshire nonmetropolitan area | 1,440 | 14.12 | 1.05 | $26.12 | $54,330 |
| Central East New York nonmetropolitan area | 1,460 | 9.11 | 0.68 | $25.49 | $53,010 |
| Northern New Mexico nonmetropolitan area | 530 | 6.58 | 0.49 | $25.48 | $52,990 |
| Connecticut nonmetropolitan area | 270 | 8.17 | 0.61 | $25.28 | $52,580 |
These estimates are calculated with data collected from employers in all industry sectors, all metropolitan and nonmetropolitan areas, and all states and the District of Columbia.
The percentile wage estimate is the value of a wage below which a certain percent of workers fall. The median wage is the 50th percentile wage estimate--50 percent of workers earn less than the median and 50 percent of workers earn more than the median. More about percentile wages.
(1) Estimates for detailed occupations do not sum to the totals because the totals include occupations not shown separately. Estimates do not include self-employed workers.
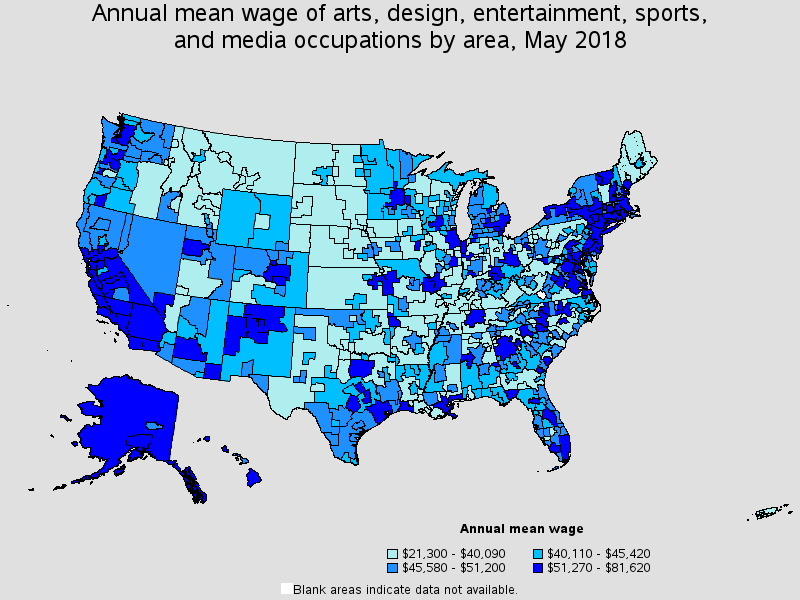
(2) Annual wages have been calculated by multiplying the hourly mean wage by a "year-round, full-time" hours figure of 2,080 hours; for those occupations where there is not an hourly wage published, the annual wage has been directly calculated from the reported survey data.
(3) The relative standard error (RSE) is a measure of the reliability of a survey statistic. The smaller the relative standard error, the more precise the estimate.
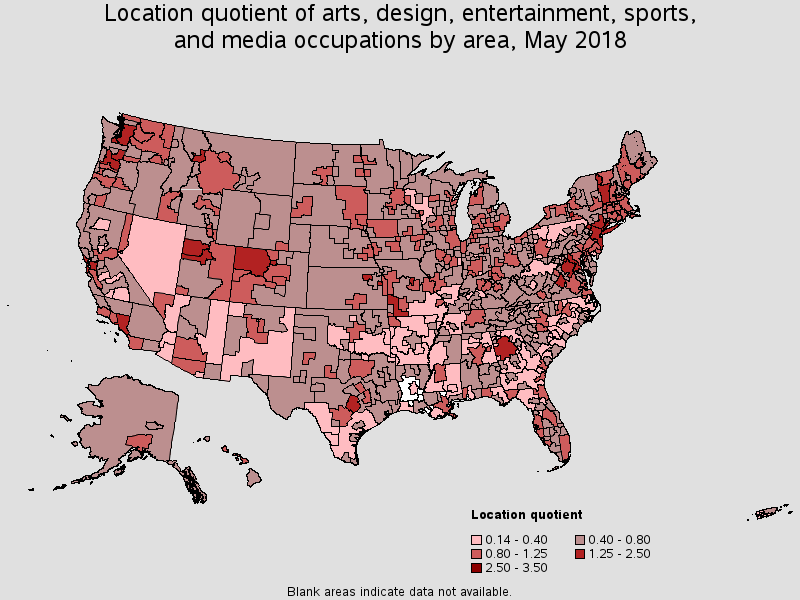
(9) The location quotient is the ratio of the area concentration of occupational employment to the national average concentration. A location quotient greater than one indicates the occupation has a higher share of employment than average, and a location quotient less than one indicates the occupation is less prevalent in the area than average.
Other OES estimates and related information:
May 2018 National Occupational Employment and Wage Estimates
May 2018 State Occupational Employment and Wage Estimates
May 2018 Metropolitan and Nonmetropolitan Area Occupational Employment and Wage Estimates
May 2018 National Industry-Specific Occupational Employment and Wage Estimates
Last Modified Date: March 29, 2019