
An official website of the United States government
An official website of the United States government
The .gov means it's official.
Federal government websites often end in .gov or .mil. Before sharing sensitive information,
make sure you're on a federal government site.
The site is secure.
The
https:// ensures that you are connecting to the official website and that any
information you provide is encrypted and transmitted securely.
This major group comprises the following occupations: First-Line Supervisors of Retail Sales Workers ; First-Line Supervisors of Non-Retail Sales Workers ; Cashiers ; Gaming Change Persons and Booth Cashiers ; Counter and Rental Clerks ; Parts Salespersons ; Retail Salespersons ; Advertising Sales Agents ; Insurance Sales Agents ; Securities, Commodities, and Financial Services Sales Agents ; Travel Agents ; Sales Representatives, Services, All Other ; Sales Representatives, Wholesale and Manufacturing, Technical and Scientific Products ; Sales Representatives, Wholesale and Manufacturing, Except Technical and Scientific Products ; Demonstrators and Product Promoters ; Models ; Real Estate Brokers ; Real Estate Sales Agents ; Sales Engineers ; Telemarketers ; Door-to-Door Sales Workers, News and Street Vendors, and Related Workers ; Sales and Related Workers, All Other
Employment estimate and mean wage estimates for this major group:
| Employment (1) | Employment RSE (3) |
Mean hourly wage |
Mean annual wage (2) |
Wage RSE (3) |
|---|---|---|---|---|
| 14,542,290 | 0.2 % | $20.09 | $41,790 | 0.2 % |
Percentile wage estimates for this major group:
| Percentile | 10% | 25% | 50% (Median) |
75% | 90% |
|---|---|---|---|---|---|
| Hourly Wage | $9.10 | $10.63 | $13.55 | $22.87 | $38.16 |
| Annual Wage (2) | $18,920 | $22,120 | $28,180 | $47,570 | $79,370 |
Industries with the highest published employment and wages for this occupation are provided. For a list of all industries with employment in this occupation, see the Create Customized Tables function.
Industries with the highest levels of employment in this occupation:
| Industry | Employment (1) | Percent of industry employment | Hourly mean wage | Annual mean wage (2) |
|---|---|---|---|---|
| General Merchandise Stores | 1,918,050 | 60.26 | $12.67 | $26,360 |
| Food and Beverage Stores (4451 and 4452 only) | 1,211,580 | 41.44 | $12.94 | $26,920 |
| Clothing Stores | 929,500 | 87.18 | $13.45 | $27,980 |
| Gasoline Stations | 726,050 | 77.64 | $11.52 | $23,960 |
| Building Material and Supplies Dealers | 663,710 | 57.32 | $15.79 | $32,850 |
Industries with the highest concentration of employment in this occupation:
| Industry | Employment (1) | Percent of industry employment | Hourly mean wage | Annual mean wage (2) |
|---|---|---|---|---|
| Shoe Stores | 186,600 | 89.42 | $12.96 | $26,950 |
| Clothing Stores | 929,500 | 87.18 | $13.45 | $27,980 |
| Beer, Wine, and Liquor Stores | 126,470 | 79.28 | $13.16 | $27,380 |
| Book Stores and News Dealers | 61,370 | 78.14 | $12.38 | $25,760 |
| Gasoline Stations | 726,050 | 77.64 | $11.52 | $23,960 |
Top paying industries for this occupation:
| Industry | Employment (1) | Percent of industry employment | Hourly mean wage | Annual mean wage (2) |
|---|---|---|---|---|
| Securities, Commodity Contracts, and Other Financial Investments and Related Activities | 196,580 | 21.12 | $62.69 | $130,380 |
| Pipeline Transportation of Crude Oil | 110 | 1.05 | $52.69 | $109,590 |
| Scientific Research and Development Services | 9,340 | 1.38 | $49.99 | $103,980 |
| Other Pipeline Transportation | 110 | 1.21 | $49.04 | $102,000 |
| Oil and Gas Extraction | 3,150 | 2.23 | $47.75 | $99,330 |
States and areas with the highest published employment, location quotients, and wages for this occupation are provided. For a list of all areas with employment in this occupation, see the Create Customized Tables function.
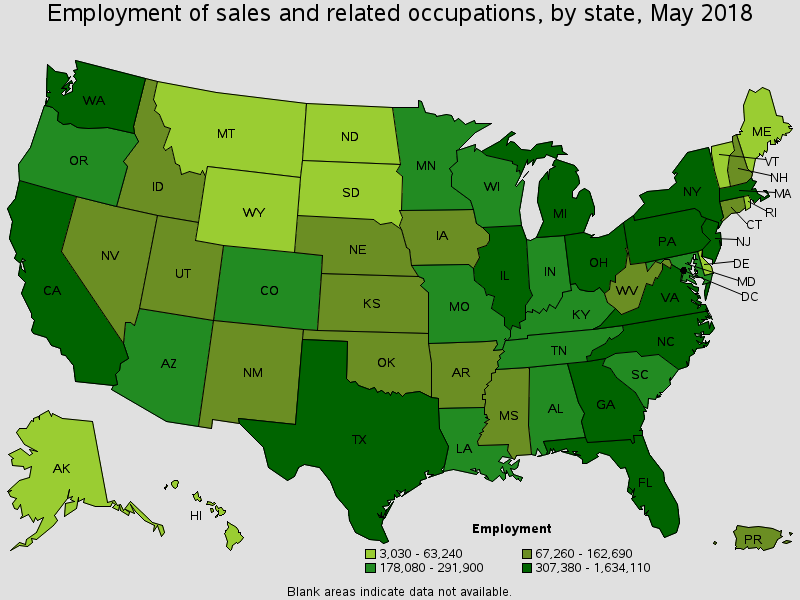
States with the highest employment level in this occupation:
| State | Employment (1) | Employment per thousand jobs | Location quotient (9) | Hourly mean wage | Annual mean wage (2) |
|---|---|---|---|---|---|
| California | 1,634,110 | 96.08 | 0.96 | $21.67 | $45,070 |
| Texas | 1,276,460 | 105.37 | 1.05 | $20.22 | $42,070 |
| Florida | 1,058,680 | 122.98 | 1.22 | $18.59 | $38,660 |
| New York | 923,140 | 98.36 | 0.98 | $26.06 | $54,200 |
| Illinois | 577,930 | 96.46 | 0.96 | $20.53 | $42,700 |
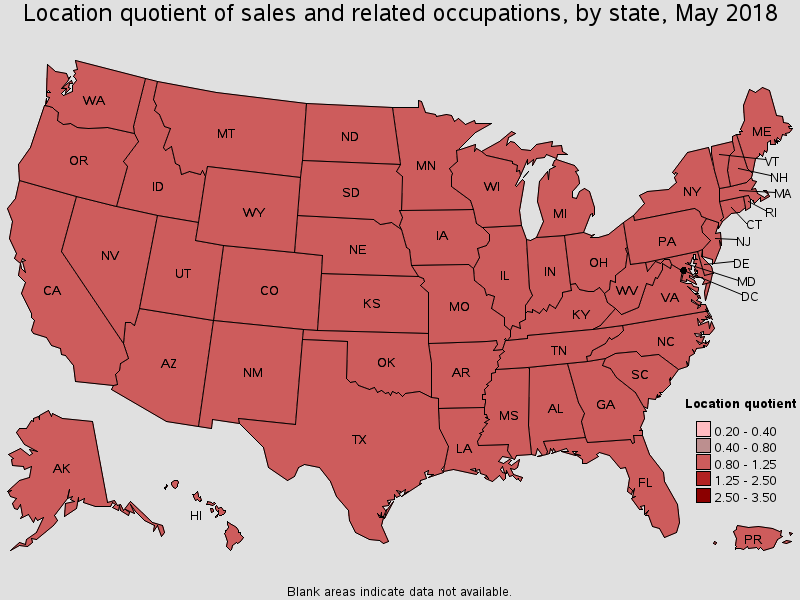
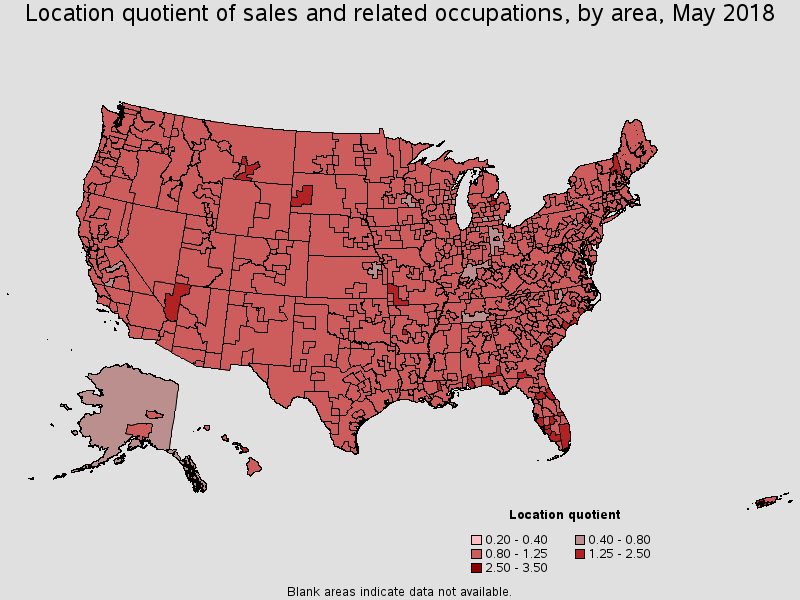
States with the highest concentration of jobs and location quotients in this occupation:
| State | Employment (1) | Employment per thousand jobs | Location quotient (9) | Hourly mean wage | Annual mean wage (2) |
|---|---|---|---|---|---|
| Florida | 1,058,680 | 122.98 | 1.22 | $18.59 | $38,660 |
| New Hampshire | 77,030 | 117.98 | 1.17 | $19.83 | $41,250 |
| Colorado | 291,900 | 111.39 | 1.11 | $23.01 | $47,850 |
| South Dakota | 46,820 | 110.88 | 1.10 | $18.57 | $38,620 |
| South Carolina | 227,570 | 110.35 | 1.10 | $16.63 | $34,590 |
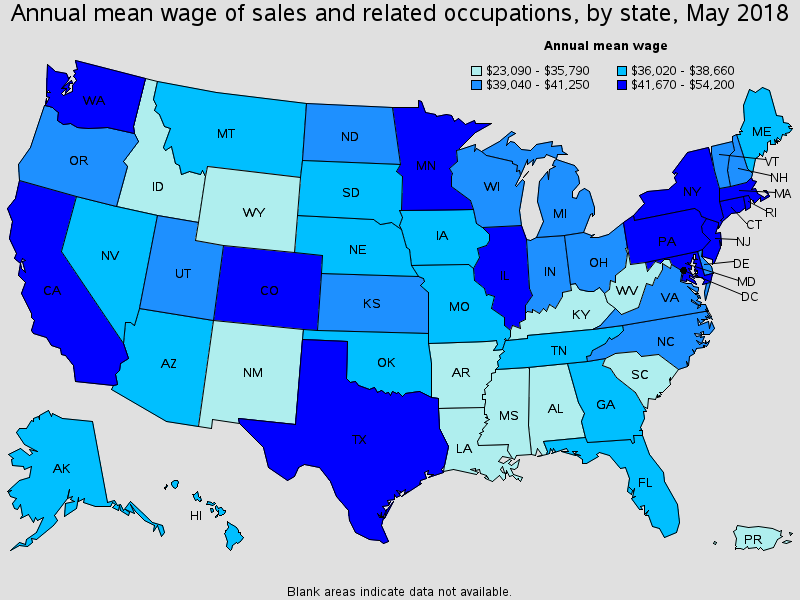
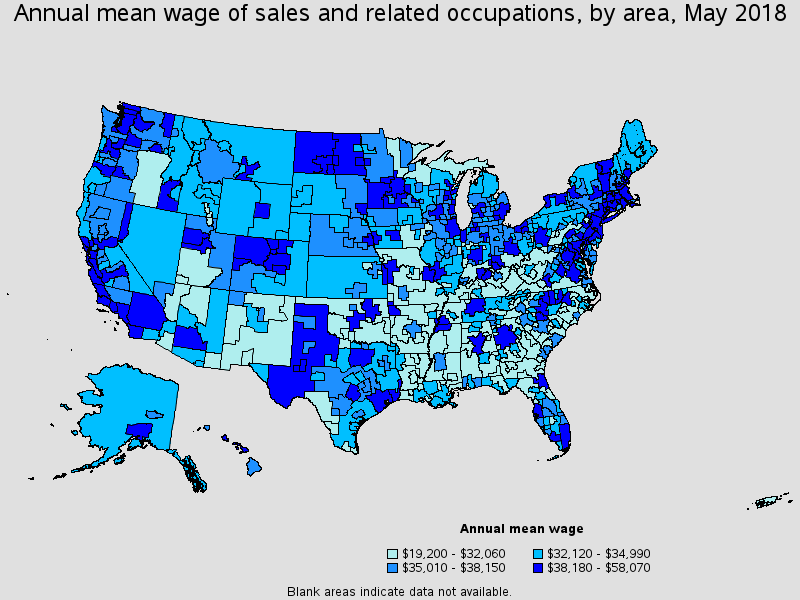
Top paying States for this occupation:
| State | Employment (1) | Employment per thousand jobs | Location quotient (9) | Hourly mean wage | Annual mean wage (2) |
|---|---|---|---|---|---|
| New York | 923,140 | 98.36 | 0.98 | $26.06 | $54,200 |
| District of Columbia | 26,740 | 37.53 | 0.37 | $25.25 | $52,510 |
| Massachusetts | 317,270 | 88.84 | 0.88 | $23.52 | $48,930 |
| Colorado | 291,900 | 111.39 | 1.11 | $23.01 | $47,850 |
| Connecticut | 160,550 | 96.71 | 0.96 | $22.81 | $47,440 |
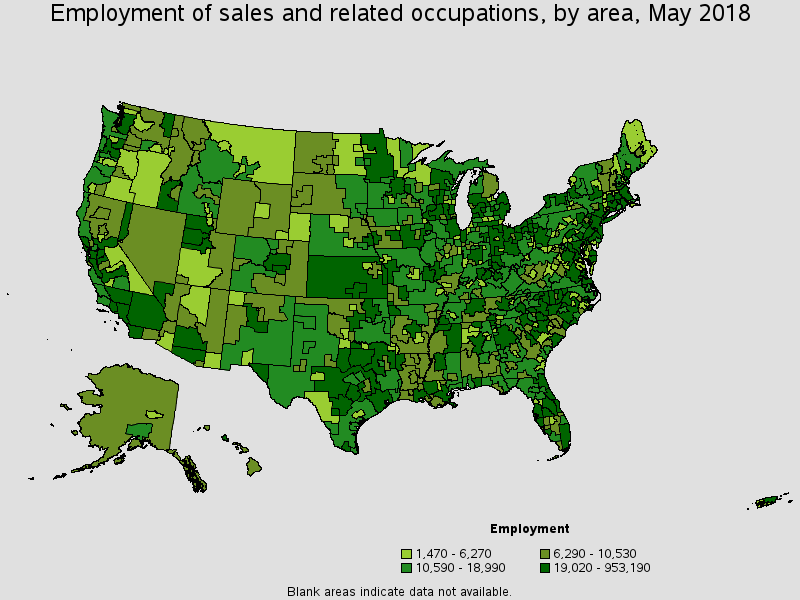
Metropolitan areas with the highest employment level in this occupation:
| Metropolitan area | Employment (1) | Employment per thousand jobs | Location quotient (9) | Hourly mean wage | Annual mean wage (2) |
|---|---|---|---|---|---|
| New York-Newark-Jersey City, NY-NJ-PA | 953,190 | 100.35 | 1.00 | $27.03 | $56,210 |
| Los Angeles-Long Beach-Anaheim, CA | 593,140 | 96.94 | 0.96 | $21.80 | $45,350 |
| Chicago-Naperville-Elgin, IL-IN-WI | 459,490 | 98.99 | 0.99 | $21.56 | $44,850 |
| Dallas-Fort Worth-Arlington, TX | 384,880 | 107.87 | 1.07 | $21.72 | $45,190 |
| Miami-Fort Lauderdale-West Palm Beach, FL | 336,400 | 129.87 | 1.29 | $19.63 | $40,840 |
| Houston-The Woodlands-Sugar Land, TX | 305,590 | 102.46 | 1.02 | $21.31 | $44,330 |
| Atlanta-Sandy Springs-Roswell, GA | 298,880 | 111.40 | 1.11 | $19.76 | $41,110 |
| Philadelphia-Camden-Wilmington, PA-NJ-DE-MD | 275,280 | 96.63 | 0.96 | $22.26 | $46,310 |
| Washington-Arlington-Alexandria, DC-VA-MD-WV | 273,260 | 87.16 | 0.87 | $22.23 | $46,230 |
| Boston-Cambridge-Nashua, MA-NH | 247,120 | 89.58 | 0.89 | $24.80 | $51,590 |
Metropolitan areas with the highest concentration of jobs and location quotients in this occupation:
| Metropolitan area | Employment (1) | Employment per thousand jobs | Location quotient (9) | Hourly mean wage | Annual mean wage (2) |
|---|---|---|---|---|---|
| Daphne-Fairhope-Foley, AL | 12,030 | 166.00 | 1.65 | $16.21 | $33,710 |
| Myrtle Beach-Conway-North Myrtle Beach, SC-NC | 25,720 | 157.87 | 1.57 | $14.46 | $30,090 |
| Hilton Head Island-Bluffton-Beaufort, SC | 11,380 | 150.71 | 1.50 | $17.14 | $35,640 |
| Sebastian-Vero Beach, FL | 7,550 | 147.52 | 1.47 | $17.15 | $35,670 |
| Crestview-Fort Walton Beach-Destin, FL | 16,190 | 146.40 | 1.46 | $16.00 | $33,270 |
| Punta Gorda, FL | 6,820 | 145.22 | 1.45 | $16.61 | $34,550 |
| Dothan, AL | 8,190 | 142.03 | 1.41 | $14.49 | $30,150 |
| Deltona-Daytona Beach-Ormond Beach, FL | 27,610 | 140.52 | 1.40 | $15.42 | $32,060 |
| Jacksonville, NC | 6,600 | 140.37 | 1.40 | $14.26 | $29,660 |
| Muskegon, MI | 8,950 | 140.30 | 1.40 | $14.77 | $30,710 |
Top paying metropolitan areas for this occupation:
| Metropolitan area | Employment (1) | Employment per thousand jobs | Location quotient (9) | Hourly mean wage | Annual mean wage (2) |
|---|---|---|---|---|---|
| San Jose-Sunnyvale-Santa Clara, CA | 99,780 | 89.15 | 0.89 | $27.92 | $58,070 |
| Bridgeport-Stamford-Norwalk, CT | 44,570 | 107.13 | 1.07 | $27.29 | $56,760 |
| New York-Newark-Jersey City, NY-NJ-PA | 953,190 | 100.35 | 1.00 | $27.03 | $56,210 |
| San Francisco-Oakland-Hayward, CA | 216,350 | 89.44 | 0.89 | $25.95 | $53,970 |
| Boulder, CO | 17,930 | 98.40 | 0.98 | $25.77 | $53,600 |
| Trenton, NJ | 19,910 | 86.03 | 0.86 | $25.06 | $52,120 |
| Denver-Aurora-Lakewood, CO | 167,910 | 113.59 | 1.13 | $24.93 | $51,850 |
| Boston-Cambridge-Nashua, MA-NH | 247,120 | 89.58 | 0.89 | $24.80 | $51,590 |
| Seattle-Tacoma-Bellevue, WA | 184,200 | 92.83 | 0.92 | $24.39 | $50,740 |
| Midland, TX | 9,900 | 97.51 | 0.97 | $24.17 | $50,270 |
Nonmetropolitan areas with the highest employment in this occupation:
| Nonmetropolitan area | Employment (1) | Employment per thousand jobs | Location quotient (9) | Hourly mean wage | Annual mean wage (2) |
|---|---|---|---|---|---|
| Kansas nonmetropolitan area | 33,360 | 85.04 | 0.85 | $16.09 | $33,470 |
| North Northeastern Ohio non-metropolitan area (non-contiguous) | 30,010 | 89.62 | 0.89 | $17.12 | $35,610 |
| North Texas Region of Texas nonmetropolitan area | 25,560 | 93.96 | 0.94 | $15.89 | $33,050 |
| Piedmont North Carolina nonmetropolitan area | 25,120 | 96.97 | 0.97 | $15.59 | $32,430 |
| Southeast Coastal North Carolina nonmetropolitan area | 24,330 | 97.56 | 0.97 | $13.94 | $28,990 |
Nonmetropolitan areas with the highest concentration of jobs and location quotients in this occupation:
| Nonmetropolitan area | Employment (1) | Employment per thousand jobs | Location quotient (9) | Hourly mean wage | Annual mean wage (2) |
|---|---|---|---|---|---|
| Southwest Missouri nonmetropolitan area | 9,930 | 131.29 | 1.31 | $14.96 | $31,120 |
| Northern New Hampshire nonmetropolitan area | 4,700 | 130.93 | 1.30 | $16.59 | $34,510 |
| Northeast Lower Peninsula of Michigan nonmetropolitan area | 9,020 | 120.58 | 1.20 | $15.44 | $32,120 |
| Southwest Colorado nonmetropolitan area | 11,790 | 119.10 | 1.19 | $17.26 | $35,900 |
| Northeast Coastal North Carolina nonmetropolitan area | 11,170 | 118.82 | 1.18 | $14.96 | $31,120 |
Top paying nonmetropolitan areas for this occupation:
| Nonmetropolitan area | Employment (1) | Employment per thousand jobs | Location quotient (9) | Hourly mean wage | Annual mean wage (2) |
|---|---|---|---|---|---|
| West North Dakota nonmetropolitan area | 9,690 | 79.94 | 0.80 | $20.57 | $42,780 |
| Northwest Colorado nonmetropolitan area | 13,950 | 116.12 | 1.16 | $20.21 | $42,030 |
| Connecticut nonmetropolitan area | 2,780 | 84.14 | 0.84 | $19.84 | $41,260 |
| West Texas Region of Texas nonmetropolitan area | 17,350 | 89.18 | 0.89 | $19.71 | $41,000 |
| Northern Vermont nonmetropolitan area | 6,390 | 89.86 | 0.89 | $19.57 | $40,700 |
These estimates are calculated with data collected from employers in all industry sectors, all metropolitan and nonmetropolitan areas, and all states and the District of Columbia.
The percentile wage estimate is the value of a wage below which a certain percent of workers fall. The median wage is the 50th percentile wage estimate--50 percent of workers earn less than the median and 50 percent of workers earn more than the median. More about percentile wages.
(1) Estimates for detailed occupations do not sum to the totals because the totals include occupations not shown separately. Estimates do not include self-employed workers.
(2) Annual wages have been calculated by multiplying the hourly mean wage by a "year-round, full-time" hours figure of 2,080 hours; for those occupations where there is not an hourly wage published, the annual wage has been directly calculated from the reported survey data.
(3) The relative standard error (RSE) is a measure of the reliability of a survey statistic. The smaller the relative standard error, the more precise the estimate.
(9) The location quotient is the ratio of the area concentration of occupational employment to the national average concentration. A location quotient greater than one indicates the occupation has a higher share of employment than average, and a location quotient less than one indicates the occupation is less prevalent in the area than average.
Other OES estimates and related information:
May 2018 National Occupational Employment and Wage Estimates
May 2018 State Occupational Employment and Wage Estimates
May 2018 Metropolitan and Nonmetropolitan Area Occupational Employment and Wage Estimates
May 2018 National Industry-Specific Occupational Employment and Wage Estimates
Last Modified Date: March 29, 2019