
An official website of the United States government
An official website of the United States government
The .gov means it's official.
Federal government websites often end in .gov or .mil. Before sharing sensitive information,
make sure you're on a federal government site.
The site is secure.
The
https:// ensures that you are connecting to the official website and that any
information you provide is encrypted and transmitted securely.
| State | Employment |
|---|---|
California |
11,890 |
Texas |
1,900 |
Tennessee |
1,720 |
Wisconsin |
1,380 |
Florida |
1,240 |
New York |
1,100 |
Louisiana |
750 |
New Jersey |
740 |
Georgia |
720 |
Colorado |
550 |
| State | Employment |
|---|---|
Texas |
1,630 |
Louisiana |
940 |
California |
870 |
Alabama |
760 |
North Dakota |
710 |
Pennsylvania |
700 |
Ohio |
600 |
Georgia |
480 |
Tennessee |
410 |
Florida |
320 |
| State | Employment |
|---|---|
California |
13,640 |
New York |
10,370 |
Texas |
8,830 |
Florida |
7,420 |
North Carolina |
6,470 |
Ohio |
4,190 |
Illinois |
4,100 |
Michigan |
3,750 |
Georgia |
3,750 |
Pennsylvania |
3,640 |
| State | Employment |
|---|---|
Texas |
5,510 |
Oklahoma |
1,500 |
North Dakota |
1,110 |
Colorado |
920 |
Pennsylvania |
600 |
Kansas |
590 |
West Virginia |
480 |
Wyoming |
410 |
Ohio |
290 |
New Mexico |
260 |
| State | Employment |
|---|---|
Texas |
2,890 |
Louisiana |
1,100 |
North Dakota |
680 |
Oklahoma |
550 |
New Jersey |
450 |
California |
450 |
Colorado |
400 |
Massachusetts |
280 |
Florida |
250 |
Pennsylvania |
200 |
| State | Employment |
|---|---|
Pennsylvania |
540 |
Massachusetts |
250 |
Oklahoma |
230 |
Texas |
220 |
West Virginia |
190 |
Ohio |
190 |
North Dakota |
170 |
New Jersey |
160 |
Tennessee |
130 |
Colorado |
130 |
| State | Employment |
|---|---|
California |
263,730 |
Texas |
180,680 |
Florida |
140,540 |
New York |
111,920 |
Pennsylvania |
92,520 |
Illinois |
88,090 |
Ohio |
86,150 |
North Carolina |
67,740 |
New Jersey |
65,580 |
Michigan |
63,130 |
| State | Employment |
|---|---|
California |
98,280 |
Illinois |
45,080 |
New Jersey |
39,160 |
Florida |
33,630 |
Texas |
31,740 |
North Carolina |
26,020 |
Georgia |
25,590 |
Ohio |
25,310 |
Pennsylvania |
24,360 |
Michigan |
22,630 |
| State | Employment |
|---|---|
California |
7,350 |
Texas |
5,550 |
Pennsylvania |
4,610 |
Indiana |
3,760 |
Oregon |
3,250 |
Georgia |
2,580 |
Tennessee |
2,000 |
Arkansas |
1,930 |
Virginia |
1,880 |
North Carolina |
1,690 |
| State | Employment |
|---|---|
California |
393,460 |
Texas |
204,030 |
Illinois |
181,540 |
Florida |
156,120 |
Pennsylvania |
147,080 |
New Jersey |
133,980 |
New York |
132,350 |
Georgia |
127,990 |
Ohio |
118,130 |
North Carolina |
95,610 |
| State | Employment |
|---|---|
California |
59,010 |
Texas |
36,530 |
Florida |
26,980 |
New York |
20,360 |
Illinois |
15,330 |
Pennsylvania |
12,580 |
Ohio |
11,910 |
Michigan |
10,960 |
North Carolina |
10,060 |
New Jersey |
9,800 |
| State | Employment |
|---|---|
Texas |
68,830 |
California |
64,760 |
Georgia |
36,650 |
Pennsylvania |
32,570 |
Ohio |
32,510 |
Illinois |
31,090 |
North Carolina |
23,530 |
Florida |
23,480 |
Michigan |
22,520 |
Indiana |
20,940 |
| State | Employment |
|---|---|
Illinois |
260 |
Maryland |
160 |
Ohio |
140 |
Indiana |
130 |
Virginia |
120 |
Alabama |
120 |
Washington |
110 |
Oregon |
110 |
Minnesota |
110 |
Michigan |
110 |
| State | Employment |
|---|---|
Louisiana |
190 |
Missouri |
100 |
Florida |
100 |
Minnesota |
90 |
California |
90 |
New Jersey |
70 |
Ohio |
60 |
Indiana |
60 |
Nebraska |
40 |
Massachusetts |
40 |
| State | Employment |
|---|---|
Texas |
6,420 |
California |
3,530 |
Florida |
2,810 |
Pennsylvania |
2,700 |
Louisiana |
2,600 |
Ohio |
1,770 |
Indiana |
1,760 |
Virginia |
1,550 |
Illinois |
1,480 |
Washington |
1,380 |
| State | Employment |
|---|---|
California |
2,180 |
Texas |
1,840 |
Pennsylvania |
1,460 |
Illinois |
1,180 |
Ohio |
1,120 |
Kansas |
1,090 |
New York |
930 |
Iowa |
860 |
Indiana |
740 |
South Dakota |
710 |
| State | Employment |
|---|---|
Texas |
5,240 |
California |
2,120 |
Florida |
2,080 |
Colorado |
1,800 |
Georgia |
1,790 |
Louisiana |
1,400 |
Nevada |
1,330 |
New York |
1,200 |
Washington |
1,120 |
Tennessee |
870 |
| State | Employment |
|---|---|
Florida |
4,310 |
New York |
4,210 |
California |
3,960 |
Hawaii |
1,720 |
Michigan |
1,660 |
Illinois |
1,340 |
District of Columbia |
970 |
Washington |
910 |
Utah |
890 |
Louisiana |
610 |
| State | Employment |
|---|---|
New York |
4,520 |
Texas |
4,250 |
California |
3,080 |
Florida |
1,610 |
Georgia |
1,250 |
Pennsylvania |
980 |
Ohio |
880 |
Virginia |
700 |
Massachusetts |
680 |
Washington |
660 |
| State | Employment |
|---|---|
New York |
1,400 |
Florida |
800 |
California |
690 |
Tennessee |
620 |
Texas |
500 |
Massachusetts |
270 |
Georgia |
240 |
North Carolina |
200 |
Maryland |
200 |
Virginia |
180 |
| State | Employment |
|---|---|
Texas |
11,990 |
New Jersey |
11,220 |
California |
6,760 |
Oregon |
6,580 |
Florida |
5,770 |
New York |
4,280 |
Ohio |
3,730 |
Georgia |
3,610 |
Michigan |
3,570 |
Tennessee |
3,280 |
| State | Employment |
|---|---|
California |
23,580 |
Florida |
16,320 |
New York |
14,740 |
Texas |
10,180 |
Pennsylvania |
6,180 |
Illinois |
5,790 |
New Jersey |
5,670 |
Ohio |
5,010 |
Massachusetts |
4,140 |
Arizona |
4,120 |
| State | Employment |
|---|---|
Louisiana |
440 |
Illinois |
300 |
New York |
270 |
Florida |
180 |
Texas |
160 |
Wisconsin |
140 |
Pennsylvania |
130 |
Ohio |
120 |
New Jersey |
100 |
Mississippi |
70 |
| State | Employment |
|---|---|
Florida |
1,520 |
Virginia |
1,320 |
Washington |
1,170 |
Louisiana |
730 |
New York |
580 |
Kentucky |
330 |
California |
310 |
Pennsylvania |
270 |
Tennessee |
260 |
Alaska |
250 |
| State | Employment |
|---|---|
Florida |
310 |
Texas |
290 |
Virginia |
100 |
Oregon |
90 |
Washington |
70 |
California |
70 |
New York |
50 |
Louisiana |
50 |
Puerto Rico |
40 |
Wisconsin |
40 |
| State | Employment |
|---|---|
Louisiana |
5,770 |
Florida |
4,850 |
Texas |
2,520 |
New York |
2,070 |
Washington |
2,010 |
California |
1,790 |
Virginia |
1,570 |
Tennessee |
1,430 |
Kentucky |
1,370 |
Hawaii |
1,270 |
| State | Employment |
|---|---|
Louisiana |
7,340 |
Washington |
3,500 |
Florida |
3,130 |
Texas |
2,570 |
Virginia |
1,960 |
California |
1,700 |
New York |
1,640 |
Kentucky |
1,340 |
Illinois |
730 |
Alaska |
730 |
| State | Employment |
|---|---|
California |
610 |
New Jersey |
280 |
Maryland |
130 |
Illinois |
80 |
West Virginia |
70 |
Kentucky |
70 |
Tennessee |
60 |
| State | Employment |
|---|---|
California |
1,730 |
Maryland |
530 |
Colorado |
260 |
Georgia |
240 |
New Jersey |
90 |
| State | Employment |
|---|---|
New York |
6,170 |
Texas |
3,890 |
Pennsylvania |
3,170 |
Illinois |
2,790 |
California |
1,660 |
Ohio |
1,570 |
Indiana |
1,370 |
Missouri |
1,330 |
Minnesota |
1,170 |
Georgia |
1,100 |
| State | Employment |
|---|---|
Illinois |
1,040 |
New York |
650 |
Pennsylvania |
460 |
Wisconsin |
430 |
California |
420 |
Indiana |
310 |
Louisiana |
300 |
Washington |
250 |
Ohio |
230 |
Wyoming |
220 |
| State | Employment |
|---|---|
California |
890 |
Texas |
560 |
Pennsylvania |
410 |
Georgia |
210 |
Oklahoma |
170 |
Kansas |
160 |
Indiana |
160 |
Arkansas |
130 |
New York |
110 |
Tennessee |
90 |
| State | Employment |
|---|---|
Illinois |
1,940 |
California |
1,770 |
Texas |
1,760 |
Pennsylvania |
1,700 |
New York |
1,650 |
New Jersey |
1,540 |
Missouri |
1,350 |
Iowa |
1,200 |
Indiana |
1,140 |
Minnesota |
840 |
| State | Employment |
|---|---|
California |
5,590 |
North Carolina |
3,690 |
Colorado |
3,320 |
New York |
3,300 |
Ohio |
2,860 |
Texas |
2,630 |
Washington |
2,500 |
Florida |
2,380 |
Michigan |
2,090 |
Virginia |
1,780 |
| State | Employment |
|---|---|
New York |
67,150 |
California |
56,120 |
Texas |
46,180 |
Pennsylvania |
38,190 |
Florida |
29,820 |
Illinois |
28,370 |
Virginia |
24,250 |
Massachusetts |
23,340 |
New Jersey |
23,220 |
Georgia |
20,930 |
| State | Employment |
|---|---|
California |
30,750 |
New York |
18,600 |
Illinois |
11,190 |
Florida |
10,900 |
Texas |
10,620 |
New Jersey |
7,160 |
Pennsylvania |
6,660 |
Washington |
5,850 |
Massachusetts |
5,190 |
Virginia |
5,180 |
| State | Employment |
|---|---|
California |
110,370 |
Texas |
67,250 |
Florida |
54,840 |
Illinois |
52,530 |
New York |
47,210 |
Pennsylvania |
38,100 |
Ohio |
34,720 |
New Jersey |
32,030 |
Georgia |
30,520 |
North Carolina |
29,080 |
| State | Employment |
|---|---|
Texas |
199,500 |
California |
146,730 |
Florida |
92,530 |
Pennsylvania |
86,370 |
Ohio |
77,150 |
Illinois |
73,320 |
Tennessee |
63,790 |
New York |
63,090 |
Georgia |
63,010 |
Michigan |
60,490 |
| State | Employment |
|---|---|
Texas |
44,690 |
California |
43,980 |
Ohio |
30,370 |
Florida |
30,130 |
New York |
20,110 |
North Carolina |
19,850 |
Georgia |
16,080 |
Illinois |
14,860 |
Pennsylvania |
13,870 |
Virginia |
13,530 |
| State | Employment |
|---|---|
California |
1,310 |
Pennsylvania |
1,150 |
New York |
990 |
Georgia |
990 |
Texas |
850 |
South Carolina |
770 |
Florida |
700 |
Ohio |
560 |
Illinois |
560 |
Tennessee |
490 |
| State | Employment |
|---|---|
California |
16,540 |
New York |
10,820 |
Illinois |
10,700 |
Florida |
10,670 |
North Carolina |
4,310 |
Colorado |
4,300 |
Washington |
4,250 |
Michigan |
3,700 |
Minnesota |
3,420 |
Nevada |
3,180 |
| State | Employment |
|---|---|
California |
1,830 |
Texas |
1,300 |
Florida |
790 |
Missouri |
430 |
New York |
400 |
Kentucky |
380 |
Georgia |
370 |
Michigan |
320 |
Pennsylvania |
210 |
South Carolina |
190 |
| State | Employment |
|---|---|
California |
2,210 |
Texas |
1,890 |
New York |
1,220 |
Georgia |
970 |
Illinois |
930 |
Colorado |
750 |
Ohio |
720 |
Tennessee |
640 |
Indiana |
610 |
Minnesota |
580 |
| State | Employment |
|---|---|
Texas |
4,380 |
California |
4,030 |
Florida |
3,940 |
North Carolina |
1,480 |
Arizona |
1,440 |
Georgia |
1,370 |
Ohio |
1,170 |
Michigan |
1,140 |
Washington |
1,120 |
New York |
1,090 |
| State | Employment |
|---|---|
California |
10,340 |
Illinois |
7,270 |
New York |
6,940 |
Florida |
5,290 |
Colorado |
3,660 |
Minnesota |
3,520 |
Michigan |
3,050 |
Washington |
2,900 |
North Carolina |
2,270 |
Arizona |
2,090 |
| State | Employment |
|---|---|
California |
50,040 |
Texas |
40,170 |
Florida |
24,120 |
New York |
23,830 |
Pennsylvania |
21,030 |
New Jersey |
18,780 |
Georgia |
17,430 |
Ohio |
16,800 |
Illinois |
16,470 |
North Carolina |
15,870 |
| State | Employment |
|---|---|
California |
1,140 |
Texas |
1,080 |
Florida |
800 |
Kentucky |
790 |
Illinois |
610 |
New York |
370 |
Pennsylvania |
340 |
Georgia |
300 |
Missouri |
280 |
Arizona |
230 |
| State | Employment |
|---|---|
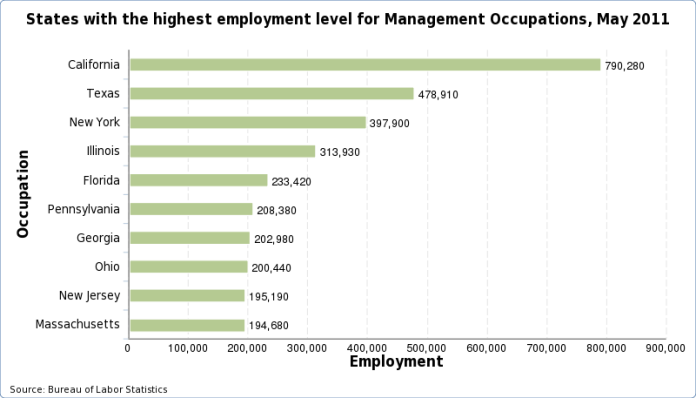
California |
1,453,200 |
Texas |
1,049,310 |
Florida |
708,190 |
New York |
631,580 |
Illinois |
611,700 |
Pennsylvania |
554,580 |
Ohio |
488,950 |
Georgia |
450,020 |
New Jersey |
449,660 |
North Carolina |
400,610 |
| State | Employment |
|---|---|
California |
27,860 |
Tennessee |
19,000 |
Illinois |
17,860 |
Georgia |
11,490 |
Texas |
11,210 |
Ohio |
11,070 |
Louisiana |
9,390 |
Florida |
8,740 |
Oregon |
6,540 |
Michigan |
6,470 |
| State | Employment |
|---|---|
Texas |
33,760 |
California |
26,810 |
Alabama |
17,370 |
Indiana |
16,760 |
Illinois |
13,980 |
Ohio |
13,670 |
North Carolina |
13,430 |
Pennsylvania |
11,560 |
Michigan |
11,430 |
Georgia |
9,520 |
| State | Employment |
|---|---|
South Carolina |
3,970 |
Oklahoma |
1,930 |
Tennessee |
1,870 |
North Carolina |
1,610 |
Georgia |
1,450 |
Illinois |
1,100 |
Ohio |
780 |
Virginia |
590 |
Iowa |
520 |
Pennsylvania |
380 |
| State | Employment |
|---|---|
Wisconsin |
9,260 |
Pennsylvania |
6,920 |
Texas |
5,720 |
Georgia |
5,630 |
Ohio |
5,610 |
California |
5,460 |
North Carolina |
4,540 |
Illinois |
4,320 |
New York |
4,100 |
Missouri |
3,910 |
| State | Employment |
|---|---|
California |
4,690 |
Texas |
3,530 |
Ohio |
3,260 |
Pennsylvania |
3,050 |
Michigan |
2,550 |
Florida |
2,150 |
Indiana |
1,770 |
Massachusetts |
1,640 |
Missouri |
1,500 |
Wisconsin |
1,230 |
| State | Employment |
|---|---|
Texas |
1,300 |
California |
790 |
Massachusetts |
730 |
Utah |
650 |
Ohio |
530 |
Illinois |
460 |
Tennessee |
370 |
New Jersey |
360 |
Minnesota |
300 |
Florida |
300 |
| State | Employment |
|---|---|
California |
1,280 |
Texas |
600 |
Iowa |
580 |
Minnesota |
420 |
Pennsylvania |
410 |
Georgia |
390 |
Missouri |
380 |
Ohio |
360 |
Arkansas |
310 |
Mississippi |
260 |
| State | Employment |
|---|---|
California |
1,980 |
Texas |
1,810 |
Ohio |
1,040 |
New Jersey |
750 |
Michigan |
750 |
Missouri |
660 |
Pennsylvania |
640 |
Tennessee |
540 |
Illinois |
510 |
New York |
500 |
| State | Employment |
|---|---|
Virginia |
1,020 |
California |
990 |
Ohio |
960 |
North Carolina |
800 |
Oregon |
740 |
Indiana |
720 |
Pennsylvania |
640 |
Washington |
620 |
Texas |
610 |
Massachusetts |
560 |
| State | Employment |
|---|---|
California |
2,690 |
Michigan |
2,400 |
Texas |
2,090 |
Ohio |
1,930 |
Illinois |
1,210 |
Wisconsin |
1,200 |
Minnesota |
1,170 |
New York |
880 |
Pennsylvania |
770 |
Kansas |
770 |
| State | Employment |
|---|---|
Wisconsin |
13,710 |
Ohio |
13,150 |
California |
13,140 |
Pennsylvania |
11,020 |
Texas |
9,900 |
Michigan |
8,630 |
Illinois |
6,520 |
Indiana |
6,190 |
Missouri |
4,860 |
New York |
4,440 |
| State | Employment |
|---|---|
California |
2,180 |
New York |
870 |
Minnesota |
740 |
Texas |
700 |
Florida |
650 |
Illinois |
520 |
Georgia |
430 |
Tennessee |
410 |
Ohio |
390 |
Wisconsin |
380 |
| State | Employment |
|---|---|
California |
5,010 |
Texas |
4,090 |
Oregon |
4,060 |
North Carolina |
1,910 |
New Mexico |
1,130 |
Colorado |
950 |
Ohio |
830 |
Massachusetts |
660 |
Pennsylvania |
580 |
New Jersey |
270 |
| State | Employment |
|---|---|
Texas |
13,910 |
California |
12,960 |
Indiana |
8,660 |
Ohio |
7,630 |
Wisconsin |
6,470 |
Pennsylvania |
6,190 |
Michigan |
6,150 |
Illinois |
5,400 |
Florida |
5,270 |
North Carolina |
4,850 |
| State | Employment |
|---|---|
California |
1,200 |
Texas |
940 |
New York |
920 |
Missouri |
760 |
Tennessee |
730 |
Illinois |
630 |
Indiana |
560 |
Florida |
560 |
New Jersey |
470 |
Massachusetts |
440 |
| State | Employment |
|---|---|
California |
47,860 |
Wisconsin |
24,360 |
Texas |
22,970 |
Pennsylvania |
19,320 |
New York |
18,860 |
Ohio |
18,350 |
Florida |
18,110 |
Illinois |
17,410 |
North Carolina |
15,120 |
Michigan |
14,710 |
| State | Employment |
|---|---|
California |
3,290 |
Texas |
2,940 |
Florida |
2,930 |
New York |
2,850 |
Ohio |
1,510 |
Illinois |
1,140 |
Washington |
1,090 |
Minnesota |
1,010 |
Pennsylvania |
890 |
Michigan |
890 |
| State | Employment |
|---|---|
California |
1,350 |
New Jersey |
940 |
Ohio |
810 |
Texas |
750 |
Michigan |
720 |
Illinois |
690 |
Pennsylvania |
630 |
Florida |
590 |
Georgia |
580 |
Indiana |
520 |
| State | Employment |
|---|---|
California |
4,960 |
Florida |
2,410 |
Texas |
2,220 |
New York |
1,730 |
Michigan |
1,580 |
Pennsylvania |
1,440 |
Georgia |
1,280 |
Wisconsin |
1,210 |
Ohio |
1,170 |
Illinois |
1,170 |
| State | Employment |
|---|---|
New York |
4,500 |
California |
2,660 |
Texas |
1,930 |
Florida |
1,370 |
Rhode Island |
780 |
Illinois |
750 |
Michigan |
720 |
New Jersey |
600 |
Pennsylvania |
570 |
Louisiana |
540 |
| State | Employment |
|---|---|
California |
58,360 |
Texas |
52,250 |
Michigan |
32,890 |
Ohio |
32,450 |
Illinois |
29,730 |
New York |
22,760 |
Pennsylvania |
21,120 |
North Carolina |
20,620 |
Georgia |
20,500 |
Indiana |
20,330 |
| State | Employment |
|---|---|
Ohio |
1,510 |
Georgia |
1,140 |
North Carolina |
1,130 |
Texas |
840 |
Indiana |
840 |
California |
830 |
Alabama |
780 |
Kentucky |
740 |
Minnesota |
730 |
Michigan |
720 |
| State | Employment |
|---|---|
Ohio |
6,900 |
Texas |
5,440 |
California |
4,960 |
New Jersey |
3,610 |
North Carolina |
3,500 |
Michigan |
3,400 |
Indiana |
3,020 |
New York |
2,900 |
Alabama |
2,680 |
Pennsylvania |
2,580 |
| State | Employment |
|---|---|
California |
4,220 |
North Carolina |
3,800 |
Texas |
3,310 |
Illinois |
3,280 |
Ohio |
2,740 |
Pennsylvania |
2,450 |
Wisconsin |
2,340 |
Indiana |
2,340 |
New York |
2,010 |
New Jersey |
1,890 |
| State | Employment |
|---|---|
California |
1,690 |
North Carolina |
1,270 |
Georgia |
640 |
Texas |
490 |
New Jersey |
420 |
Pennsylvania |
380 |
New York |
380 |
Ohio |
330 |
Alabama |
310 |
Wisconsin |
280 |
| State | Employment |
|---|---|
California |
12,200 |
Ohio |
7,660 |
Texas |
7,370 |
Illinois |
6,480 |
North Carolina |
6,100 |
New York |
5,570 |
Georgia |
5,490 |
Indiana |
5,280 |
Florida |
5,250 |
Wisconsin |
5,230 |
| State | Employment |
|---|---|
California |
3,770 |
Wisconsin |
2,950 |
Texas |
2,440 |
Ohio |
1,840 |
New York |
1,680 |
Michigan |
1,480 |
Pennsylvania |
1,320 |
Indiana |
1,110 |
Georgia |
850 |
North Carolina |
820 |
| State | Employment |
|---|---|
California |
3,130 |
Texas |
2,590 |
Ohio |
1,800 |
New York |
1,440 |
Iowa |
1,280 |
Pennsylvania |
1,260 |
New Jersey |
1,160 |
Minnesota |
1,130 |
Alabama |
940 |
Illinois |
930 |
| State | Employment |
|---|---|
California |
8,810 |
Texas |
3,480 |
Pennsylvania |
2,450 |
Colorado |
2,130 |
New York |
2,100 |
North Carolina |
1,780 |
Ohio |
1,610 |
Oregon |
1,600 |
Wisconsin |
1,550 |
Michigan |
1,540 |
| State | Employment |
|---|---|
Texas |
14,480 |
Ohio |
5,970 |
Pennsylvania |
4,620 |
Michigan |
4,120 |
New Jersey |
3,840 |
California |
3,570 |
Missouri |
3,360 |
Illinois |
3,020 |
New York |
2,950 |
Tennessee |
2,830 |
| State | Employment |
|---|---|
California |
1,590 |
Louisiana |
1,300 |
Texas |
1,290 |
Colorado |
830 |
Florida |
580 |
Massachusetts |
460 |
Iowa |
400 |
Maryland |
380 |
Montana |
370 |
Tennessee |
360 |
| State | Employment |
|---|---|
Texas |
11,170 |
Louisiana |
5,710 |
California |
4,360 |
Oklahoma |
1,980 |
Pennsylvania |
1,900 |
Ohio |
1,070 |
Kansas |
1,020 |
Illinois |
840 |
Mississippi |
830 |
New Mexico |
820 |
| State | Employment |
|---|---|
Texas |
3,670 |
California |
890 |
Pennsylvania |
810 |
Oklahoma |
560 |
Michigan |
480 |
Louisiana |
470 |
Illinois |
450 |
Wyoming |
410 |
Ohio |
410 |
Kentucky |
380 |
| State | Employment |
|---|---|
Texas |
5,740 |
Louisiana |
5,040 |
California |
1,560 |
Minnesota |
1,460 |
South Carolina |
1,270 |
Ohio |
1,110 |
Alabama |
1,070 |
Florida |
1,030 |
Maryland |
910 |
Iowa |
810 |
| State | Employment |
|---|---|
California |
11,400 |
Texas |
10,880 |
Florida |
7,610 |
Pennsylvania |
5,330 |
New York |
5,140 |
Ohio |
4,660 |
Illinois |
4,590 |
Georgia |
3,530 |
North Carolina |
3,460 |
Indiana |
3,430 |
| State | Employment |
|---|---|
New York |
4,300 |
California |
3,270 |
Pennsylvania |
2,170 |
Texas |
1,900 |
Illinois |
1,720 |
Maryland |
1,650 |
Minnesota |
1,520 |
New Jersey |
1,400 |
Ohio |
1,020 |
Virginia |
930 |
| State | Employment |
|---|---|
California |
3,820 |
Texas |
2,930 |
New York |
1,930 |
Michigan |
1,770 |
Pennsylvania |
1,590 |
Florida |
1,310 |
Illinois |
1,190 |
Ohio |
1,010 |
Minnesota |
930 |
Massachusetts |
910 |
| State | Employment |
|---|---|
California |
1,150 |
Texas |
900 |
Ohio |
830 |
Pennsylvania |
550 |
Illinois |
470 |
Georgia |
470 |
Massachusetts |
420 |
Alabama |
380 |
Virginia |
370 |
Michigan |
370 |
| State | Employment |
|---|---|
New York |
380 |
North Carolina |
360 |
Pennsylvania |
330 |
Michigan |
280 |
Illinois |
270 |
Tennessee |
240 |
Louisiana |
180 |
| State | Employment |
|---|---|
Tennessee |
1,180 |
California |
950 |
Oregon |
840 |
Texas |
620 |
Ohio |
260 |
Florida |
260 |
Alabama |
260 |
Missouri |
240 |
Indiana |
180 |
Maryland |
160 |
| State | Employment |
|---|---|
North Carolina |
6,660 |
Wisconsin |
5,630 |
California |
4,280 |
Texas |
4,150 |
Indiana |
4,090 |
Ohio |
3,800 |
Georgia |
3,730 |
Pennsylvania |
3,710 |
Michigan |
2,650 |
Iowa |
2,550 |
| State | Employment |
|---|---|
Texas |
3,980 |
North Carolina |
3,290 |
Oregon |
2,990 |
California |
2,950 |
Pennsylvania |
2,500 |
Georgia |
2,370 |
Alabama |
2,330 |
Washington |
2,170 |
Missouri |
2,170 |
Wisconsin |
1,830 |
| State | Employment |
|---|---|
Michigan |
70 |
| State | Employment |
|---|---|
Michigan |
60 |
Georgia |
40 |
| State | Employment |
|---|---|
California |
1,510 |
North Carolina |
1,250 |
Indiana |
1,170 |
Texas |
1,160 |
Pennsylvania |
1,050 |
New York |
860 |
Ohio |
810 |
Florida |
770 |
Minnesota |
560 |
Illinois |
540 |
| State | Employment |
|---|---|
California |
9,260 |
Texas |
8,900 |
Indiana |
5,290 |
Florida |
4,790 |
Pennsylvania |
4,570 |
Ohio |
4,400 |
New York |
4,210 |
Wisconsin |
3,430 |
Illinois |
3,200 |
North Carolina |
3,100 |
| State | Employment |
|---|---|
North Carolina |
1,660 |
California |
1,620 |
Georgia |
1,120 |
Tennessee |
1,110 |
Utah |
1,040 |
Texas |
790 |
New Jersey |
690 |
Mississippi |
640 |
Maryland |
490 |
Pennsylvania |
400 |
| State | Employment |
|---|---|
North Carolina |
6,090 |
Mississippi |
3,200 |
California |
2,760 |
Texas |
1,910 |
Indiana |
1,700 |
Florida |
1,580 |
Illinois |
860 |
Tennessee |
820 |
Michigan |
710 |
New York |
640 |
| State | Employment |
|---|---|
California |
1,590 |
New York |
1,200 |
New Jersey |
330 |
Florida |
280 |
North Carolina |
220 |
Pennsylvania |
110 |
Ohio |
100 |
Georgia |
70 |
Tennessee |
60 |
South Carolina |
60 |
| State | Employment |
|---|---|
South Carolina |
2,860 |
North Carolina |
2,670 |
Georgia |
2,460 |
Alabama |
1,030 |
Texas |
1,000 |
Ohio |
890 |
Indiana |
770 |
California |
720 |
Michigan |
580 |
Pennsylvania |
430 |
| State | Employment |
|---|---|
Georgia |
12,070 |
North Carolina |
6,750 |
South Carolina |
2,660 |
Alabama |
2,480 |
Virginia |
1,410 |
Tennessee |
620 |
Pennsylvania |
610 |
Florida |
370 |
California |
370 |
Arkansas |
340 |
| State | Employment |
|---|---|
North Carolina |
4,520 |
Georgia |
4,040 |
South Carolina |
2,930 |
California |
1,290 |
Alabama |
1,170 |
Pennsylvania |
1,060 |
Wisconsin |
760 |
New York |
760 |
Virginia |
590 |
Tennessee |
540 |
| State | Employment |
|---|---|
Georgia |
1,640 |
California |
1,300 |
North Carolina |
1,200 |
Mississippi |
800 |
Tennessee |
780 |
Texas |
750 |
Illinois |
690 |
South Carolina |
530 |
Michigan |
520 |
New York |
500 |
| State | Employment |
|---|---|
North Carolina |
2,020 |
California |
1,420 |
Georgia |
1,410 |
South Carolina |
1,160 |
Massachusetts |
320 |
Virginia |
260 |
Tennessee |
240 |
Pennsylvania |
200 |
New Jersey |
150 |
Illinois |
150 |
| State | Employment |
|---|---|
California |
3,350 |
Texas |
2,280 |
Florida |
2,140 |
New York |
1,470 |
Ohio |
950 |
North Carolina |
890 |
Pennsylvania |
690 |
New Jersey |
670 |
Maryland |
590 |
Indiana |
590 |
| State | Employment |
|---|---|
California |
720 |
New York |
440 |
Texas |
290 |
Pennsylvania |
290 |
Utah |
280 |
Illinois |
240 |
Virginia |
170 |
Massachusetts |
160 |
Florida |
160 |
Ohio |
140 |
| State | Employment |
|---|---|
Texas |
830 |
Maine |
390 |
Florida |
100 |
Ohio |
80 |
New York |
70 |
California |
70 |
| State | Employment |
|---|---|
Texas |
1,390 |
California |
1,180 |
New York |
670 |
Illinois |
510 |
Michigan |
410 |
Missouri |
370 |
Ohio |
360 |
Wisconsin |
230 |
North Carolina |
220 |
Georgia |
160 |
| State | Employment |
|---|---|
California |
22,800 |
Texas |
10,240 |
North Carolina |
9,240 |
New York |
8,960 |
Georgia |
6,900 |
Florida |
5,690 |
Pennsylvania |
4,790 |
Puerto Rico |
4,690 |
Tennessee |
4,050 |
Ohio |
4,030 |
| State | Employment |
|---|---|
California |
6,560 |
Texas |
4,860 |
Florida |
3,110 |
Pennsylvania |
1,690 |
Georgia |
1,660 |
Virginia |
1,540 |
New York |
1,520 |
North Carolina |
1,100 |
Ohio |
1,090 |
Illinois |
910 |
| State | Employment |
|---|---|
California |
16,540 |
Florida |
15,770 |
New York |
15,640 |
Texas |
14,590 |
Illinois |
8,450 |
Ohio |
8,090 |
New Jersey |
6,880 |
Pennsylvania |
6,640 |
Michigan |
6,520 |
Georgia |
6,140 |
| State | Employment |
|---|---|
California |
3,790 |
Wisconsin |
3,440 |
Illinois |
3,160 |
Texas |
2,960 |
Minnesota |
2,490 |
Ohio |
2,390 |
Pennsylvania |
2,070 |
New Jersey |
1,920 |
New York |
1,840 |
Missouri |
1,640 |
| State | Employment |
|---|---|
California |
14,860 |
Texas |
10,600 |
Illinois |
10,260 |
New York |
9,460 |
Wisconsin |
9,370 |
Ohio |
9,090 |
Pennsylvania |
9,020 |
Florida |
7,570 |
Minnesota |
6,180 |
Georgia |
6,110 |
| State | Employment |
|---|---|
California |
3,470 |
Texas |
1,960 |
Ohio |
1,760 |
Illinois |
1,610 |
Wisconsin |
1,570 |
New York |
1,550 |
New Jersey |
1,200 |
Minnesota |
1,190 |
Pennsylvania |
1,150 |
Missouri |
1,030 |
| State | Employment |
|---|---|
Tennessee |
2,880 |
Michigan |
2,250 |
California |
2,090 |
Texas |
1,740 |
Ohio |
1,430 |
Pennsylvania |
1,140 |
Oregon |
760 |
Missouri |
750 |
Indiana |
750 |
Minnesota |
720 |
| State | Employment |
|---|---|
California |
680 |
Oregon |
400 |
Ohio |
370 |
Texas |
350 |
Michigan |
320 |
Alabama |
270 |
Pennsylvania |
230 |
Indiana |
220 |
New York |
210 |
Washington |
200 |
| State | Employment |
|---|---|
California |
5,690 |
Texas |
3,680 |
Ohio |
3,540 |
Michigan |
2,900 |
Illinois |
2,790 |
Indiana |
2,030 |
Pennsylvania |
1,860 |
Wisconsin |
1,650 |
Missouri |
1,560 |
North Carolina |
1,100 |
| State | Employment |
|---|---|
Virginia |
850 |
Maine |
810 |
Washington |
710 |
Kansas |
560 |
Alabama |
520 |
California |
440 |
Texas |
330 |
Tennessee |
220 |
Pennsylvania |
200 |
Florida |
190 |
| State | Employment |
|---|---|
Indiana |
2,110 |
Ohio |
1,810 |
Texas |
1,790 |
Michigan |
1,510 |
Pennsylvania |
1,470 |
Illinois |
1,190 |
California |
1,100 |
Wisconsin |
730 |
Kentucky |
610 |
Tennessee |
600 |
| State | Employment |
|---|---|
Indiana |
3,000 |
California |
2,790 |
Michigan |
2,700 |
Texas |
2,480 |
Tennessee |
2,060 |
Ohio |
1,810 |
Illinois |
1,700 |
Kentucky |
1,650 |
Iowa |
1,330 |
Massachusetts |
1,190 |
| State | Employment |
|---|---|
Texas |
50,790 |
California |
28,980 |
Ohio |
18,500 |
Pennsylvania |
17,430 |
Indiana |
16,550 |
Wisconsin |
15,730 |
Georgia |
14,810 |
Michigan |
14,390 |
Florida |
13,730 |
Illinois |
13,450 |
| State | Employment |
|---|---|
Michigan |
13,310 |
Ohio |
6,670 |
Illinois |
5,120 |
Indiana |
4,170 |
Pennsylvania |
3,960 |
Wisconsin |
3,740 |
California |
2,700 |
Tennessee |
2,650 |
Texas |
2,460 |
Washington |
2,270 |
| State | Employment |
|---|---|
Ohio |
16,800 |
Illinois |
13,740 |
Texas |
12,000 |
Pennsylvania |
9,750 |
Michigan |
9,440 |
Tennessee |
8,910 |
California |
5,890 |
Indiana |
5,480 |
South Carolina |
4,290 |
New York |
4,210 |
| State | Employment |
|---|---|
Michigan |
21,150 |
Ohio |
16,390 |
Indiana |
13,700 |
Wisconsin |
9,600 |
Illinois |
9,120 |
Texas |
8,880 |
California |
7,920 |
Pennsylvania |
7,320 |
North Carolina |
7,130 |
Missouri |
5,910 |
| State | Employment |
|---|---|
Ohio |
3,000 |
Michigan |
2,230 |
Wisconsin |
1,490 |
Pennsylvania |
1,270 |
Illinois |
890 |
Tennessee |
760 |
Indiana |
720 |
Alabama |
640 |
California |
600 |
Texas |
580 |
| State | Employment |
|---|---|
Wisconsin |
390 |
Michigan |
360 |
Ohio |
240 |
Illinois |
240 |
Indiana |
230 |
Alabama |
210 |
Pennsylvania |
190 |
Texas |
160 |
Tennessee |
150 |
North Carolina |
80 |
| State | Employment |
|---|---|
Michigan |
1,100 |
Illinois |
430 |
California |
300 |
Ohio |
240 |
Texas |
200 |
Tennessee |
200 |
Missouri |
160 |
Pennsylvania |
150 |
New York |
110 |
New Jersey |
100 |
| State | Employment |
|---|---|
Pennsylvania |
1,080 |
Ohio |
750 |
Indiana |
610 |
Illinois |
550 |
California |
490 |
Iowa |
410 |
Texas |
300 |
Alabama |
300 |
Kentucky |
270 |
Minnesota |
260 |
| State | Employment |
|---|---|
Pennsylvania |
1,680 |
Ohio |
1,550 |
Alabama |
1,390 |
Indiana |
1,190 |
Texas |
740 |
Michigan |
730 |
Tennessee |
640 |
Illinois |
580 |
Kentucky |
570 |
Wisconsin |
550 |
| State | Employment |
|---|---|
California |
36,120 |
Illinois |
30,010 |
Texas |
28,590 |
Michigan |
26,600 |
Ohio |
26,290 |
Indiana |
19,630 |
Pennsylvania |
17,000 |
New York |
13,630 |
North Carolina |
11,900 |
Wisconsin |
11,670 |
| State | Employment |
|---|---|
California |
2,390 |
Texas |
1,820 |
Tennessee |
1,210 |
Illinois |
960 |
Florida |
670 |
Massachusetts |
610 |
Pennsylvania |
530 |
New York |
460 |
Mississippi |
440 |
Indiana |
420 |
| State | Employment |
|---|---|
Michigan |
3,350 |
California |
3,060 |
Texas |
2,620 |
Ohio |
2,290 |
Indiana |
2,040 |
Illinois |
2,000 |
Pennsylvania |
1,280 |
New York |
1,030 |
Wisconsin |
970 |
North Carolina |
690 |
| State | Employment |
|---|---|
California |
8,180 |
Ohio |
6,480 |
Michigan |
6,160 |
Indiana |
5,290 |
Wisconsin |
4,360 |
Texas |
4,110 |
Illinois |
3,700 |
Pennsylvania |
3,490 |
Minnesota |
2,720 |
North Carolina |
2,420 |
| State | Employment |
|---|---|
California |
1,890 |
Texas |
1,150 |
Illinois |
1,060 |
Indiana |
720 |
Ohio |
680 |
Michigan |
570 |
Alabama |
500 |
New Jersey |
420 |
Tennessee |
340 |
Minnesota |
320 |
| State | Employment |
|---|---|
Michigan |
23,170 |
Ohio |
17,480 |
Indiana |
16,050 |
Texas |
14,970 |
California |
11,800 |
Wisconsin |
10,600 |
Illinois |
9,990 |
Tennessee |
7,500 |
Pennsylvania |
7,360 |
Alabama |
6,260 |
| State | Employment |
|---|---|
Ohio |
4,540 |
Texas |
1,730 |
Alabama |
1,620 |
Pennsylvania |
1,430 |
Kentucky |
1,330 |
California |
1,250 |
Michigan |
1,130 |
South Carolina |
930 |
Arkansas |
790 |
Virginia |
780 |
| State | Employment |
|---|---|
California |
1,610 |
Alabama |
1,550 |
Ohio |
1,480 |
South Carolina |
1,210 |
Tennessee |
1,120 |
Indiana |
1,070 |
Kentucky |
910 |
Michigan |
900 |
Texas |
810 |
Pennsylvania |
740 |
| State | Employment |
|---|---|
Ohio |
7,480 |
Texas |
5,880 |
California |
5,490 |
Indiana |
4,840 |
Wisconsin |
4,690 |
Pennsylvania |
4,540 |
North Carolina |
4,540 |
Georgia |
4,120 |
Michigan |
2,820 |
South Carolina |
2,540 |
| State | Employment |
|---|---|
California |
6,200 |
Arkansas |
4,080 |
Texas |
3,560 |
Ohio |
1,840 |
Louisiana |
1,760 |
Maryland |
1,640 |
North Carolina |
1,580 |
Colorado |
1,260 |
Virginia |
1,080 |
Kentucky |
1,080 |
| State | Employment |
|---|---|
California |
3,660 |
Texas |
2,440 |
Ohio |
2,120 |
Maryland |
1,640 |
Wisconsin |
1,290 |
New Jersey |
1,090 |
Iowa |
1,050 |
Oklahoma |
1,010 |
Georgia |
980 |
Illinois |
930 |
| State | Employment |
|---|---|
California |
17,380 |
Illinois |
12,230 |
Texas |
10,390 |
Wisconsin |
8,390 |
New York |
7,630 |
Ohio |
7,510 |
Pennsylvania |
6,710 |
Missouri |
6,020 |
Tennessee |
5,770 |
Washington |
5,310 |
| State | Employment |
|---|---|
California |
1,900 |
Texas |
1,740 |
Wisconsin |
1,480 |
Illinois |
1,260 |
North Carolina |
960 |
New York |
780 |
Pennsylvania |
750 |
New Jersey |
680 |
Michigan |
670 |
Washington |
650 |
| State | Employment |
|---|---|
Texas |
6,020 |
North Carolina |
5,910 |
Georgia |
5,550 |
Minnesota |
5,220 |
Iowa |
5,010 |
California |
4,980 |
Ohio |
4,110 |
Illinois |
3,990 |
Alabama |
3,370 |
Wisconsin |
2,640 |
| State | Employment |
|---|---|
North Carolina |
13,320 |
Alabama |
11,580 |
Georgia |
9,810 |
Nebraska |
9,200 |
Arkansas |
8,410 |
California |
8,000 |
Iowa |
5,870 |
Mississippi |
5,750 |
Texas |
5,640 |
Delaware |
5,550 |
| State | Employment |
|---|---|
California |
24,010 |
Texas |
13,470 |
Florida |
8,780 |
New York |
8,570 |
Illinois |
6,920 |
Georgia |
4,570 |
Ohio |
4,180 |
Washington |
4,100 |
Pennsylvania |
3,960 |
Michigan |
3,940 |
| State | Employment |
|---|---|
California |
23,580 |
Texas |
15,850 |
New York |
11,690 |
Illinois |
11,430 |
Florida |
10,170 |
Pennsylvania |
9,490 |
Ohio |
7,010 |
Michigan |
6,040 |
Georgia |
5,210 |
Washington |
5,200 |
| State | Employment |
|---|---|
Michigan |
110,680 |
California |
110,380 |
Indiana |
91,280 |
Ohio |
83,850 |
Texas |
81,750 |
Illinois |
69,650 |
Georgia |
60,010 |
North Carolina |
55,030 |
Pennsylvania |
52,960 |
Kentucky |
50,480 |
| State | Employment |
|---|---|
Tennessee |
170 |
Florida |
40 |
| State | Employment |
|---|---|
Florida |
2,780 |
Indiana |
2,580 |
Tennessee |
1,320 |
California |
1,270 |
Washington |
1,170 |
Texas |
1,030 |
North Carolina |
730 |
Ohio |
690 |
Michigan |
680 |
South Dakota |
610 |
| State | Employment |
|---|---|
Texas |
9,970 |
California |
5,430 |
Wisconsin |
5,030 |
Illinois |
3,740 |
Ohio |
3,370 |
Florida |
3,010 |
Alabama |
2,980 |
Pennsylvania |
2,830 |
Indiana |
2,400 |
Michigan |
2,310 |
| State | Employment |
|---|---|
Michigan |
9,580 |
Indiana |
7,990 |
Ohio |
7,830 |
Texas |
1,900 |
California |
1,690 |
Illinois |
1,650 |
Wisconsin |
1,480 |
Tennessee |
1,210 |
New York |
1,170 |
Mississippi |
1,120 |
| State | Employment |
|---|---|
California |
41,520 |
Texas |
22,840 |
New York |
13,300 |
Illinois |
13,040 |
Michigan |
12,520 |
Ohio |
11,760 |
Pennsylvania |
11,590 |
Florida |
11,260 |
Wisconsin |
10,830 |
Massachusetts |
10,330 |
| State | Employment |
|---|---|
California |
1,340 |
Texas |
1,050 |
Illinois |
920 |
Georgia |
820 |
Tennessee |
680 |
North Carolina |
680 |
Wisconsin |
670 |
Missouri |
610 |
Ohio |
600 |
Minnesota |
500 |
| State | Employment |
|---|---|
Kansas |
8,860 |
California |
3,120 |
Texas |
3,060 |
Georgia |
2,690 |
Florida |
1,560 |
Pennsylvania |
1,360 |
Oklahoma |
1,150 |
Alabama |
1,080 |
Arizona |
770 |
Louisiana |
520 |
| State | Employment |
|---|---|
Texas |
50,230 |
California |
49,390 |
Ohio |
32,460 |
Michigan |
31,100 |
Pennsylvania |
28,030 |
Illinois |
26,930 |
Wisconsin |
24,910 |
Florida |
24,870 |
New York |
24,760 |
Indiana |
24,450 |
| State | Employment |
|---|---|
California |
836,780 |
Texas |
705,670 |
Ohio |
509,690 |
Michigan |
476,190 |
Illinois |
430,840 |
Indiana |
386,740 |
Pennsylvania |
379,000 |
North Carolina |
340,230 |
Wisconsin |
335,380 |
New York |
328,630 |
| State | Employment |
|---|---|
California |
21,640 |
Florida |
15,900 |
Texas |
12,600 |
Ohio |
6,540 |
Tennessee |
6,360 |
Georgia |
6,310 |
New York |
6,090 |
Illinois |
5,910 |
Maryland |
5,580 |
Louisiana |
4,750 |
| State | Employment |
|---|---|
Texas |
15,170 |
California |
10,190 |
Florida |
6,520 |
New York |
5,240 |
Virginia |
4,200 |
Maryland |
3,770 |
North Carolina |
3,700 |
Pennsylvania |
3,360 |
Georgia |
3,360 |
Louisiana |
2,760 |
| State | Employment |
|---|---|
New York |
1,140 |
Pennsylvania |
610 |
Texas |
520 |
Illinois |
490 |
Florida |
280 |
California |
280 |
Indiana |
250 |
Washington |
150 |
Massachusetts |
110 |
Colorado |
110 |
| State | Employment |
|---|---|
Texas |
3,920 |
Louisiana |
3,540 |
California |
2,350 |
Virginia |
1,470 |
Florida |
1,040 |
Washington |
950 |
Illinois |
610 |
New York |
570 |
Massachusetts |
520 |
Oklahoma |
480 |
| State | Employment |
|---|---|
Texas |
330 |
Florida |
310 |
New York |
160 |
Pennsylvania |
100 |
Kansas |
100 |
Montana |
80 |
South Carolina |
70 |
New Hampshire |
70 |
Virginia |
60 |
Oklahoma |
60 |
| State | Employment |
|---|---|
California |
2,290 |
Florida |
1,540 |
Texas |
1,170 |
New York |
800 |
Illinois |
670 |
Virginia |
660 |
New Jersey |
600 |
North Carolina |
520 |
Massachusetts |
520 |
Pennsylvania |
440 |
| State | Employment |
|---|---|
Florida |
390 |
California |
390 |
Texas |
250 |
Louisiana |
210 |
Virginia |
180 |
New York |
120 |
Washington |
90 |
New Hampshire |
90 |
New Jersey |
80 |
Alaska |
70 |
| State | Employment |
|---|---|
California |
3,000 |
New York |
1,950 |
Texas |
1,880 |
Illinois |
1,720 |
Nevada |
1,510 |
Ohio |
1,370 |
Florida |
1,200 |
North Carolina |
1,190 |
Indiana |
1,190 |
Pennsylvania |
1,130 |
| State | Employment |
|---|---|
Texas |
1,600 |
Minnesota |
500 |
Iowa |
480 |
California |
480 |
Oklahoma |
380 |
Pennsylvania |
320 |
Illinois |
300 |
Colorado |
290 |
South Dakota |
200 |
Oregon |
190 |
| State | Employment |
|---|---|
California |
135,160 |
Texas |
115,850 |
New York |
112,560 |
Florida |
98,990 |
Illinois |
66,100 |
Pennsylvania |
58,990 |
Ohio |
57,150 |
North Carolina |
45,390 |
Georgia |
43,470 |
Michigan |
40,710 |
| State | Employment |
|---|---|
California |
1,960 |
Texas |
900 |
New Jersey |
810 |
Washington |
400 |
North Carolina |
370 |
Ohio |
360 |
Tennessee |
340 |
Kentucky |
340 |
Oregon |
330 |
Louisiana |
320 |
| State | Employment |
|---|---|
California |
400 |
New York |
350 |
Florida |
210 |
Texas |
180 |
New Jersey |
150 |
Michigan |
100 |
Wisconsin |
70 |
Rhode Island |
60 |
| State | Employment |
|---|---|
California |
930 |
Pennsylvania |
620 |
New York |
590 |
Texas |
580 |
Washington |
420 |
Illinois |
360 |
Ohio |
320 |
Michigan |
310 |
New Jersey |
290 |
Florida |
290 |
| State | Employment |
|---|---|
California |
5,210 |
Texas |
3,880 |
Florida |
3,460 |
Pennsylvania |
2,070 |
New York |
1,950 |
Ohio |
1,880 |
Illinois |
1,650 |
North Carolina |
1,500 |
Michigan |
1,440 |
Indiana |
1,410 |
| State | Employment |
|---|---|
California |
610 |
New Jersey |
340 |
New York |
190 |
Florida |
160 |
Louisiana |
140 |
Georgia |
140 |
Wisconsin |
130 |
Tennessee |
130 |
Ohio |
100 |
Pennsylvania |
90 |
| State | Employment |
|---|---|
Texas |
14,790 |
California |
14,760 |
New York |
11,750 |
Pennsylvania |
6,500 |
Virginia |
6,160 |
Florida |
5,730 |
Ohio |
5,230 |
Maryland |
4,760 |
New Jersey |
4,610 |
Massachusetts |
3,420 |
| State | Employment |
|---|---|
Texas |
10,600 |
California |
6,730 |
Georgia |
6,200 |
Florida |
5,620 |
New York |
5,070 |
Illinois |
4,120 |
North Carolina |
4,020 |
Pennsylvania |
3,830 |
Virginia |
3,410 |
Ohio |
3,230 |
| State | Employment |
|---|---|
Texas |
180 |
Indiana |
110 |
Alabama |
50 |
Tennessee |
30 |
| State | Employment |
|---|---|
Texas |
4,520 |
Michigan |
3,360 |
Ohio |
2,870 |
California |
2,710 |
Indiana |
2,490 |
Illinois |
2,410 |
Pennsylvania |
2,390 |
Georgia |
2,080 |
Louisiana |
1,820 |
Washington |
1,410 |
| State | Employment |
|---|---|
Texas |
6,860 |
California |
6,740 |
North Carolina |
4,720 |
Oklahoma |
4,600 |
Pennsylvania |
4,190 |
Ohio |
3,270 |
New York |
3,240 |
Tennessee |
3,020 |
Illinois |
2,850 |
Louisiana |
2,530 |
| State | Employment |
|---|---|
Texas |
41,370 |
California |
27,170 |
Michigan |
22,670 |
Ohio |
20,980 |
Pennsylvania |
18,220 |
Illinois |
14,420 |
Florida |
13,750 |
Indiana |
12,670 |
Georgia |
12,620 |
Alabama |
12,280 |
| State | Employment |
|---|---|
Texas |
2,210 |
California |
2,180 |
Florida |
2,150 |
Michigan |
1,670 |
Illinois |
1,580 |
New York |
1,510 |
New Jersey |
1,430 |
Pennsylvania |
1,400 |
Ohio |
1,320 |
Georgia |
1,280 |
| State | Employment |
|---|---|
Florida |
31,710 |
California |
29,650 |
Texas |
26,690 |
New York |
18,810 |
Pennsylvania |
15,630 |
North Carolina |
13,800 |
Ohio |
12,100 |
Virginia |
11,670 |
New Jersey |
10,430 |
Georgia |
9,970 |
| State | Employment |
|---|---|
Texas |
9,830 |
New York |
4,900 |
California |
3,990 |
Michigan |
2,420 |
North Carolina |
1,920 |
Florida |
1,720 |
Pennsylvania |
1,570 |
Massachusetts |
1,490 |
Oklahoma |
1,390 |
Ohio |
1,390 |
| State | Employment |
|---|---|
Texas |
2,500 |
California |
2,140 |
Florida |
1,910 |
Ohio |
1,270 |
Georgia |
1,170 |
New York |
1,040 |
Pennsylvania |
740 |
New Jersey |
710 |
Iowa |
590 |
Minnesota |
540 |
| State | Employment |
|---|---|
Texas |
14,430 |
California |
10,940 |
Florida |
4,760 |
Illinois |
4,140 |
Ohio |
3,660 |
Michigan |
3,270 |
Colorado |
3,220 |
Alabama |
3,130 |
Washington |
3,100 |
Indiana |
3,070 |
| State | Employment |
|---|---|
California |
1,810 |
Texas |
1,520 |
Indiana |
970 |
Missouri |
940 |
Florida |
810 |
Washington |
530 |
Ohio |
510 |
Oklahoma |
430 |
Tennessee |
420 |
Michigan |
420 |
| State | Employment |
|---|---|
California |
3,460 |
Michigan |
770 |
Colorado |
750 |
New York |
550 |
Indiana |
500 |
Utah |
440 |
Washington |
400 |
Oregon |
320 |
North Carolina |
260 |
Idaho |
230 |
| State | Employment |
|---|---|
Texas |
2,420 |
Florida |
2,250 |
California |
2,200 |
New York |
1,490 |
Michigan |
1,450 |
Pennsylvania |
1,440 |
Ohio |
1,260 |
Indiana |
1,070 |
Missouri |
980 |
Tennessee |
870 |
| State | Employment |
|---|---|
California |
1,430 |
Florida |
900 |
Texas |
880 |
Wisconsin |
820 |
Ohio |
700 |
Michigan |
660 |
Pennsylvania |
650 |
New York |
520 |
Colorado |
520 |
Washington |
500 |
| State | Employment |
|---|---|
Florida |
3,370 |
California |
1,690 |
Texas |
1,280 |
New York |
1,240 |
Michigan |
1,230 |
Maryland |
1,120 |
Massachusetts |
900 |
Virginia |
850 |
North Carolina |
720 |
Wisconsin |
640 |
| State | Employment |
|---|---|
Illinois |
3,120 |
Texas |
2,660 |
New York |
1,970 |
Pennsylvania |
1,190 |
Minnesota |
1,190 |
Kansas |
1,180 |
Nebraska |
840 |
Georgia |
800 |
Indiana |
700 |
Kentucky |
680 |
| State | Employment |
|---|---|
Texas |
18,730 |
California |
12,980 |
Florida |
7,300 |
Pennsylvania |
6,090 |
Washington |
4,880 |
Georgia |
4,620 |
Virginia |
4,590 |
North Carolina |
4,390 |
Ohio |
4,380 |
Arizona |
3,940 |
| State | Employment |
|---|---|
California |
3,680 |
Texas |
2,460 |
Iowa |
2,290 |
Nebraska |
1,920 |
Minnesota |
1,770 |
Wisconsin |
1,580 |
Ohio |
1,460 |
Illinois |
1,380 |
Kansas |
1,310 |
Missouri |
1,240 |
| State | Employment |
|---|---|
Texas |
26,430 |
California |
22,330 |
Pennsylvania |
13,150 |
New York |
13,150 |
Florida |
12,580 |
Illinois |
11,420 |
Ohio |
9,330 |
Michigan |
8,960 |
North Carolina |
8,450 |
Indiana |
8,150 |
| State | Employment |
|---|---|
California |
66,270 |
Texas |
51,010 |
Florida |
45,130 |
New York |
35,680 |
Pennsylvania |
31,230 |
Illinois |
26,800 |
Ohio |
25,310 |
North Carolina |
24,050 |
Georgia |
21,250 |
Virginia |
19,830 |
| State | Employment |
|---|---|
California |
2,340 |
Texas |
1,820 |
New York |
1,080 |
North Carolina |
900 |
Florida |
870 |
Ohio |
860 |
Virginia |
680 |
Pennsylvania |
670 |
Washington |
630 |
Massachusetts |
570 |
| State | Employment |
|---|---|
California |
12,940 |
Texas |
11,000 |
Florida |
9,110 |
Illinois |
7,480 |
New York |
7,030 |
Pennsylvania |
6,960 |
Michigan |
5,200 |
North Carolina |
5,170 |
Ohio |
5,110 |
Georgia |
4,570 |
| State | Employment |
|---|---|
Texas |
16,480 |
California |
13,800 |
Florida |
13,490 |
Georgia |
7,490 |
Washington |
6,070 |
Arizona |
4,740 |
Illinois |
4,610 |
North Carolina |
4,400 |
Ohio |
4,150 |
Michigan |
3,520 |
| State | Employment |
|---|---|
Texas |
8,610 |
California |
8,440 |
Florida |
5,850 |
New York |
4,000 |
New Jersey |
2,800 |
Pennsylvania |
2,480 |
Virginia |
2,460 |
Ohio |
2,260 |
North Carolina |
2,110 |
Georgia |
2,070 |
| State | Employment |
|---|---|
Texas |
2,880 |
Arizona |
1,940 |
Florida |
1,660 |
New York |
1,600 |
Pennsylvania |
1,520 |
California |
1,280 |
Colorado |
1,150 |
Illinois |
1,090 |
Indiana |
990 |
Ohio |
940 |
| State | Employment |
|---|---|
California |
1,880 |
Texas |
1,320 |
New York |
730 |
Missouri |
560 |
Florida |
480 |
North Carolina |
290 |
Colorado |
270 |
Illinois |
260 |
Tennessee |
240 |
Ohio |
240 |
| State | Employment |
|---|---|
New York |
2,470 |
Texas |
1,920 |
California |
1,420 |
Michigan |
1,410 |
Pennsylvania |
1,110 |
Georgia |
1,100 |
Virginia |
1,070 |
Florida |
1,060 |
North Carolina |
890 |
Alabama |
840 |
| State | Employment |
|---|---|
Texas |
6,280 |
California |
5,190 |
Pennsylvania |
3,310 |
Georgia |
2,510 |
Florida |
2,510 |
North Carolina |
2,280 |
Colorado |
2,220 |
Illinois |
1,870 |
Washington |
1,830 |
New Jersey |
1,750 |
| State | Employment |
|---|---|
California |
1,160 |
Texas |
810 |
Virginia |
710 |
Pennsylvania |
700 |
New Jersey |
550 |
New York |
530 |
Maryland |
410 |
Florida |
300 |
Tennessee |
280 |
Ohio |
260 |
| State | Employment |
|---|---|
Texas |
1,450 |
California |
1,250 |
Florida |
860 |
Pennsylvania |
840 |
Virginia |
830 |
North Carolina |
790 |
Ohio |
740 |
Arizona |
740 |
Colorado |
640 |
Tennessee |
620 |
| State | Employment |
|---|---|
Washington |
3,180 |
Texas |
2,970 |
Florida |
2,260 |
California |
1,620 |
Georgia |
1,490 |
Kansas |
970 |
Alabama |
960 |
Maryland |
610 |
Arizona |
610 |
Oklahoma |
540 |
| State | Employment |
|---|---|
California |
26,340 |
Texas |
20,450 |
Florida |
19,780 |
Georgia |
9,850 |
New York |
9,690 |
Illinois |
8,690 |
North Carolina |
8,300 |
Ohio |
7,510 |
Michigan |
6,380 |
Pennsylvania |
6,020 |
| State | Employment |
|---|---|
Texas |
1,850 |
New Jersey |
1,060 |
California |
990 |
Florida |
690 |
Pennsylvania |
670 |
North Carolina |
660 |
Tennessee |
620 |
New York |
620 |
Virginia |
530 |
Colorado |
500 |
| State | Employment |
|---|---|
California |
10,600 |
Texas |
9,490 |
New York |
6,300 |
Florida |
5,150 |
Pennsylvania |
5,050 |
Illinois |
4,400 |
North Carolina |
3,820 |
Virginia |
3,670 |
Ohio |
3,360 |
Georgia |
3,310 |
| State | Employment |
|---|---|
Texas |
42,220 |
California |
40,350 |
Florida |
30,630 |
New York |
26,960 |
Pennsylvania |
20,840 |
Georgia |
17,120 |
North Carolina |
16,850 |
Ohio |
16,360 |
Virginia |
15,490 |
Michigan |
14,770 |
| State | Employment |
|---|---|
California |
538,120 |
Texas |
530,380 |
Florida |
368,910 |
New York |
318,830 |
Pennsylvania |
238,530 |
Illinois |
216,530 |
Ohio |
214,930 |
North Carolina |
189,790 |
Georgia |
187,070 |
Michigan |
172,470 |
| State | Employment |
|---|---|
Nevada |
880 |
Kentucky |
810 |
West Virginia |
720 |
Tennessee |
670 |
Utah |
530 |
California |
530 |
Alaska |
460 |
Florida |
440 |
Minnesota |
410 |
Pennsylvania |
400 |
| State | Employment |
|---|---|
Texas |
3,190 |
California |
2,430 |
Nevada |
1,320 |
Florida |
1,220 |
Oklahoma |
980 |
Pennsylvania |
950 |
Maryland |
810 |
Arizona |
800 |
Indiana |
780 |
West Virginia |
620 |
| State | Employment |
|---|---|
Texas |
7,040 |
California |
1,100 |
Kentucky |
630 |
Oklahoma |
600 |
Arizona |
590 |
Nevada |
560 |
Wyoming |
530 |
Colorado |
530 |
Ohio |
500 |
Pennsylvania |
390 |
| State | Employment |
|---|---|
Texas |
27,860 |
Oklahoma |
6,380 |
North Dakota |
4,600 |
New Mexico |
4,240 |
Colorado |
2,840 |
Wyoming |
2,130 |
Pennsylvania |
2,110 |
Louisiana |
1,750 |
California |
1,350 |
Kansas |
910 |
| State | Employment |
|---|---|
Pennsylvania |
780 |
Oklahoma |
330 |
Indiana |
320 |
Texas |
240 |
Ohio |
240 |
Georgia |
240 |
Tennessee |
210 |
Missouri |
210 |
Colorado |
210 |
Kentucky |
160 |
| State | Employment |
|---|---|
West Virginia |
1,370 |
Kentucky |
350 |
Pennsylvania |
340 |
Illinois |
180 |
Texas |
160 |
Ohio |
150 |
Virginia |
140 |
Indiana |
140 |
Wyoming |
130 |
Alabama |
120 |
| State | Employment |
|---|---|
West Virginia |
920 |
Kentucky |
610 |
Pennsylvania |
390 |
Virginia |
330 |
Indiana |
240 |
Illinois |
190 |
Wyoming |
80 |
| State | Employment |
|---|---|
Nevada |
2,530 |
Utah |
1,400 |
Arizona |
1,180 |
Kentucky |
1,100 |
West Virginia |
1,070 |
Pennsylvania |
810 |
Illinois |
770 |
Virginia |
680 |
California |
650 |
Indiana |
470 |
| State | Employment |
|---|---|
Texas |
7,660 |
California |
2,300 |
Florida |
2,170 |
Virginia |
1,750 |
New York |
1,710 |
Georgia |
1,370 |
Michigan |
1,350 |
Wisconsin |
1,290 |
Missouri |
1,280 |
Pennsylvania |
1,250 |
| State | Employment |
|---|---|
Texas |
23,210 |
Pennsylvania |
3,890 |
Oklahoma |
3,490 |
North Dakota |
3,060 |
Colorado |
2,970 |
New Mexico |
2,390 |
California |
2,340 |
Louisiana |
2,280 |
Wyoming |
1,950 |
West Virginia |
900 |
| State | Employment |
|---|---|
Texas |
8,220 |
Oklahoma |
3,480 |
California |
1,680 |
New Mexico |
1,040 |
Pennsylvania |
970 |
North Dakota |
870 |
Louisiana |
840 |
Colorado |
520 |
Utah |
450 |
West Virginia |
400 |
| State | Employment |
|---|---|
Texas |
6,150 |
New Mexico |
1,070 |
Oklahoma |
1,040 |
California |
890 |
North Dakota |
780 |
Utah |
370 |
Louisiana |
320 |
Wyoming |
190 |
Mississippi |
140 |
Alaska |
110 |
| State | Employment |
|---|---|
Louisiana |
3,200 |
Florida |
3,160 |
California |
3,030 |
Texas |
1,930 |
Georgia |
1,920 |
Tennessee |
1,510 |
Colorado |
1,360 |
Maryland |
1,130 |
North Carolina |
1,080 |
Arizona |
1,080 |
| State | Employment |
|---|---|
California |
2,570 |
Texas |
1,690 |
Ohio |
1,640 |
New York |
1,570 |
Florida |
1,420 |
Pennsylvania |
1,220 |
North Carolina |
1,160 |
Missouri |
1,110 |
Michigan |
1,100 |
Georgia |
980 |
| State | Employment |
|---|---|
New York |
3,140 |
Texas |
970 |
Illinois |
810 |
Pennsylvania |
800 |
Massachusetts |
780 |
New Jersey |
600 |
Georgia |
340 |
Maryland |
330 |
Minnesota |
300 |
Indiana |
280 |
| State | Employment |
|---|---|
New York |
14,990 |
Pennsylvania |
12,770 |
Illinois |
7,920 |
Ohio |
7,760 |
Texas |
6,750 |
California |
6,480 |
Wisconsin |
5,950 |
Missouri |
5,900 |
Minnesota |
5,030 |
New Jersey |
4,020 |
| State | Employment |
|---|---|
California |
6,240 |
New York |
4,780 |
Texas |
3,720 |
Ohio |
2,280 |
Pennsylvania |
2,130 |
North Carolina |
1,440 |
Florida |
1,400 |
Colorado |
1,340 |
New Jersey |
1,290 |
Maryland |
1,290 |
| State | Employment |
|---|---|
California |
3,490 |
Texas |
2,540 |
Florida |
1,740 |
Massachusetts |
1,500 |
New York |
1,240 |
Washington |
1,210 |
Virginia |
830 |
Ohio |
700 |
Missouri |
680 |
Oregon |
660 |
| State | Employment |
|---|---|
New York |
5,020 |
California |
2,740 |
Texas |
2,650 |
Florida |
1,910 |
Maryland |
1,640 |
Massachusetts |
1,010 |
Michigan |
930 |
Washington |
800 |
Illinois |
780 |
Pennsylvania |
740 |
| State | Employment |
|---|---|
Texas |
11,210 |
California |
10,320 |
Florida |
8,740 |
New York |
8,330 |
Pennsylvania |
6,360 |
North Carolina |
4,720 |
New Jersey |
4,450 |
Virginia |
4,220 |
Colorado |
3,260 |
Michigan |
2,980 |
| State | Employment |
|---|---|
Texas |
5,360 |
Louisiana |
3,220 |
California |
3,140 |
Florida |
2,620 |
New York |
1,460 |
Georgia |
1,240 |
Virginia |
1,050 |
Tennessee |
1,050 |
North Carolina |
940 |
Arizona |
750 |
| State | Employment |
|---|---|
Florida |
1,840 |
California |
990 |
Texas |
800 |
Virginia |
780 |
Maryland |
410 |
North Carolina |
380 |
Ohio |
330 |
Louisiana |
240 |
Pennsylvania |
230 |
New York |
220 |
| State | Employment |
|---|---|
Texas |
11,780 |
Florida |
6,400 |
North Carolina |
3,790 |
New York |
3,590 |
California |
3,400 |
Louisiana |
3,240 |
Virginia |
2,710 |
Georgia |
1,930 |
Alabama |
1,440 |
Maryland |
1,340 |
| State | Employment |
|---|---|
California |
2,040 |
Texas |
1,640 |
Louisiana |
1,050 |
Florida |
990 |
Nevada |
470 |
New York |
360 |
Virginia |
320 |
Utah |
310 |
Arizona |
290 |
Washington |
200 |
| State | Employment |
|---|---|
Texas |
11,500 |
Florida |
9,180 |
New York |
5,760 |
North Carolina |
5,710 |
Georgia |
5,350 |
California |
4,740 |
Louisiana |
3,470 |
Tennessee |
2,790 |
Virginia |
2,700 |
Massachusetts |
2,020 |
| State | Employment |
|---|---|
California |
3,500 |
Florida |
2,940 |
Texas |
2,900 |
Virginia |
2,070 |
New York |
1,630 |
Louisiana |
1,380 |
Maryland |
1,370 |
North Carolina |
1,300 |
Washington |
990 |
Pennsylvania |
980 |
| State | Employment |
|---|---|
California |
4,400 |
Texas |
1,900 |
Florida |
1,830 |
New York |
1,430 |
Virginia |
1,290 |
North Carolina |
970 |
Tennessee |
840 |
Maryland |
790 |
Pennsylvania |
720 |
Massachusetts |
570 |
| State | Employment |
|---|---|
California |
4,970 |
New Jersey |
1,050 |
North Carolina |
670 |
New York |
470 |
Hawaii |
350 |
Massachusetts |
330 |
Virginia |
300 |
Puerto Rico |
240 |
Nevada |
210 |
New Mexico |
170 |
| State | Employment |
|---|---|
California |
9,950 |
Texas |
9,290 |
New York |
5,370 |
Ohio |
3,460 |
Illinois |
3,390 |
Florida |
2,840 |
Pennsylvania |
2,550 |
Massachusetts |
2,470 |
Indiana |
2,060 |
Arizona |
1,810 |
| State | Employment |
|---|---|
California |
12,410 |
Texas |
10,130 |
Florida |
8,240 |
New York |
6,720 |
Illinois |
5,400 |
Georgia |
4,400 |
Virginia |
4,370 |
Missouri |
4,310 |
Washington |
4,270 |
Ohio |
4,140 |
| State | Employment |
|---|---|
Florida |
22,800 |
California |
18,900 |
Texas |
7,400 |
New York |
5,330 |
Washington |
5,100 |
Ohio |
5,070 |
Pennsylvania |
4,030 |
Illinois |
3,920 |
Oregon |
3,430 |
Colorado |
3,120 |
| State | Employment |
|---|---|
Texas |
3,870 |
California |
2,330 |
Florida |
2,220 |
New York |
1,280 |
Virginia |
700 |
Colorado |
580 |
Tennessee |
490 |
Maryland |
480 |
New Jersey |
460 |
Utah |
410 |
| State | Employment |
|---|---|
California |
8,610 |
Arizona |
2,340 |
Florida |
2,270 |
Texas |
2,110 |
Nevada |
2,010 |
New York |
1,210 |
Utah |
1,190 |
Massachusetts |
640 |
Pennsylvania |
520 |
Illinois |
500 |
| State | Employment |
|---|---|
California |
47,360 |
Texas |
43,240 |
New York |
29,630 |
Florida |
26,280 |
Illinois |
17,570 |
Pennsylvania |
15,540 |
Virginia |
14,290 |
Ohio |
13,330 |
Massachusetts |
12,970 |
North Carolina |
12,820 |
| State | Employment |
|---|---|
Texas |
4,450 |
Florida |
3,670 |
North Carolina |
3,160 |
California |
2,380 |
Alabama |
2,040 |
Georgia |
1,820 |
Tennessee |
1,210 |
Virginia |
1,170 |
Oklahoma |
1,020 |
Colorado |
940 |
| State | Employment |
|---|---|
New York |
620 |
Pennsylvania |
230 |
Florida |
210 |
North Carolina |
180 |
Colorado |
170 |
Ohio |
150 |
Nevada |
110 |
Oklahoma |
100 |
Texas |
40 |
Missouri |
40 |
| State | Employment |
|---|---|
California |
38,510 |
Texas |
20,350 |
Florida |
18,950 |
New York |
15,050 |
Washington |
9,720 |
Illinois |
8,790 |
Pennsylvania |
6,170 |
Ohio |
5,870 |
Louisiana |
5,820 |
Arizona |
5,610 |
| State | Employment |
|---|---|
Texas |
4,230 |
Virginia |
2,250 |
Louisiana |
1,660 |
Florida |
1,210 |
Colorado |
1,090 |
North Carolina |
1,080 |
Washington |
1,040 |
Missouri |
880 |
Georgia |
810 |
Minnesota |
740 |
| State | Employment |
|---|---|
Texas |
4,730 |
California |
2,020 |
Florida |
1,880 |
Louisiana |
1,640 |
Washington |
1,340 |
Illinois |
1,270 |
Virginia |
1,240 |
North Carolina |
1,160 |
Ohio |
950 |
Tennessee |
900 |
| State | Employment |
|---|---|
California |
6,470 |
Florida |
5,930 |
Texas |
5,300 |
New York |
2,850 |
Washington |
2,200 |
North Carolina |
1,550 |
Michigan |
1,520 |
Arizona |
1,510 |
Colorado |
1,400 |
Ohio |
1,300 |
| State | Employment |
|---|---|
California |
72,870 |
Texas |
63,750 |
New York |
43,890 |
Florida |
41,410 |
Illinois |
25,400 |
Ohio |
25,180 |
Michigan |
22,380 |
Pennsylvania |
21,370 |
Washington |
19,840 |
North Carolina |
19,320 |
| State | Employment |
|---|---|
California |
6,830 |
Washington |
2,280 |
Arizona |
780 |
New York |
740 |
Nevada |
740 |
Illinois |
590 |
Massachusetts |
580 |
Utah |
570 |
Minnesota |
480 |
Oregon |
470 |
| State | Employment |
|---|---|
California |
31,430 |
Texas |
6,880 |
Florida |
6,550 |
New York |
5,730 |
Washington |
4,390 |
Arizona |
3,810 |
Utah |
3,470 |
Colorado |
3,190 |
Nevada |
2,930 |
North Carolina |
2,020 |
| State | Employment |
|---|---|
Texas |
46,290 |
California |
28,450 |
Florida |
21,050 |
Pennsylvania |
20,860 |
Ohio |
15,440 |
New York |
13,960 |
North Carolina |
13,640 |
Georgia |
12,930 |
Colorado |
10,970 |
Virginia |
10,930 |
| State | Employment |
|---|---|
Texas |
460 |
California |
390 |
Florida |
340 |
Massachusetts |
240 |
Louisiana |
210 |
Washington |
110 |
Virginia |
110 |
Tennessee |
110 |
Oregon |
100 |
North Carolina |
100 |
| State | Employment |
|---|---|
Texas |
4,660 |
California |
2,870 |
Florida |
2,770 |
Virginia |
2,320 |
Illinois |
1,780 |
New York |
1,720 |
Georgia |
1,630 |
Ohio |
1,560 |
Tennessee |
1,510 |
Colorado |
1,460 |
| State | Employment |
|---|---|
Texas |
112,370 |
California |
101,900 |
Florida |
73,030 |
New York |
66,740 |
Pennsylvania |
40,620 |
Ohio |
35,900 |
Illinois |
34,010 |
Georgia |
32,250 |
Washington |
31,510 |
North Carolina |
26,110 |
| State | Employment |
|---|---|
California |
330 |
Maryland |
270 |
Missouri |
250 |
Illinois |
220 |
Pennsylvania |
130 |
Florida |
80 |
Michigan |
50 |
| State | Employment |
|---|---|
California |
28,170 |
Texas |
21,550 |
Florida |
15,340 |
Arizona |
6,510 |
Ohio |
6,390 |
New York |
6,000 |
Wisconsin |
5,590 |
Illinois |
5,360 |
Michigan |
5,270 |
Colorado |
5,200 |
| State | Employment |
|---|---|
California |
7,230 |
Florida |
4,850 |
New York |
3,500 |
Texas |
2,920 |
Nevada |
1,490 |
Illinois |
1,410 |
Utah |
1,370 |
Arizona |
1,270 |
New Jersey |
1,180 |
Washington |
1,140 |
| State | Employment |
|---|---|
California |
570 |
Wisconsin |
430 |
Massachusetts |
290 |
North Carolina |
270 |
Arkansas |
220 |
New York |
210 |
Missouri |
210 |
Pennsylvania |
170 |
Florida |
170 |
Tennessee |
140 |
| State | Employment |
|---|---|
California |
4,590 |
New York |
940 |
Ohio |
930 |
Florida |
820 |
North Carolina |
740 |
Wisconsin |
620 |
Missouri |
560 |
Michigan |
530 |
Massachusetts |
340 |
Washington |
330 |
| State | Employment |
|---|---|
California |
5,700 |
Texas |
1,440 |
Pennsylvania |
1,170 |
Nevada |
1,150 |
Washington |
1,100 |
Missouri |
1,050 |
Michigan |
1,050 |
New York |
1,030 |
Florida |
920 |
Illinois |
760 |
| State | Employment |
|---|---|
California |
106,300 |
New York |
52,640 |
Florida |
45,550 |
Texas |
41,230 |
Pennsylvania |
31,290 |
Illinois |
26,550 |
Washington |
25,600 |
Michigan |
20,480 |
Ohio |
18,950 |
Virginia |
18,930 |
| State | Employment |
|---|---|
California |
3,560 |
Texas |
840 |
New York |
790 |
Florida |
640 |
Utah |
620 |
Nevada |
430 |
Maryland |
430 |
Colorado |
390 |
New Jersey |
340 |
Virginia |
310 |
| State | Employment |
|---|---|
Florida |
4,270 |
Texas |
4,250 |
New York |
4,170 |
Pennsylvania |
3,560 |
California |
3,260 |
Ohio |
2,990 |
Illinois |
2,810 |
Virginia |
2,620 |
Michigan |
2,570 |
North Carolina |
2,540 |
| State | Employment |
|---|---|
Texas |
4,590 |
Louisiana |
1,320 |
Indiana |
830 |
Ohio |
820 |
New York |
720 |
Michigan |
640 |
California |
570 |
Pennsylvania |
500 |
Missouri |
430 |
Tennessee |
420 |
| State | Employment |
|---|---|
Texas |
75,570 |
California |
57,530 |
Florida |
46,760 |
North Carolina |
29,260 |
New York |
27,590 |
Pennsylvania |
21,660 |
Virginia |
21,030 |
Georgia |
17,940 |
Colorado |
17,160 |
Arizona |
16,410 |
| State | Employment |
|---|---|
California |
688,660 |
Texas |
656,840 |
Florida |
413,620 |
New York |
358,350 |
Pennsylvania |
228,210 |
Ohio |
187,600 |
Illinois |
187,210 |
North Carolina |
180,690 |
Washington |
169,600 |
Virginia |
167,520 |
| State | Employment |
|---|---|
Oregon |
1,210 |
Washington |
600 |
Arkansas |
560 |
Louisiana |
210 |
Idaho |
200 |
Georgia |
190 |
California |
90 |
Alabama |
70 |
Tennessee |
60 |
Florida |
60 |
| State | Employment |
|---|---|
Washington |
250 |
Arkansas |
230 |
North Carolina |
180 |
Kentucky |
180 |
California |
180 |
Alabama |
160 |
Oregon |
150 |
Georgia |
150 |
Florida |
150 |
Pennsylvania |
140 |
| State | Employment |
|---|---|
Alabama |
2,150 |
Georgia |
1,970 |
Oregon |
1,920 |
Mississippi |
1,400 |
North Carolina |
1,390 |
Washington |
1,380 |
Arkansas |
1,380 |
South Carolina |
1,190 |
Florida |
1,170 |
Louisiana |
1,150 |
| State | Employment |
|---|---|
Oregon |
470 |
Mississippi |
400 |
California |
330 |
Tennessee |
310 |
Florida |
300 |
Virginia |
270 |
Texas |
260 |
Washington |
240 |
Georgia |
230 |
North Carolina |
130 |
| State | Employment |
|---|---|
California |
2,000 |
South Dakota |
540 |
Washington |
380 |
Tennessee |
350 |
Wisconsin |
340 |
South Carolina |
250 |
Pennsylvania |
220 |
Louisiana |
210 |
Texas |
170 |
Illinois |
170 |
| State | Employment |
|---|---|
California |
1,550 |
Texas |
980 |
Washington |
560 |
Louisiana |
330 |
Iowa |
310 |
Florida |
300 |
Tennessee |
240 |
Alabama |
180 |
Mississippi |
140 |
Colorado |
130 |
| State | Employment |
|---|---|
Texas |
5,940 |
California |
2,410 |
Kentucky |
1,820 |
Missouri |
1,490 |
Pennsylvania |
1,450 |
Alabama |
1,280 |
Colorado |
1,230 |
Oklahoma |
1,160 |
Kansas |
1,130 |
Iowa |
1,130 |
| State | Employment |
|---|---|
California |
201,440 |
Washington |
12,720 |
Arizona |
10,350 |
Florida |
10,070 |
Oregon |
6,040 |
Texas |
4,500 |
Colorado |
3,310 |
New Jersey |
3,030 |
Georgia |
2,880 |
Pennsylvania |
2,730 |
| State | Employment |
|---|---|
California |
6,880 |
Texas |
2,720 |
Iowa |
1,580 |
Illinois |
1,420 |
Florida |
1,320 |
Nebraska |
1,070 |
Kansas |
970 |
Washington |
950 |
Missouri |
810 |
Minnesota |
780 |
| State | Employment |
|---|---|
California |
8,310 |
Texas |
4,610 |
Georgia |
2,750 |
Washington |
2,240 |
Oregon |
1,700 |
Florida |
1,440 |
North Carolina |
1,260 |
Arkansas |
1,240 |
Idaho |
750 |
Pennsylvania |
740 |
| State | Employment |
|---|---|
Wisconsin |
260 |
California |
160 |
Pennsylvania |
110 |
Texas |
80 |
New York |
80 |
Ohio |
70 |
Kentucky |
70 |
Washington |
60 |
South Dakota |
60 |
Iowa |
60 |
| State | Employment |
|---|---|
California |
2,090 |
Texas |
890 |
Washington |
720 |
Georgia |
570 |
Florida |
500 |
Illinois |
480 |
Nebraska |
450 |
Ohio |
430 |
Minnesota |
370 |
Iowa |
370 |
| State | Employment |
|---|---|
California |
7,450 |
Texas |
1,200 |
Washington |
1,140 |
Florida |
910 |
Oregon |
860 |
Georgia |
720 |
Virginia |
580 |
Arizona |
570 |
North Carolina |
550 |
Maryland |
520 |
| State | Employment |
|---|---|
California |
234,050 |
Texas |
23,800 |
Washington |
22,250 |
Florida |
17,370 |
Oregon |
13,510 |
Arizona |
11,950 |
Georgia |
11,120 |
North Carolina |
7,740 |
Pennsylvania |
7,180 |
Colorado |
7,010 |
| State | Employment |
|---|---|
California |
44,450 |
New York |
15,980 |
Florida |
9,960 |
Texas |
7,690 |
North Carolina |
6,610 |
Nevada |
6,360 |
Connecticut |
5,850 |
Oregon |
5,740 |
New Jersey |
5,120 |
Washington |
5,090 |
| State | Employment |
|---|---|
California |
1,100 |
Indiana |
760 |
Pennsylvania |
740 |
Massachusetts |
690 |
Illinois |
630 |
Ohio |
500 |
New York |
450 |
Texas |
380 |
Washington |
340 |
Tennessee |
320 |
| State | Employment |
|---|---|
New York |
1,150 |
California |
860 |
Texas |
480 |
Pennsylvania |
430 |
Illinois |
410 |
Massachusetts |
330 |
New Jersey |
300 |
Arizona |
290 |
Virginia |
270 |
Minnesota |
270 |
| State | Employment |
|---|---|
California |
5,480 |
Texas |
4,650 |
New York |
4,190 |
New Jersey |
2,790 |
Ohio |
2,650 |
Pennsylvania |
1,750 |
Illinois |
1,740 |
Florida |
1,720 |
Tennessee |
1,370 |
North Carolina |
1,350 |
| State | Employment |
|---|---|
California |
333,940 |
Texas |
313,750 |
Florida |
191,650 |
New York |
186,380 |
Illinois |
161,770 |
Pennsylvania |
159,110 |
Ohio |
116,010 |
Michigan |
96,950 |
North Carolina |
84,330 |
Virginia |
76,110 |
| State | Employment |
|---|---|
Texas |
8,260 |
New York |
8,180 |
California |
6,020 |
Illinois |
5,500 |
Pennsylvania |
4,420 |
Virginia |
4,230 |
Ohio |
3,340 |
New Jersey |
3,320 |
Florida |
2,930 |
Minnesota |
2,450 |
| State | Employment |
|---|---|
California |
37,710 |
Texas |
29,610 |
Florida |
14,880 |
Pennsylvania |
10,610 |
Illinois |
10,490 |
Ohio |
10,450 |
Missouri |
9,420 |
Georgia |
8,700 |
New York |
8,450 |
Wisconsin |
7,430 |
| State | Employment |
|---|---|
Texas |
880 |
New York |
690 |
California |
690 |
Illinois |
600 |
Pennsylvania |
530 |
Minnesota |
410 |
Massachusetts |
330 |
Maryland |
320 |
Florida |
290 |
Oregon |
260 |
| State | Employment |
|---|---|
New York |
14,920 |
California |
7,610 |
Pennsylvania |
6,210 |
New Jersey |
3,540 |
Puerto Rico |
2,580 |
Texas |
1,650 |
Florida |
1,460 |
Michigan |
1,250 |
Ohio |
1,120 |
Massachusetts |
580 |
| State | Employment |
|---|---|
Texas |
19,300 |
California |
18,290 |
New York |
11,190 |
Florida |
10,980 |
New Jersey |
8,120 |
Illinois |
7,350 |
Pennsylvania |
6,540 |
Michigan |
5,660 |
Ohio |
5,160 |
North Carolina |
4,630 |
| State | Employment |
|---|---|
California |
227,540 |
Texas |
168,070 |
New York |
166,810 |
Florida |
129,470 |
Pennsylvania |
89,510 |
Georgia |
65,440 |
Illinois |
62,420 |
New Jersey |
62,390 |
Ohio |
57,340 |
Missouri |
55,520 |
| State | Employment |
|---|---|
California |
95,120 |
Texas |
82,490 |
Florida |
31,680 |
Ohio |
31,110 |
Michigan |
25,940 |
Massachusetts |
25,240 |
Georgia |
20,380 |
Pennsylvania |
17,860 |
Illinois |
16,740 |
Missouri |
16,390 |
| State | Employment |
|---|---|
California |
26,710 |
New York |
12,320 |
Texas |
12,070 |
Florida |
9,760 |
New Jersey |
8,620 |
Illinois |
8,000 |
Pennsylvania |
7,220 |
Ohio |
4,620 |
Michigan |
4,260 |
Massachusetts |
4,240 |
| State | Employment |
|---|---|
New York |
91,240 |
California |
65,800 |
Texas |
40,110 |
Illinois |
27,980 |
Florida |
25,160 |
Massachusetts |
23,510 |
New Jersey |
19,140 |
Pennsylvania |
15,580 |
Ohio |
14,550 |
Louisiana |
14,010 |
| State | Employment |
|---|---|
California |
10,940 |
Texas |
4,770 |
New Jersey |
2,880 |
Indiana |
2,760 |
New York |
2,700 |
Georgia |
2,210 |
Florida |
2,160 |
North Carolina |
2,070 |
Pennsylvania |
2,030 |
Illinois |
1,940 |
| State | Employment |
|---|---|
California |
88,910 |
Texas |
68,970 |
Ohio |
39,460 |
Illinois |
37,650 |
Florida |
33,520 |
Georgia |
28,830 |
New York |
27,580 |
Pennsylvania |
27,320 |
Michigan |
24,630 |
New Jersey |
21,040 |
| State | Employment |
|---|---|
California |
52,540 |
New York |
44,610 |
Texas |
35,220 |
Ohio |
20,090 |
Florida |
17,870 |
Illinois |
15,030 |
Washington |
10,910 |
Pennsylvania |
10,890 |
Michigan |
10,310 |
Georgia |
9,510 |
| State | Employment |
|---|---|
California |
12,210 |
New York |
8,730 |
Texas |
6,290 |
Florida |
5,950 |
Illinois |
5,510 |
Pennsylvania |
5,190 |
New Jersey |
4,730 |
Ohio |
3,920 |
Michigan |
3,240 |
Massachusetts |
3,030 |
| State | Employment |
|---|---|
California |
33,730 |
Texas |
26,050 |
New York |
22,220 |
Florida |
20,750 |
Illinois |
15,520 |
Pennsylvania |
14,260 |
Ohio |
13,680 |
Michigan |
12,180 |
North Carolina |
11,300 |
Georgia |
10,950 |
| State | Employment |
|---|---|
California |
7,400 |
New York |
6,100 |
Texas |
5,120 |
Florida |
3,840 |
Pennsylvania |
3,830 |
Illinois |
3,150 |
Ohio |
2,760 |
New Jersey |
2,710 |
Michigan |
2,680 |
Virginia |
2,260 |
| State | Employment |
|---|---|
Texas |
2,490 |
Ohio |
2,070 |
California |
1,600 |
Florida |
1,580 |
Georgia |
1,520 |
Indiana |
1,310 |
Missouri |
1,230 |
Pennsylvania |
1,180 |
Louisiana |
1,140 |
New Jersey |
1,120 |
| State | Employment |
|---|---|
Texas |
22,900 |
California |
20,850 |
New York |
13,370 |
Florida |
11,810 |
Illinois |
7,400 |
Ohio |
7,270 |
Pennsylvania |
7,130 |
New Jersey |
5,740 |
Michigan |
5,730 |
Georgia |
5,540 |
| State | Employment |
|---|---|
Texas |
7,430 |
California |
6,850 |
New York |
5,480 |
Florida |
4,980 |
Ohio |
4,530 |
New Jersey |
4,110 |
North Carolina |
3,630 |
Illinois |
3,560 |
Pennsylvania |
3,450 |
Georgia |
3,430 |
| State | Employment |
|---|---|
California |
9,410 |
New York |
8,760 |
Texas |
6,190 |
Florida |
4,900 |
Pennsylvania |
2,840 |
Georgia |
2,740 |
Puerto Rico |
2,540 |
Michigan |
2,360 |
Illinois |
2,280 |
Ohio |
2,180 |
| State | Employment |
|---|---|
California |
13,670 |
Texas |
8,500 |
Florida |
7,760 |
New York |
7,460 |
Illinois |
5,300 |
Georgia |
3,870 |
Virginia |
3,490 |
Ohio |
3,130 |
North Carolina |
2,790 |
Indiana |
2,740 |
| State | Employment |
|---|---|
California |
21,630 |
Texas |
16,770 |
Colorado |
12,090 |
Florida |
9,200 |
Oregon |
6,040 |
Arizona |
4,630 |
Virginia |
4,450 |
North Carolina |
4,380 |
New York |
4,260 |
Georgia |
4,060 |
| State | Employment |
|---|---|
Texas |
18,490 |
California |
15,970 |
Florida |
13,020 |
New York |
7,570 |
Illinois |
6,300 |
Virginia |
4,840 |
Utah |
4,190 |
Arizona |
4,060 |
Pennsylvania |
3,300 |
Washington |
3,260 |
| State | Employment |
|---|---|
New York |
95,590 |
California |
95,470 |
Florida |
78,540 |
Texas |
71,890 |
New Jersey |
56,290 |
Illinois |
41,880 |
Pennsylvania |
41,330 |
North Carolina |
39,080 |
Ohio |
36,340 |
Virginia |
31,560 |
| State | Employment |
|---|---|
California |
13,150 |
Texas |
11,590 |
New York |
9,580 |
Florida |
6,200 |
New Jersey |
5,430 |
Pennsylvania |
4,930 |
Ohio |
4,590 |
Maryland |
3,700 |
North Carolina |
3,490 |
Virginia |
3,380 |
| State | Employment |
|---|---|
California |
30,150 |
Texas |
13,260 |
Florida |
8,530 |
New York |
6,430 |
Ohio |
5,920 |
Washington |
5,890 |
New Jersey |
4,990 |
Pennsylvania |
4,910 |
Wisconsin |
4,090 |
Colorado |
3,860 |
| State | Employment |
|---|---|
Texas |
6,530 |
California |
2,890 |
Missouri |
2,690 |
Illinois |
2,260 |
Tennessee |
1,940 |
Wisconsin |
1,920 |
Michigan |
1,660 |
Oklahoma |
1,600 |
New York |
1,570 |
Kansas |
1,240 |
| State | Employment |
|---|---|
Texas |
23,360 |
California |
18,840 |
Florida |
10,970 |
Illinois |
8,990 |
Ohio |
8,110 |
Missouri |
7,890 |
Virginia |
7,800 |
Pennsylvania |
7,520 |
Arizona |
6,960 |
New York |
6,820 |
| State | Employment |
|---|---|
California |
8,610 |
New York |
6,540 |
Illinois |
5,320 |
Pennsylvania |
5,240 |
Ohio |
5,070 |
Texas |
4,830 |
Michigan |
4,000 |
Virginia |
3,020 |
New Jersey |
2,850 |
Indiana |
2,610 |
| State | Employment |
|---|---|
California |
19,450 |
New York |
15,480 |
Florida |
11,300 |
Texas |
11,190 |
North Carolina |
8,440 |
Pennsylvania |
8,180 |
Ohio |
6,890 |
Indiana |
6,740 |
Illinois |
6,210 |
New Jersey |
6,090 |
| State | Employment |
|---|---|
California |
26,560 |
Texas |
24,790 |
Florida |
20,900 |
New York |
10,850 |
North Carolina |
9,230 |
Georgia |
9,060 |
Pennsylvania |
8,790 |
Illinois |
8,310 |
Virginia |
7,510 |
Ohio |
6,600 |
| State | Employment |
|---|---|
California |
12,950 |
Texas |
10,880 |
Florida |
8,490 |
New Jersey |
8,240 |
New York |
5,910 |
Pennsylvania |
5,080 |
Illinois |
3,390 |
Ohio |
3,070 |
Georgia |
2,820 |
Arizona |
2,390 |
| State | Employment |
|---|---|
California |
21,160 |
New York |
12,130 |
Texas |
11,580 |
Pennsylvania |
9,440 |
North Carolina |
6,810 |
Ohio |
4,600 |
Michigan |
4,510 |
Missouri |
4,020 |
Georgia |
3,930 |
Washington |
3,610 |
| State | Employment |
|---|---|
Texas |
291,550 |
Florida |
267,430 |
California |
208,600 |
New York |
158,520 |
Pennsylvania |
129,250 |
Illinois |
122,490 |
Georgia |
112,130 |
Ohio |
110,020 |
Arizona |
105,000 |
North Carolina |
88,950 |
| State | Employment |
|---|---|
Texas |
2,730 |
California |
2,150 |
Florida |
2,000 |
New Jersey |
1,630 |
New York |
1,570 |
Ohio |
1,040 |
Louisiana |
840 |
Tennessee |
810 |
Arizona |
800 |
Missouri |
670 |
| State | Employment |
|---|---|
Texas |
12,520 |
California |
12,220 |
Ohio |
9,920 |
Florida |
8,800 |
New York |
7,480 |
Michigan |
7,300 |
Minnesota |
7,290 |
Missouri |
6,180 |
Colorado |
5,590 |
Illinois |
5,360 |
| State | Employment |
|---|---|
California |
1,240 |
Texas |
800 |
Maryland |
340 |
Indiana |
300 |
Illinois |
290 |
Massachusetts |
270 |
Ohio |
250 |
Pennsylvania |
220 |
South Dakota |
210 |
Tennessee |
200 |
| State | Employment |
|---|---|
California |
4,670 |
New York |
4,590 |
Texas |
4,280 |
Florida |
3,200 |
New Jersey |
2,450 |
Pennsylvania |
2,390 |
Illinois |
2,200 |
Minnesota |
2,050 |
Ohio |
1,830 |
North Carolina |
1,760 |
| State | Employment |
|---|---|
California |
4,480 |
Texas |
3,180 |
Florida |
1,990 |
New York |
1,720 |
Colorado |
1,700 |
Ohio |
1,320 |
New Jersey |
1,150 |
Nevada |
1,100 |
Minnesota |
930 |
Virginia |
880 |
| State | Employment |
|---|---|
Texas |
42,850 |
California |
41,140 |
Florida |
24,870 |
New York |
23,240 |
Illinois |
18,720 |
Pennsylvania |
18,590 |
Ohio |
17,250 |
Michigan |
14,250 |
New Jersey |
12,270 |
Wisconsin |
11,010 |
| State | Employment |
|---|---|
California |
7,070 |
Texas |
6,140 |
New York |
3,560 |
New Jersey |
3,490 |
Ohio |
3,190 |
Pennsylvania |
3,180 |
Florida |
3,030 |
Georgia |
2,860 |
Illinois |
2,190 |
Arizona |
2,080 |
| State | Employment |
|---|---|
California |
21,740 |
Texas |
13,270 |
New York |
8,620 |
Florida |
7,520 |
Pennsylvania |
5,430 |
Ohio |
5,170 |
Georgia |
4,430 |
Illinois |
4,280 |
North Carolina |
3,910 |
Virginia |
3,820 |
| State | Employment |
|---|---|
Nevada |
2,410 |
California |
2,320 |
Oklahoma |
1,300 |
Washington |
1,100 |
Louisiana |
690 |
Florida |
580 |
Arizona |
510 |
Michigan |
470 |
Mississippi |
450 |
Ohio |
330 |
| State | Employment |
|---|---|
California |
180,050 |
Texas |
131,870 |
New York |
101,030 |
Florida |
94,230 |
Illinois |
55,900 |
Pennsylvania |
55,880 |
Ohio |
53,120 |
North Carolina |
47,670 |
Massachusetts |
44,440 |
New Jersey |
41,680 |
| State | Employment |
|---|---|
California |
52,010 |
Texas |
45,260 |
New York |
33,630 |
Florida |
29,350 |
Pennsylvania |
20,870 |
Ohio |
19,220 |
New Jersey |
18,650 |
Illinois |
16,090 |
Georgia |
14,710 |
Michigan |
13,060 |
| State | Employment |
|---|---|
Texas |
29,610 |
California |
20,350 |
Florida |
17,650 |
New York |
14,570 |
Ohio |
9,890 |
Illinois |
8,850 |
Georgia |
8,780 |
Arizona |
8,630 |
Pennsylvania |
8,320 |
Virginia |
7,150 |
| State | Employment |
|---|---|
Nevada |
260 |
Puerto Rico |
210 |
Kentucky |
130 |
Tennessee |
110 |
Ohio |
100 |
New York |
80 |
Louisiana |
80 |
Pennsylvania |
70 |
Georgia |
60 |
Arizona |
60 |
| State | Employment |
|---|---|
New York |
620 |
California |
580 |
Ohio |
420 |
Texas |
270 |
Georgia |
240 |
Pennsylvania |
220 |
Florida |
220 |
Massachusetts |
200 |
Maryland |
140 |
Louisiana |
140 |
| State | Employment |
|---|---|
California |
11,960 |
Texas |
5,380 |
Florida |
5,060 |
New York |
3,100 |
Ohio |
2,770 |
Illinois |
2,630 |
Georgia |
2,560 |
Pennsylvania |
2,130 |
Michigan |
2,110 |
New Jersey |
2,010 |
| State | Employment |
|---|---|
California |
167,310 |
Texas |
121,920 |
New York |
110,080 |
Florida |
108,820 |
Pennsylvania |
68,700 |
Georgia |
48,300 |
Ohio |
46,740 |
Illinois |
46,740 |
North Carolina |
41,690 |
Massachusetts |
40,160 |
| State | Employment |
|---|---|
California |
2,154,700 |
Texas |
1,820,280 |
New York |
1,334,940 |
Florida |
1,294,440 |
Pennsylvania |
825,920 |
Illinois |
791,740 |
Ohio |
721,700 |
Georgia |
580,040 |
New Jersey |
571,360 |
North Carolina |
556,600 |
| State | Employment |
|---|---|
California |
29,030 |
Texas |
13,070 |
Florida |
8,560 |
New Jersey |
6,310 |
Georgia |
4,510 |
Colorado |
3,750 |
North Carolina |
2,910 |
Maryland |
2,810 |
Ohio |
2,780 |
Tennessee |
2,730 |
| State | Employment |
|---|---|
California |
1,790 |
Texas |
1,550 |
Illinois |
690 |
New York |
670 |
Florida |
580 |
Washington |
220 |
Ohio |
220 |
Pennsylvania |
160 |
Arizona |
150 |
Massachusetts |
140 |
| State | Employment |
|---|---|
Florida |
16,760 |
Texas |
12,550 |
California |
11,790 |
Ohio |
11,130 |
Arizona |
6,880 |
Pennsylvania |
6,020 |
New York |
4,570 |
Virginia |
4,130 |
Illinois |
4,120 |
New Jersey |
3,680 |
| State | Employment |
|---|---|
California |
11,440 |
Texas |
9,120 |
Massachusetts |
3,720 |
Georgia |
3,220 |
Pennsylvania |
3,200 |
New York |
2,660 |
Colorado |
2,180 |
Florida |
2,170 |
Ohio |
2,050 |
North Carolina |
1,920 |
| State | Employment |
|---|---|
Florida |
19,240 |
Texas |
16,380 |
California |
9,750 |
Georgia |
8,910 |
Virginia |
8,810 |
Washington |
7,810 |
North Carolina |
6,860 |
Pennsylvania |
6,210 |
Ohio |
6,130 |
South Carolina |
5,860 |
| State | Employment |
|---|---|
California |
6,320 |
Colorado |
3,940 |
Florida |
3,160 |
Arizona |
2,520 |
North Carolina |
2,370 |
New York |
2,240 |
Illinois |
2,000 |
Missouri |
1,930 |
Texas |
1,820 |
Virginia |
1,370 |
| State | Employment |
|---|---|
California |
290 |
New York |
170 |
Tennessee |
110 |
Maryland |
100 |
Missouri |
90 |
Utah |
40 |
Pennsylvania |
40 |
Texas |
30 |
| State | Employment |
|---|---|
California |
17,570 |
Texas |
7,430 |
New York |
6,290 |
Florida |
4,750 |
Washington |
3,500 |
Pennsylvania |
2,800 |
Illinois |
2,800 |
Oregon |
2,330 |
New Jersey |
2,190 |
Virginia |
2,000 |
| State | Employment |
|---|---|
California |
147,310 |
Texas |
119,170 |
Florida |
86,490 |
New York |
75,220 |
Illinois |
67,650 |
Ohio |
56,990 |
Pennsylvania |
56,930 |
Georgia |
47,670 |
Michigan |
47,310 |
North Carolina |
44,320 |
| State | Employment |
|---|---|
California |
39,230 |
Texas |
28,850 |
Florida |
20,830 |
Massachusetts |
15,520 |
New York |
15,040 |
Illinois |
13,030 |
Tennessee |
13,020 |
Ohio |
12,710 |
North Carolina |
12,040 |
Pennsylvania |
11,530 |
| State | Employment |
|---|---|
California |
134,040 |
Texas |
105,020 |
Florida |
81,410 |
New York |
68,110 |
Illinois |
52,350 |
Georgia |
38,640 |
New Jersey |
36,570 |
North Carolina |
35,250 |
Pennsylvania |
34,350 |
Ohio |
33,920 |
| State | Employment |
|---|---|
Florida |
9,490 |
California |
8,780 |
New York |
5,400 |
Texas |
3,900 |
Illinois |
3,300 |
Arizona |
2,550 |
Pennsylvania |
2,210 |
New Jersey |
2,070 |
Georgia |
2,030 |
Massachusetts |
1,970 |
| State | Employment |
|---|---|
New York |
67,120 |
California |
57,210 |
Texas |
39,630 |
Florida |
30,060 |
Illinois |
22,550 |
Pennsylvania |
17,050 |
New Jersey |
16,650 |
Ohio |
15,120 |
North Carolina |
12,730 |
Colorado |
11,730 |
| State | Employment |
|---|---|
California |
41,900 |
Florida |
33,580 |
Texas |
33,290 |
New York |
22,400 |
Illinois |
17,060 |
Ohio |
16,330 |
Pennsylvania |
14,880 |
Georgia |
14,370 |
North Carolina |
12,920 |
Michigan |
12,030 |
| State | Employment |
|---|---|
New York |
21,030 |
California |
16,880 |
Florida |
8,120 |
Texas |
7,830 |
Illinois |
7,490 |
North Carolina |
3,850 |
Georgia |
3,820 |
Washington |
3,750 |
Pennsylvania |
3,700 |
Michigan |
3,450 |
| State | Employment |
|---|---|
California |
418,900 |
Texas |
383,920 |
Florida |
325,640 |
New York |
288,630 |
Pennsylvania |
159,180 |
Illinois |
157,400 |
Ohio |
148,470 |
North Carolina |
143,830 |
Georgia |
143,080 |
Michigan |
136,190 |
| State | Employment |
|---|---|
California |
26,140 |
Texas |
24,090 |
Florida |
14,930 |
New York |
10,780 |
Ohio |
10,070 |
Pennsylvania |
9,800 |
Michigan |
9,300 |
Georgia |
9,220 |
Illinois |
8,970 |
North Carolina |
8,570 |
| State | Employment |
|---|---|
California |
82,980 |
Texas |
43,110 |
Florida |
24,950 |
New York |
19,130 |
Georgia |
13,220 |
Ohio |
12,800 |
Virginia |
12,780 |
Colorado |
12,280 |
Washington |
11,930 |
Michigan |
11,820 |
| State | Employment |
|---|---|
California |
2,890 |
Nevada |
2,350 |
Oklahoma |
1,730 |
Florida |
1,150 |
Louisiana |
1,130 |
Michigan |
1,000 |
Arizona |
930 |
Washington |
900 |
Illinois |
640 |
New York |
590 |
| State | Employment |
|---|---|
California |
431,140 |
Texas |
284,770 |
Florida |
229,830 |
New York |
198,340 |
Pennsylvania |
140,150 |
Illinois |
137,250 |
North Carolina |
126,920 |
Ohio |
117,440 |
Virginia |
115,790 |
Georgia |
115,640 |
| State | Employment |
|---|---|
California |
24,580 |
Texas |
24,030 |
New York |
22,570 |
Florida |
17,270 |
Pennsylvania |
12,010 |
North Carolina |
9,290 |
Virginia |
8,750 |
Ohio |
8,300 |
New Jersey |
7,760 |
Michigan |
7,440 |
| State | Employment |
|---|---|
California |
116,620 |
Texas |
103,010 |
Florida |
83,260 |
New York |
65,890 |
Pennsylvania |
47,640 |
North Carolina |
39,720 |
Ohio |
38,470 |
Illinois |
37,580 |
Georgia |
37,430 |
Michigan |
33,510 |
| State | Employment |
|---|---|
California |
1,636,580 |
Texas |
1,262,690 |
Florida |
1,022,310 |
New York |
903,950 |
Illinois |
560,360 |
Pennsylvania |
541,890 |
Ohio |
500,900 |
North Carolina |
479,880 |
Georgia |
471,770 |
Michigan |
409,870 |
| State | Employment |
|---|---|
Oregon |
15,310 |
California |
4,620 |
Florida |
4,110 |
Washington |
3,370 |
Louisiana |
3,120 |
New Jersey |
2,930 |
Nevada |
2,760 |
Maryland |
2,210 |
New York |
1,880 |
Texas |
1,620 |
| State | Employment |
|---|---|
New York |
9,280 |
California |
8,350 |
Pennsylvania |
6,860 |
Tennessee |
6,410 |
Texas |
6,010 |
Maryland |
5,990 |
Massachusetts |
5,760 |
Kentucky |
3,980 |
Florida |
3,820 |
Ohio |
3,250 |
| State | Employment |
|---|---|
California |
48,360 |
New York |
30,000 |
Texas |
21,500 |
Florida |
19,300 |
Illinois |
18,400 |
Ohio |
13,960 |
Pennsylvania |
13,210 |
Michigan |
12,230 |
New Jersey |
11,320 |
Virginia |
10,920 |
| State | Employment |
|---|---|
California |
41,460 |
New York |
24,330 |
Texas |
21,690 |
Illinois |
16,870 |
Florida |
16,460 |
Massachusetts |
13,560 |
Pennsylvania |
13,400 |
Virginia |
12,040 |
New Jersey |
10,640 |
Colorado |
10,180 |
| State | Employment |
|---|---|
California |
55,430 |
New York |
53,290 |
Texas |
51,120 |
Florida |
27,310 |
Pennsylvania |
24,340 |
North Carolina |
19,780 |
New Jersey |
19,090 |
Ohio |
18,710 |
Michigan |
17,230 |
Georgia |
17,220 |
| State | Employment |
|---|---|
California |
5,930 |
Florida |
3,270 |
New York |
2,710 |
Massachusetts |
2,290 |
Texas |
2,210 |
Pennsylvania |
2,180 |
Virginia |
2,070 |
Hawaii |
1,670 |
Arizona |
1,590 |
Michigan |
1,430 |
| State | Employment |
|---|---|
Florida |
6,580 |
New York |
5,520 |
California |
4,360 |
Texas |
2,680 |
Massachusetts |
2,120 |
New Jersey |
1,730 |
Illinois |
1,550 |
District of Columbia |
1,530 |
Virginia |
1,390 |
Nevada |
1,080 |
| State | Employment |
|---|---|
California |
5,570 |
Florida |
5,400 |
New York |
3,660 |
Nevada |
2,120 |
Illinois |
2,110 |
Texas |
1,730 |
Hawaii |
1,300 |
Pennsylvania |
1,190 |
Virginia |
1,070 |
Georgia |
1,030 |
| State | Employment |
|---|---|
California |
8,480 |
New York |
5,680 |
Texas |
4,720 |
Florida |
4,200 |
Pennsylvania |
2,540 |
New Jersey |
2,160 |
Arizona |
2,160 |
Illinois |
2,130 |
Virginia |
1,950 |
Georgia |
1,670 |
| State | Employment |
|---|---|
New Jersey |
1,830 |
Pennsylvania |
1,520 |
Florida |
1,320 |
Illinois |
1,110 |
Maryland |
1,040 |
Virginia |
960 |
New York |
780 |
Texas |
740 |
Georgia |
470 |
California |
420 |
| State | Employment |
|---|---|
California |
23,590 |
New York |
23,470 |
New Jersey |
6,440 |
Massachusetts |
5,470 |
Pennsylvania |
5,350 |
Washington |
5,030 |
Connecticut |
4,010 |
Illinois |
3,340 |
Virginia |
3,290 |
Florida |
2,830 |
| State | Employment |
|---|---|
California |
1,720 |
New York |
490 |
Louisiana |
80 |
New Mexico |
60 |
Hawaii |
60 |
Texas |
50 |
Nevada |
40 |
District of Columbia |
40 |
| State | Employment |
|---|---|
California |
37,210 |
Texas |
31,150 |
Florida |
25,840 |
New York |
24,590 |
Pennsylvania |
24,270 |
New Jersey |
19,280 |
Illinois |
17,260 |
Ohio |
16,970 |
Michigan |
11,990 |
Massachusetts |
10,530 |
| State | Employment |
|---|---|
Texas |
3,450 |
New York |
1,790 |
Florida |
1,610 |
Pennsylvania |
1,210 |
North Carolina |
910 |
Colorado |
870 |
California |
830 |
Massachusetts |
580 |
Michigan |
520 |
Georgia |
500 |
| State | Employment |
|---|---|
Texas |
2,030 |
Ohio |
1,520 |
Florida |
1,430 |
New York |
1,420 |
Pennsylvania |
1,270 |
California |
1,230 |
Illinois |
1,180 |
North Carolina |
1,040 |
Michigan |
920 |
New Jersey |
830 |
| State | Employment |
|---|---|
Ohio |
2,400 |
Florida |
2,370 |
Pennsylvania |
2,350 |
Texas |
2,280 |
California |
2,060 |
North Carolina |
1,540 |
New York |
1,460 |
Virginia |
1,440 |
Indiana |
1,440 |
Georgia |
1,380 |
| State | Employment |
|---|---|
California |
490 |
Texas |
460 |
Florida |
270 |
Ohio |
230 |
Missouri |
210 |
Alabama |
160 |
Louisiana |
150 |
Tennessee |
130 |
South Carolina |
130 |
Oklahoma |
130 |
| State | Employment |
|---|---|
California |
760 |
Louisiana |
500 |
New York |
380 |
Nevada |
380 |
Texas |
280 |
Georgia |
240 |
Florida |
220 |
Oregon |
210 |
Ohio |
160 |
Utah |
140 |
| State | Employment |
|---|---|
California |
2,220 |
New York |
1,560 |
Florida |
1,530 |
Missouri |
1,140 |
Pennsylvania |
990 |
Illinois |
580 |
Ohio |
550 |
Texas |
490 |
New Jersey |
490 |
Maine |
490 |
| State | Employment |
|---|---|
California |
2,220 |
New York |
1,350 |
Nevada |
340 |
Georgia |
300 |
Illinois |
270 |
Pennsylvania |
210 |
Minnesota |
210 |
Utah |
130 |
Texas |
130 |
Massachusetts |
130 |
| State | Employment |
|---|---|
California |
52,540 |
Florida |
39,010 |
Texas |
18,570 |
New York |
18,390 |
North Carolina |
17,470 |
Ohio |
11,010 |
Pennsylvania |
10,770 |
Colorado |
10,690 |
Michigan |
10,270 |
Georgia |
8,870 |
| State | Employment |
|---|---|
California |
17,470 |
New York |
11,200 |
Texas |
10,020 |
Florida |
8,690 |
Illinois |
6,020 |
Georgia |
6,010 |
North Carolina |
5,530 |
Pennsylvania |
4,720 |
Tennessee |
3,880 |
Missouri |
3,770 |
| State | Employment |
|---|---|
Pennsylvania |
450 |
Texas |
390 |
New Jersey |
390 |
California |
380 |
New York |
280 |
Florida |
210 |
Washington |
180 |
Massachusetts |
180 |
Illinois |
170 |
Tennessee |
150 |
| State | Employment |
|---|---|
Nevada |
3,310 |
California |
1,760 |
Texas |
1,060 |
Louisiana |
620 |
Minnesota |
420 |
Michigan |
300 |
Arizona |
260 |
Florida |
240 |
Alaska |
240 |
Colorado |
220 |
| State | Employment |
|---|---|
California |
1,620 |
Nevada |
1,400 |
Minnesota |
940 |
Texas |
770 |
Montana |
560 |
New York |
520 |
Kentucky |
360 |
Nebraska |
340 |
Alaska |
320 |
South Carolina |
270 |
| State | Employment |
|---|---|
Nevada |
22,580 |
California |
16,050 |
Washington |
5,700 |
New Jersey |
4,410 |
Florida |
4,360 |
Pennsylvania |
3,870 |
New York |
3,710 |
Mississippi |
3,210 |
Louisiana |
2,940 |
Michigan |
2,790 |
| State | Employment |
|---|---|
California |
22,530 |
Texas |
16,370 |
Florida |
14,760 |
New York |
12,450 |
Illinois |
9,450 |
Pennsylvania |
8,670 |
North Carolina |
7,800 |
Ohio |
7,640 |
Virginia |
7,160 |
Michigan |
6,300 |
| State | Employment |
|---|---|
California |
1,980 |
Florida |
1,590 |
New York |
1,300 |
Texas |
1,190 |
Illinois |
810 |
Arizona |
660 |
North Carolina |
630 |
Ohio |
510 |
Kentucky |
490 |
Maryland |
470 |
| State | Employment |
|---|---|
California |
28,130 |
New York |
19,590 |
Texas |
14,050 |
Florida |
12,710 |
Pennsylvania |
12,560 |
North Carolina |
6,590 |
Ohio |
6,500 |
Michigan |
6,430 |
New Jersey |
6,220 |
Virginia |
5,790 |
| State | Employment |
|---|---|
Nevada |
6,790 |
California |
4,110 |
Michigan |
1,210 |
Washington |
1,190 |
Oklahoma |
1,050 |
Pennsylvania |
1,040 |
Mississippi |
1,040 |
New York |
1,020 |
New Jersey |
960 |
Indiana |
880 |
| State | Employment |
|---|---|
California |
401,870 |
New York |
262,220 |
Texas |
219,120 |
Florida |
211,190 |
Pennsylvania |
145,640 |
Illinois |
118,930 |
New Jersey |
109,870 |
Ohio |
105,700 |
North Carolina |
95,430 |
Virginia |
90,560 |
| State | Employment |
|---|---|
New York |
3,270 |
California |
2,260 |
Tennessee |
1,080 |
Texas |
990 |
Louisiana |
640 |
Florida |
590 |
Colorado |
420 |
Maryland |
410 |
Washington |
340 |
Oregon |
310 |
| State | Employment |
|---|---|
California |
8,520 |
Florida |
4,190 |
Texas |
2,840 |
New York |
2,660 |
Michigan |
2,250 |
Pennsylvania |
2,190 |
North Carolina |
1,710 |
Tennessee |
1,500 |
Massachusetts |
1,330 |
Missouri |
1,320 |
| State | Employment |
|---|---|
Florida |
3,490 |
California |
2,400 |
Minnesota |
1,480 |
Iowa |
1,220 |
Illinois |
1,160 |
Texas |
930 |
Washington |
810 |
Indiana |
700 |
Kansas |
680 |
Idaho |
660 |
| State | Employment |
|---|---|
California |
106,550 |
Florida |
83,960 |
Texas |
66,350 |
New York |
44,730 |
Ohio |
37,830 |
Illinois |
33,460 |
Pennsylvania |
32,670 |
North Carolina |
31,430 |
Michigan |
29,250 |
New Jersey |
28,530 |
| State | Employment |
|---|---|
California |
10,240 |
Florida |
9,310 |
Texas |
7,310 |
Georgia |
4,550 |
North Carolina |
3,640 |
New York |
3,230 |
Tennessee |
2,590 |
Virginia |
2,520 |
New Jersey |
2,350 |
Alabama |
2,310 |
| State | Employment |
|---|---|
Florida |
2,780 |
Maryland |
1,600 |
Colorado |
840 |
Georgia |
830 |
Oregon |
790 |
South Carolina |
490 |
Louisiana |
390 |
Iowa |
190 |
Oklahoma |
140 |
Arkansas |
120 |
| State | Employment |
|---|---|
California |
101,370 |
Florida |
80,000 |
Texas |
76,040 |
New York |
47,990 |
North Carolina |
32,530 |
Illinois |
31,780 |
Pennsylvania |
30,890 |
Ohio |
26,600 |
Michigan |
25,230 |
Nevada |
25,140 |
| State | Employment |
|---|---|
California |
232,970 |
New York |
190,730 |
Texas |
168,160 |
Florida |
116,830 |
Illinois |
94,280 |
Pennsylvania |
90,110 |
Ohio |
79,690 |
New Jersey |
67,210 |
Michigan |
60,550 |
Virginia |
60,510 |
| State | Employment |
|---|---|
California |
10,110 |
Florida |
8,400 |
Texas |
6,580 |
New York |
4,920 |
Illinois |
4,490 |
Georgia |
3,660 |
Pennsylvania |
3,590 |
Michigan |
3,440 |
North Carolina |
3,360 |
Ohio |
3,330 |
| State | Employment |
|---|---|
California |
13,320 |
Florida |
12,410 |
New York |
11,920 |
Texas |
10,620 |
Pennsylvania |
5,950 |
Illinois |
5,090 |
North Carolina |
4,910 |
Georgia |
4,860 |
Virginia |
4,830 |
Massachusetts |
4,650 |
| State | Employment |
|---|---|
California |
488,960 |
Texas |
340,670 |
Florida |
321,970 |
New York |
311,150 |
Illinois |
172,840 |
Pennsylvania |
167,960 |
Ohio |
155,470 |
North Carolina |
133,740 |
New Jersey |
127,820 |
Michigan |
126,870 |
| State | Employment |
|---|---|
California |
23,580 |
Texas |
5,370 |
New Jersey |
4,130 |
Maryland |
3,590 |
Florida |
3,400 |
Georgia |
3,120 |
New York |
3,090 |
Louisiana |
3,050 |
Nevada |
2,780 |
Ohio |
1,820 |
| State | Employment |
|---|---|
California |
47,330 |
Florida |
35,310 |
Texas |
32,980 |
New York |
19,580 |
North Carolina |
17,500 |
Pennsylvania |
15,930 |
Ohio |
15,860 |
Illinois |
15,650 |
Georgia |
15,130 |
Michigan |
13,960 |
| State | Employment |
|---|---|
California |
83,340 |
Florida |
40,320 |
New York |
34,830 |
Texas |
34,540 |
Pennsylvania |
22,060 |
Illinois |
19,080 |
Massachusetts |
15,030 |
Michigan |
14,880 |
Ohio |
14,460 |
Georgia |
14,040 |
| State | Employment |
|---|---|
California |
75,960 |
Texas |
45,250 |
Florida |
41,630 |
New York |
40,770 |
Illinois |
23,760 |
Pennsylvania |
16,330 |
Nevada |
14,980 |
New Jersey |
12,340 |
Michigan |
11,930 |
Maryland |
11,910 |
| State | Employment |
|---|---|
California |
25,560 |
Florida |
19,220 |
Texas |
17,680 |
New York |
15,930 |
Illinois |
15,460 |
New Jersey |
13,840 |
Ohio |
13,500 |
Pennsylvania |
12,950 |
Minnesota |
9,950 |
Michigan |
9,000 |
| State | Employment |
|---|---|
California |
289,160 |
Texas |
219,180 |
Florida |
208,360 |
New York |
160,470 |
Pennsylvania |
96,210 |
Illinois |
90,050 |
Ohio |
87,960 |
Georgia |
84,490 |
Michigan |
82,380 |
North Carolina |
82,340 |
| State | Employment |
|---|---|
California |
436,540 |
Texas |
419,820 |
Florida |
242,300 |
New York |
211,970 |
Ohio |
175,500 |
Pennsylvania |
167,840 |
Illinois |
158,350 |
North Carolina |
136,970 |
Georgia |
135,320 |
Michigan |
127,870 |
| State | Employment |
|---|---|
California |
70,880 |
Florida |
47,910 |
New York |
44,970 |
Texas |
42,520 |
Pennsylvania |
32,450 |
Illinois |
28,540 |
Wisconsin |
26,290 |
Ohio |
25,180 |
Massachusetts |
21,530 |
Michigan |
18,640 |
| State | Employment |
|---|---|
California |
109,410 |
Florida |
65,620 |
New York |
59,850 |
Texas |
59,330 |
New Jersey |
37,100 |
Louisiana |
36,620 |
Tennessee |
35,940 |
Georgia |
33,830 |
Illinois |
33,690 |
Ohio |
24,550 |
| State | Employment |
|---|---|
California |
4,990 |
Tennessee |
1,390 |
Texas |
1,370 |
Florida |
1,340 |
New York |
1,240 |
Louisiana |
960 |
Illinois |
910 |
Virginia |
720 |
Hawaii |
700 |
Georgia |
590 |
| State | Employment |
|---|---|
California |
19,420 |
Texas |
13,640 |
New Jersey |
10,320 |
New York |
9,600 |
Tennessee |
7,000 |
Ohio |
6,520 |
Massachusetts |
5,870 |
Illinois |
5,840 |
Florida |
5,560 |
Oklahoma |
4,980 |
| State | Employment |
|---|---|
California |
179,050 |
Texas |
117,010 |
Florida |
116,310 |
New York |
71,100 |
Pennsylvania |
58,390 |
Illinois |
53,530 |
North Carolina |
50,070 |
Ohio |
42,530 |
Michigan |
41,490 |
Georgia |
39,120 |
| State | Employment |
|---|---|
California |
180 |
| State | Employment |
|---|---|
Texas |
30,000 |
California |
24,900 |
Ohio |
20,630 |
Illinois |
20,450 |
Florida |
19,560 |
New York |
16,120 |
Pennsylvania |
14,380 |
Missouri |
13,520 |
North Carolina |
10,960 |
Kentucky |
10,870 |
| State | Employment |
|---|---|
California |
120,240 |
Texas |
38,680 |
North Carolina |
22,720 |
Arizona |
20,370 |
Florida |
20,150 |
Tennessee |
19,740 |
Ohio |
18,190 |
Georgia |
16,400 |
Mississippi |
14,240 |
Illinois |
14,120 |
| State | Employment |
|---|---|
California |
95,590 |
Texas |
93,030 |
Florida |
71,140 |
New York |
49,170 |
Ohio |
41,690 |
Pennsylvania |
40,640 |
North Carolina |
37,850 |
Georgia |
36,270 |
Illinois |
32,070 |
Michigan |
30,800 |
| State | Employment |
|---|---|
California |
21,370 |
New York |
17,950 |
Florida |
12,040 |
Texas |
5,350 |
Massachusetts |
4,280 |
Illinois |
4,200 |
Ohio |
3,390 |
Nevada |
3,350 |
South Carolina |
3,020 |
Pennsylvania |
3,020 |
| State | Employment |
|---|---|
California |
1,627,490 |
Texas |
1,175,750 |
Florida |
950,180 |
New York |
768,040 |
Illinois |
516,360 |
Pennsylvania |
509,330 |
Ohio |
501,990 |
North Carolina |
429,910 |
Georgia |
416,960 |
Michigan |
393,970 |
| State | Employment |
|---|---|
California |
26,330 |
New York |
19,430 |
Texas |
10,090 |
Florida |
7,830 |
Pennsylvania |
7,350 |
New Jersey |
5,620 |
Illinois |
4,970 |
Ohio |
4,520 |
Colorado |
4,500 |
Washington |
4,390 |
| State | Employment |
|---|---|
Florida |
5,410 |
Texas |
3,890 |
New York |
3,720 |
Illinois |
2,060 |
Virginia |
1,850 |
Georgia |
1,520 |
Pennsylvania |
1,430 |
Washington |
1,220 |
Nevada |
1,180 |
Massachusetts |
1,180 |
| State | Employment |
|---|---|
California |
15,610 |
Texas |
12,240 |
Florida |
8,680 |
New York |
7,820 |
Ohio |
6,600 |
Illinois |
6,490 |
Pennsylvania |
5,850 |
Colorado |
5,160 |
New Jersey |
4,430 |
North Carolina |
4,120 |
| State | Employment |
|---|---|
New York |
10,860 |
Pennsylvania |
7,390 |
Texas |
6,100 |
Florida |
6,070 |
California |
5,980 |
New Jersey |
5,780 |
Illinois |
3,440 |
Ohio |
2,810 |
Maryland |
2,790 |
Tennessee |
2,320 |
| State | Employment |
|---|---|
California |
162,850 |
New York |
118,210 |
Texas |
90,820 |
Florida |
86,190 |
Illinois |
46,120 |
Pennsylvania |
41,330 |
New Jersey |
40,170 |
Georgia |
32,330 |
Virginia |
32,070 |
Ohio |
30,360 |
| State | Employment |
|---|---|
Oklahoma |
1,510 |
California |
1,120 |
Nevada |
870 |
Michigan |
770 |
Washington |
490 |
Indiana |
370 |
Arizona |
360 |
Mississippi |
330 |
Pennsylvania |
310 |
Ohio |
280 |
| State | Employment |
|---|---|
Florida |
4,350 |
California |
3,390 |
Pennsylvania |
3,330 |
Texas |
2,260 |
Ohio |
1,510 |
New York |
1,480 |
Illinois |
1,180 |
Georgia |
980 |
New Jersey |
810 |
Michigan |
740 |
| State | Employment |
|---|---|
California |
1,360 |
Texas |
1,270 |
New York |
780 |
Illinois |
660 |
Florida |
530 |
Georgia |
510 |
New Jersey |
420 |
North Carolina |
410 |
Virginia |
360 |
Ohio |
330 |
| State | Employment |
|---|---|
New York |
1,730 |
California |
610 |
New Jersey |
430 |
Illinois |
330 |
Ohio |
160 |
Maryland |
150 |
Florida |
120 |
Michigan |
70 |
Indiana |
60 |
Pennsylvania |
40 |
| State | Employment |
|---|---|
California |
72,380 |
Texas |
58,840 |
New York |
55,590 |
Florida |
39,090 |
Illinois |
29,460 |
Pennsylvania |
27,990 |
Ohio |
24,790 |
Georgia |
22,140 |
New Jersey |
21,840 |
North Carolina |
21,750 |
| State | Employment |
|---|---|
California |
1,160 |
New York |
570 |
Pennsylvania |
530 |
New Jersey |
460 |
Florida |
420 |
Texas |
400 |
Massachusetts |
390 |
Illinois |
380 |
Virginia |
320 |
Michigan |
260 |
| State | Employment |
|---|---|
Texas |
460 |
Florida |
440 |
New York |
380 |
Tennessee |
350 |
California |
350 |
Arizona |
280 |
Michigan |
230 |
Georgia |
220 |
Virginia |
210 |
Oklahoma |
210 |
| State | Employment |
|---|---|
Texas |
16,810 |
California |
11,810 |
New York |
9,010 |
Florida |
6,890 |
Arizona |
5,690 |
Georgia |
3,740 |
New Jersey |
3,440 |
Virginia |
3,160 |
Illinois |
3,010 |
Pennsylvania |
2,820 |
| State | Employment |
|---|---|
Texas |
47,160 |
California |
36,090 |
New York |
35,420 |
Florida |
33,040 |
Pennsylvania |
17,590 |
North Carolina |
15,450 |
Georgia |
15,110 |
Virginia |
14,750 |
Illinois |
14,430 |
Ohio |
13,780 |
| State | Employment |
|---|---|
New York |
4,030 |
Illinois |
1,620 |
Florida |
1,450 |
Ohio |
1,400 |
Georgia |
990 |
Texas |
940 |
Michigan |
860 |
Puerto Rico |
830 |
Pennsylvania |
710 |
Kentucky |
640 |
| State | Employment |
|---|---|
Georgia |
390 |
California |
390 |
Arkansas |
200 |
Texas |
100 |
Massachusetts |
100 |
Colorado |
50 |
Utah |
40 |
Alabama |
40 |
Oregon |
30 |
Ohio |
30 |
| State | Employment |
|---|---|
Florida |
2,290 |
Texas |
1,680 |
New Jersey |
1,590 |
California |
680 |
Illinois |
640 |
North Carolina |
450 |
Michigan |
440 |
Tennessee |
320 |
Ohio |
300 |
Connecticut |
260 |
| State | Employment |
|---|---|
California |
33,780 |
Texas |
25,670 |
Florida |
19,560 |
Ohio |
19,200 |
Illinois |
17,180 |
North Carolina |
15,200 |
New York |
14,050 |
Georgia |
11,760 |
Massachusetts |
11,360 |
Virginia |
10,250 |
| State | Employment |
|---|---|
California |
10,480 |
New York |
8,720 |
Texas |
5,820 |
Florida |
5,540 |
Illinois |
3,030 |
Virginia |
2,870 |
Pennsylvania |
2,810 |
Maryland |
2,730 |
Ohio |
2,480 |
New Jersey |
2,170 |
| State | Employment |
|---|---|
Florida |
5,400 |
New York |
4,300 |
Georgia |
3,640 |
Texas |
3,500 |
Illinois |
3,390 |
Massachusetts |
3,070 |
California |
3,000 |
Washington |
2,600 |
North Carolina |
2,580 |
Ohio |
2,300 |
| State | Employment |
|---|---|
New York |
13,230 |
Florida |
8,150 |
Georgia |
6,830 |
Texas |
6,530 |
Illinois |
5,730 |
New Jersey |
5,330 |
California |
4,930 |
Massachusetts |
4,730 |
North Carolina |
4,720 |
Tennessee |
3,930 |
| State | Employment |
|---|---|
California |
4,820 |
Texas |
4,550 |
New York |
3,890 |
Florida |
2,870 |
Virginia |
2,470 |
Georgia |
2,350 |
Illinois |
2,110 |
Maryland |
1,970 |
Arizona |
1,640 |
North Carolina |
1,290 |
| State | Employment |
|---|---|
California |
403,270 |
New York |
314,490 |
Texas |
299,220 |
Florida |
244,590 |
Illinois |
146,520 |
Pennsylvania |
130,140 |
Ohio |
117,130 |
New Jersey |
113,430 |
Georgia |
111,350 |
Virginia |
106,920 |
| State | Employment |
|---|---|
California |
11,640 |
Texas |
7,490 |
New Jersey |
5,740 |
Florida |
5,740 |
New York |
5,390 |
North Carolina |
3,650 |
Maryland |
3,590 |
Ohio |
3,080 |
Louisiana |
3,060 |
Washington |
2,810 |
| State | Employment |
|---|---|
California |
12,860 |
Texas |
9,490 |
Florida |
7,880 |
New York |
6,360 |
Ohio |
5,990 |
North Carolina |
5,960 |
Pennsylvania |
5,410 |
Illinois |
5,200 |
New Jersey |
4,870 |
Georgia |
4,350 |
| State | Employment |
|---|---|
California |
12,360 |
Texas |
6,060 |
Florida |
5,410 |
New York |
4,890 |
Virginia |
4,320 |
North Carolina |
4,290 |
Ohio |
3,790 |
Washington |
3,670 |
Michigan |
3,580 |
Tennessee |
2,720 |
| State | Employment |
|---|---|
California |
8,820 |
Texas |
2,670 |
Tennessee |
2,550 |
Pennsylvania |
2,520 |
Florida |
1,880 |
New York |
1,670 |
Puerto Rico |
1,510 |
Washington |
1,240 |
Louisiana |
1,160 |
Georgia |
900 |
| State | Employment |
|---|---|
California |
5,270 |
Florida |
4,440 |
Texas |
4,280 |
New York |
2,700 |
Pennsylvania |
2,640 |
Virginia |
2,560 |
Georgia |
1,930 |
Illinois |
1,790 |
Arizona |
1,590 |
Oregon |
1,470 |
| State | Employment |
|---|---|
California |
7,510 |
New York |
3,590 |
Texas |
3,290 |
Florida |
2,620 |
New Jersey |
2,440 |
Illinois |
2,370 |
Pennsylvania |
2,080 |
Ohio |
2,050 |
North Carolina |
2,040 |
Michigan |
1,850 |
| State | Employment |
|---|---|
California |
96,850 |
Texas |
65,170 |
Florida |
57,410 |
Pennsylvania |
29,280 |
New York |
27,730 |
Georgia |
27,180 |
Ohio |
25,640 |
Michigan |
24,580 |
Illinois |
22,940 |
North Carolina |
19,640 |
| State | Employment |
|---|---|
California |
56,840 |
Texas |
31,550 |
Florida |
20,550 |
New York |
19,520 |
Illinois |
13,170 |
Pennsylvania |
11,400 |
Ohio |
10,910 |
Washington |
10,780 |
New Jersey |
10,300 |
Michigan |
9,610 |
| State | Employment |
|---|---|
California |
16,330 |
Florida |
8,320 |
Texas |
6,970 |
New York |
6,580 |
Colorado |
5,490 |
Washington |
5,060 |
Illinois |
4,370 |
Pennsylvania |
4,000 |
Virginia |
3,090 |
New Jersey |
3,080 |
| State | Employment |
|---|---|
California |
7,220 |
Texas |
5,070 |
New Jersey |
3,560 |
New York |
3,290 |
Florida |
2,040 |
Pennsylvania |
1,990 |
Louisiana |
1,750 |
Michigan |
1,700 |
Tennessee |
1,540 |
Maryland |
1,540 |
| State | Employment |
|---|---|
Texas |
7,550 |
Florida |
6,780 |
Ohio |
6,040 |
California |
5,750 |
New York |
5,410 |
Pennsylvania |
5,330 |
Illinois |
3,980 |
Michigan |
3,540 |
Tennessee |
3,290 |
Virginia |
2,930 |
| State | Employment |
|---|---|
Illinois |
2,410 |
California |
670 |
Texas |
530 |
Louisiana |
360 |
Florida |
340 |
Pennsylvania |
320 |
New York |
260 |
Virginia |
230 |
Ohio |
200 |
Nebraska |
200 |
| State | Employment |
|---|---|
Ohio |
3,990 |
Texas |
3,900 |
Florida |
3,050 |
New York |
2,880 |
Pennsylvania |
2,670 |
California |
2,640 |
Illinois |
2,240 |
Wisconsin |
1,570 |
North Carolina |
1,390 |
Indiana |
1,350 |
| State | Employment |
|---|---|
New York |
5,770 |
Texas |
5,170 |
Mississippi |
3,100 |
Florida |
3,010 |
Pennsylvania |
2,660 |
Michigan |
2,530 |
New Jersey |
2,380 |
Tennessee |
1,770 |
West Virginia |
1,700 |
Missouri |
1,680 |
| State | Employment |
|---|---|
California |
3,780 |
Texas |
3,330 |
New York |
3,070 |
New Jersey |
2,820 |
Pennsylvania |
2,610 |
Ohio |
2,370 |
Illinois |
2,280 |
Massachusetts |
2,210 |
Florida |
2,050 |
Michigan |
1,840 |
| State | Employment |
|---|---|
California |
100,190 |
Florida |
87,840 |
New York |
85,090 |
Texas |
80,110 |
Pennsylvania |
75,090 |
Ohio |
64,360 |
Illinois |
60,370 |
North Carolina |
56,780 |
New Jersey |
53,980 |
Michigan |
51,270 |
| State | Employment |
|---|---|
California |
595,760 |
New York |
444,880 |
Texas |
300,820 |
Pennsylvania |
183,430 |
Massachusetts |
108,670 |
Minnesota |
103,830 |
Ohio |
94,870 |
Illinois |
89,040 |
Florida |
76,040 |
Wisconsin |
72,060 |
| State | Employment |
|---|---|
California |
945,700 |
New York |
629,090 |
Texas |
543,430 |
Pennsylvania |
335,890 |
Florida |
295,400 |
Ohio |
229,320 |
Illinois |
217,110 |
Massachusetts |
192,280 |
Michigan |
180,500 |
North Carolina |
177,750 |
| State | Employment |
|---|---|
Maryland |
2,560 |
Louisiana |
2,440 |
Tennessee |
2,280 |
Washington |
1,500 |
Pennsylvania |
1,480 |
Wisconsin |
1,040 |
Massachusetts |
790 |
Connecticut |
780 |
North Carolina |
750 |
Colorado |
680 |
| State | Employment |
|---|---|
New York |
190 |
Texas |
150 |
Massachusetts |
150 |
Pennsylvania |
140 |
Ohio |
130 |
North Carolina |
130 |
Michigan |
100 |
Washington |
80 |
New Jersey |
80 |
Florida |
80 |
| State | Employment |
|---|---|
Texas |
2,430 |
Pennsylvania |
1,660 |
Illinois |
1,540 |
Florida |
1,530 |
New York |
1,280 |
California |
1,270 |
Ohio |
1,250 |
Georgia |
990 |
Virginia |
970 |
North Carolina |
950 |
| State | Employment |
|---|---|
California |
40,900 |
Texas |
28,940 |
Florida |
22,870 |
Ohio |
16,500 |
New York |
14,990 |
Pennsylvania |
14,270 |
Illinois |
12,730 |
North Carolina |
11,860 |
Georgia |
9,350 |
Washington |
8,650 |
| State | Employment |
|---|---|
California |
750 |
Texas |
650 |
Virginia |
400 |
Michigan |
390 |
Illinois |
300 |
Georgia |
280 |
Missouri |
260 |
Arizona |
240 |
North Carolina |
230 |
Indiana |
230 |
| State | Employment |
|---|---|
California |
850 |
Michigan |
820 |
Pennsylvania |
530 |
Florida |
470 |
New York |
400 |
Illinois |
380 |
North Carolina |
350 |
Massachusetts |
350 |
Georgia |
330 |
Arizona |
280 |
| State | Employment |
|---|---|
California |
8,050 |
Texas |
6,390 |
Florida |
4,070 |
Michigan |
3,590 |
Ohio |
3,240 |
Illinois |
3,040 |
New York |
2,840 |
Pennsylvania |
2,570 |
Indiana |
2,040 |
Minnesota |
2,000 |
| State | Employment |
|---|---|
Texas |
70,290 |
California |
67,590 |
New York |
46,320 |
Florida |
45,960 |
Ohio |
41,150 |
Pennsylvania |
36,970 |
Tennessee |
25,360 |
Georgia |
22,610 |
Virginia |
21,700 |
Illinois |
19,930 |
| State | Employment |
|---|---|
Texas |
6,220 |
New York |
4,270 |
Florida |
4,050 |
California |
3,760 |
North Carolina |
2,590 |
Ohio |
2,550 |
New Jersey |
2,480 |
Illinois |
2,040 |
Pennsylvania |
1,830 |
Massachusetts |
1,810 |
| State | Employment |
|---|---|
Texas |
12,280 |
California |
9,750 |
Florida |
8,660 |
Pennsylvania |
5,250 |
New York |
5,020 |
Illinois |
4,000 |
North Carolina |
3,600 |
Ohio |
3,590 |
Colorado |
3,570 |
Massachusetts |
3,430 |
| State | Employment |
|---|---|
Texas |
10,220 |
California |
9,480 |
Florida |
7,540 |
New York |
5,620 |
Michigan |
4,240 |
Pennsylvania |
4,140 |
Georgia |
4,040 |
Illinois |
3,770 |
Ohio |
3,700 |
North Carolina |
3,450 |
| State | Employment |
|---|---|
California |
9,490 |
Florida |
8,510 |
Illinois |
4,650 |
Texas |
4,430 |
Wisconsin |
3,790 |
Virginia |
3,650 |
Arizona |
3,110 |
Pennsylvania |
2,490 |
Michigan |
2,440 |
Indiana |
2,260 |
| State | Employment |
|---|---|
Texas |
38,550 |
California |
36,560 |
Florida |
29,800 |
Illinois |
21,090 |
New York |
20,360 |
Pennsylvania |
18,250 |
Ohio |
16,470 |
Michigan |
15,040 |
North Carolina |
13,560 |
Georgia |
11,360 |
| State | Employment |
|---|---|
California |
5,270 |
Illinois |
3,380 |
Texas |
2,070 |
Florida |
1,740 |
Ohio |
1,400 |
Massachusetts |
1,260 |
Pennsylvania |
1,080 |
New York |
1,040 |
Michigan |
920 |
Tennessee |
810 |
| State | Employment |
|---|---|
California |
21,990 |
Texas |
19,380 |
New York |
18,610 |
Pennsylvania |
13,890 |
Florida |
11,790 |
Illinois |
11,420 |
North Carolina |
10,680 |
Georgia |
9,370 |
Ohio |
9,340 |
New Jersey |
8,370 |
| State | Employment |
|---|---|
California |
3,150 |
Florida |
3,040 |
Texas |
2,540 |
New York |
2,410 |
Illinois |
2,130 |
Pennsylvania |
1,480 |
Tennessee |
1,400 |
Massachusetts |
1,400 |
Ohio |
1,350 |
Michigan |
1,350 |
| State | Employment |
|---|---|
California |
17,390 |
Texas |
16,480 |
Florida |
13,830 |
New York |
12,620 |
Pennsylvania |
10,150 |
Ohio |
8,280 |
Illinois |
8,260 |
North Carolina |
7,180 |
Michigan |
6,750 |
Georgia |
5,870 |
| State | Employment |
|---|---|
Florida |
1,600 |
California |
1,330 |
Texas |
1,180 |
New York |
970 |
Pennsylvania |
860 |
Ohio |
860 |
Illinois |
720 |
New Jersey |
620 |
Michigan |
610 |
Georgia |
550 |
| State | Employment |
|---|---|
California |
6,650 |
New York |
5,880 |
Florida |
5,380 |
Texas |
5,120 |
Illinois |
3,030 |
Ohio |
2,940 |
Pennsylvania |
2,820 |
New Jersey |
2,800 |
Michigan |
2,660 |
Georgia |
2,390 |
| State | Employment |
|---|---|
Texas |
5,450 |
Florida |
5,080 |
California |
4,830 |
New York |
3,370 |
Pennsylvania |
3,180 |
Illinois |
2,780 |
Michigan |
2,340 |
Ohio |
1,820 |
Virginia |
1,610 |
Georgia |
1,470 |
| State | Employment |
|---|---|
California |
27,220 |
Texas |
27,120 |
Florida |
19,890 |
New York |
18,110 |
Pennsylvania |
13,870 |
Illinois |
13,470 |
Michigan |
12,200 |
North Carolina |
12,030 |
Georgia |
11,330 |
Massachusetts |
11,280 |
| State | Employment |
|---|---|
Maryland |
5,470 |
California |
4,950 |
New York |
2,720 |
Georgia |
2,600 |
Indiana |
1,640 |
Florida |
1,620 |
Texas |
1,310 |
New Jersey |
1,260 |
Washington |
1,230 |
Massachusetts |
970 |
| State | Employment |
|---|---|
California |
23,320 |
Texas |
14,310 |
New York |
11,620 |
Florida |
11,310 |
Ohio |
9,670 |
Pennsylvania |
9,220 |
Michigan |
9,140 |
Illinois |
9,080 |
North Carolina |
7,090 |
New Jersey |
6,790 |
| State | Employment |
|---|---|
California |
3,650 |
Texas |
3,480 |
Massachusetts |
2,210 |
Michigan |
1,670 |
Ohio |
1,580 |
Florida |
1,580 |
New Jersey |
1,500 |
Illinois |
1,310 |
Minnesota |
950 |
Indiana |
820 |
| State | Employment |
|---|---|
New York |
38,380 |
California |
32,070 |
Florida |
27,380 |
Texas |
23,490 |
Pennsylvania |
22,160 |
Ohio |
16,910 |
New Jersey |
16,650 |
Massachusetts |
16,510 |
Michigan |
15,810 |
North Carolina |
14,080 |
| State | Employment |
|---|---|
New York |
3,690 |
California |
3,560 |
Texas |
1,480 |
Florida |
1,240 |
Pennsylvania |
1,180 |
Illinois |
1,120 |
New Jersey |
920 |
Massachusetts |
920 |
Ohio |
800 |
Michigan |
700 |
| State | Employment |
|---|---|
California |
3,160 |
Texas |
2,250 |
Ohio |
1,850 |
Massachusetts |
1,460 |
Michigan |
1,150 |
Arizona |
1,010 |
Tennessee |
1,000 |
New Jersey |
930 |
North Carolina |
800 |
Maryland |
720 |
| State | Employment |
|---|---|
New York |
1,580 |
California |
1,540 |
Texas |
1,500 |
Florida |
1,090 |
Michigan |
930 |
Ohio |
860 |
Georgia |
780 |
Illinois |
680 |
Minnesota |
660 |
Colorado |
650 |
| State | Employment |
|---|---|
Texas |
4,520 |
California |
3,410 |
Massachusetts |
2,980 |
Illinois |
2,390 |
Michigan |
2,290 |
Ohio |
1,860 |
District of Columbia |
1,500 |
Minnesota |
1,390 |
Florida |
1,240 |
New Jersey |
1,150 |
| State | Employment |
|---|---|
Florida |
11,830 |
California |
11,050 |
Texas |
8,380 |
Illinois |
7,400 |
Missouri |
5,870 |
Virginia |
4,230 |
Arizona |
4,110 |
Michigan |
3,270 |
Pennsylvania |
3,210 |
Ohio |
2,940 |
| State | Employment |
|---|---|
California |
3,850 |
Texas |
2,550 |
New York |
1,540 |
Illinois |
1,500 |
Florida |
1,180 |
New Jersey |
1,160 |
Ohio |
1,150 |
Michigan |
990 |
Tennessee |
920 |
Indiana |
760 |
| State | Employment |
|---|---|
California |
950 |
Florida |
830 |
New York |
720 |
Texas |
610 |
Illinois |
600 |
Virginia |
530 |
Pennsylvania |
460 |
North Carolina |
450 |
Michigan |
450 |
Washington |
420 |
| State | Employment |
|---|---|
New York |
14,060 |
California |
13,900 |
Texas |
13,620 |
Florida |
12,310 |
Ohio |
8,950 |
Tennessee |
7,850 |
Pennsylvania |
7,820 |
Georgia |
7,690 |
Illinois |
6,750 |
Massachusetts |
6,520 |
| State | Employment |
|---|---|
California |
690 |
Texas |
540 |
Georgia |
520 |
New York |
480 |
Pennsylvania |
400 |
Ohio |
330 |
Florida |
330 |
Massachusetts |
310 |
Illinois |
290 |
Michigan |
280 |
| State | Employment |
|---|---|
Texas |
4,300 |
North Carolina |
3,190 |
Tennessee |
2,680 |
Ohio |
2,450 |
Michigan |
2,330 |
Pennsylvania |
2,010 |
New York |
1,900 |
Minnesota |
1,900 |
Illinois |
1,660 |
California |
1,270 |
| State | Employment |
|---|---|
California |
302,770 |
Texas |
218,090 |
Florida |
181,670 |
New York |
178,320 |
Pennsylvania |
148,040 |
Illinois |
129,530 |
Ohio |
125,470 |
North Carolina |
99,960 |
Michigan |
96,900 |
Massachusetts |
81,020 |
| State | Employment |
|---|---|
California |
7,380 |
Texas |
4,770 |
Florida |
4,690 |
New York |
3,890 |
Pennsylvania |
3,560 |
North Carolina |
2,910 |
Ohio |
2,600 |
Illinois |
2,580 |
Virginia |
2,530 |
Colorado |
2,260 |
| State | Employment |
|---|---|
Florida |
1,040 |
Maryland |
990 |
New York |
820 |
California |
810 |
Wisconsin |
730 |
Ohio |
450 |
Tennessee |
370 |
Illinois |
360 |
New Jersey |
350 |
Kentucky |
340 |
| State | Employment |
|---|---|
Michigan |
550 |
California |
480 |
Illinois |
440 |
Pennsylvania |
420 |
Florida |
350 |
New York |
330 |
Wisconsin |
310 |
Georgia |
300 |
North Carolina |
280 |
Ohio |
270 |
| State | Employment |
|---|---|
California |
14,980 |
Texas |
14,820 |
New York |
13,130 |
Florida |
9,120 |
Illinois |
7,510 |
Ohio |
6,200 |
New Jersey |
5,750 |
Pennsylvania |
5,700 |
North Carolina |
4,450 |
Michigan |
4,300 |
| State | Employment |
|---|---|
California |
16,650 |
Texas |
11,730 |
Florida |
8,080 |
Ohio |
6,190 |
Pennsylvania |
5,930 |
New York |
5,860 |
Michigan |
4,520 |
Georgia |
4,320 |
Illinois |
4,310 |
North Carolina |
4,240 |
| State | Employment |
|---|---|
California |
1,580 |
New York |
1,450 |
Texas |
1,400 |
Pennsylvania |
1,150 |
Massachusetts |
870 |
Michigan |
780 |
Illinois |
740 |
Wisconsin |
730 |
Ohio |
690 |
Arizona |
670 |
| State | Employment |
|---|---|
Texas |
1,990 |
New York |
1,170 |
California |
1,160 |
Wisconsin |
1,050 |
Florida |
1,030 |
Pennsylvania |
670 |
Illinois |
620 |
New Jersey |
600 |
North Carolina |
590 |
Ohio |
570 |
| State | Employment |
|---|---|
California |
21,730 |
New York |
17,710 |
Texas |
15,400 |
Florida |
13,750 |
Pennsylvania |
11,800 |
Illinois |
10,170 |
Ohio |
8,220 |
Michigan |
8,060 |
New Jersey |
7,860 |
Massachusetts |
7,540 |
| State | Employment |
|---|---|
New York |
12,460 |
California |
10,060 |
Texas |
9,180 |
Pennsylvania |
7,680 |
Florida |
7,240 |
Illinois |
5,790 |
Ohio |
5,580 |
New Jersey |
5,100 |
Michigan |
4,620 |
Massachusetts |
4,490 |
| State | Employment |
|---|---|
New York |
1,060 |
California |
1,020 |
Florida |
760 |
Pennsylvania |
650 |
Illinois |
550 |
Texas |
470 |
Michigan |
440 |
New Jersey |
390 |
Ohio |
380 |
Georgia |
310 |
| State | Employment |
|---|---|
New York |
13,270 |
California |
10,890 |
Texas |
8,040 |
Pennsylvania |
7,200 |
Florida |
6,630 |
North Carolina |
5,440 |
Michigan |
4,840 |
Ohio |
4,580 |
Massachusetts |
3,880 |
Georgia |
3,790 |
| State | Employment |
|---|---|
California |
32,150 |
Texas |
22,770 |
New York |
20,180 |
Florida |
19,890 |
Pennsylvania |
14,750 |
Ohio |
12,510 |
Illinois |
11,520 |
New Jersey |
10,080 |
North Carolina |
10,020 |
Georgia |
9,110 |
| State | Employment |
|---|---|
California |
4,270 |
Texas |
2,930 |
Illinois |
2,080 |
Florida |
1,980 |
New York |
1,910 |
Ohio |
1,440 |
Michigan |
1,370 |
Virginia |
1,160 |
Massachusetts |
1,080 |
Indiana |
1,030 |
| State | Employment |
|---|---|
California |
7,880 |
Texas |
5,050 |
New York |
4,640 |
Pennsylvania |
3,520 |
Florida |
3,300 |
Georgia |
2,860 |
Illinois |
2,750 |
Ohio |
2,450 |
North Carolina |
2,160 |
New Jersey |
2,150 |
| State | Employment |
|---|---|
Texas |
670 |
California |
420 |
New York |
280 |
Massachusetts |
270 |
Florida |
250 |
Illinois |
170 |
New Jersey |
160 |
Pennsylvania |
140 |
Ohio |
130 |
Minnesota |
120 |
| State | Employment |
|---|---|
Texas |
570 |
Massachusetts |
480 |
Illinois |
480 |
California |
420 |
Maryland |
400 |
Pennsylvania |
220 |
New Jersey |
220 |
Georgia |
200 |
Ohio |
180 |
Florida |
170 |
| State | Employment |
|---|---|
California |
690 |
New York |
360 |
Pennsylvania |
290 |
Florida |
250 |
Massachusetts |
200 |
Virginia |
160 |
Michigan |
160 |
Iowa |
100 |
Wisconsin |
80 |
Kentucky |
40 |
| State | Employment |
|---|---|
California |
16,220 |
New York |
8,780 |
Texas |
8,590 |
Florida |
7,110 |
Illinois |
3,850 |
Michigan |
3,720 |
North Carolina |
3,440 |
Virginia |
3,430 |
Ohio |
3,370 |
New Jersey |
3,310 |
| State | Employment |
|---|---|
California |
3,250 |
Florida |
2,750 |
Texas |
2,230 |
Illinois |
1,790 |
New York |
1,550 |
Pennsylvania |
1,470 |
Ohio |
1,420 |
Minnesota |
1,170 |
Michigan |
1,160 |
Wisconsin |
1,080 |
| State | Employment |
|---|---|
California |
844,930 |
Texas |
676,860 |
Florida |
547,060 |
New York |
546,900 |
Pennsylvania |
406,110 |
Ohio |
363,390 |
Illinois |
354,470 |
Michigan |
279,500 |
North Carolina |
276,020 |
Georgia |
245,700 |
| State | Employment |
|---|---|
California |
10,350 |
Georgia |
1,010 |
Florida |
860 |
Texas |
790 |
New Jersey |
780 |
Colorado |
650 |
Maryland |
640 |
Virginia |
480 |
Michigan |
440 |
Louisiana |
430 |
| State | Employment |
|---|---|
California |
10,520 |
New York |
4,330 |
Texas |
1,460 |
Georgia |
1,410 |
Florida |
1,220 |
Illinois |
750 |
New Jersey |
590 |
Pennsylvania |
480 |
Massachusetts |
440 |
Michigan |
420 |
| State | Employment |
|---|---|
California |
4,380 |
New York |
2,910 |
Georgia |
1,360 |
Texas |
1,050 |
Florida |
870 |
Pennsylvania |
810 |
Virginia |
750 |
Illinois |
660 |
Tennessee |
600 |
New Jersey |
550 |
| State | Employment |
|---|---|
California |
6,600 |
Florida |
4,790 |
New York |
4,680 |
Texas |
3,300 |
Illinois |
2,460 |
Pennsylvania |
1,880 |
Georgia |
1,860 |
Ohio |
1,670 |
North Carolina |
1,470 |
Michigan |
1,270 |
| State | Employment |
|---|---|
California |
4,160 |
New York |
1,830 |
Florida |
900 |
Texas |
560 |
Georgia |
490 |
New Jersey |
360 |
Maryland |
350 |
Utah |
310 |
Oregon |
300 |
Tennessee |
270 |
| State | Employment |
|---|---|
New York |
4,710 |
California |
3,750 |
Texas |
1,790 |
Florida |
1,780 |
Georgia |
1,320 |
Illinois |
1,040 |
Virginia |
910 |
Pennsylvania |
750 |
South Carolina |
730 |
Colorado |
700 |
| State | Employment |
|---|---|
California |
13,610 |
New York |
7,760 |
Florida |
5,680 |
Texas |
4,820 |
Illinois |
2,930 |
New Jersey |
2,390 |
Pennsylvania |
2,280 |
Georgia |
2,250 |
Nevada |
2,110 |
Massachusetts |
1,960 |
| State | Employment |
|---|---|
California |
8,610 |
Ohio |
1,460 |
Georgia |
1,130 |
Texas |
1,110 |
Nevada |
1,050 |
New Jersey |
930 |
Florida |
860 |
Washington |
840 |
Louisiana |
610 |
Oregon |
570 |
| State | Employment |
|---|---|
California |
2,150 |
Texas |
1,450 |
New York |
1,320 |
Florida |
1,310 |
Pennsylvania |
970 |
Indiana |
680 |
Illinois |
680 |
Michigan |
480 |
Georgia |
470 |
Ohio |
360 |
| State | Employment |
|---|---|
California |
8,050 |
Texas |
6,590 |
New York |
3,770 |
Florida |
2,970 |
Arizona |
2,690 |
Massachusetts |
2,390 |
Virginia |
2,350 |
Ohio |
2,310 |
North Carolina |
2,280 |
Georgia |
1,800 |
| State | Employment |
|---|---|
California |
7,840 |
New York |
7,680 |
Texas |
2,580 |
Florida |
1,910 |
Illinois |
1,730 |
Pennsylvania |
1,600 |
Washington |
1,310 |
New Jersey |
1,310 |
District of Columbia |
1,240 |
Virginia |
1,210 |
| State | Employment |
|---|---|
California |
6,650 |
Texas |
4,700 |
Florida |
2,760 |
Virginia |
2,720 |
Maryland |
2,270 |
New Jersey |
2,260 |
Massachusetts |
2,260 |
Pennsylvania |
2,090 |
New York |
1,740 |
North Carolina |
1,640 |
| State | Employment |
|---|---|
New York |
20,440 |
California |
11,700 |
Texas |
4,800 |
Illinois |
4,370 |
Florida |
4,030 |
Massachusetts |
3,370 |
District of Columbia |
3,250 |
Virginia |
3,060 |
New Jersey |
2,980 |
Pennsylvania |
2,950 |
| State | Employment |
|---|---|
California |
26,700 |
Texas |
26,110 |
New York |
25,760 |
District of Columbia |
18,600 |
Florida |
11,830 |
Illinois |
7,780 |
Virginia |
7,640 |
Ohio |
7,630 |
Pennsylvania |
7,390 |
Massachusetts |
6,790 |
| State | Employment |
|---|---|
New York |
6,020 |
California |
4,500 |
Texas |
2,640 |
District of Columbia |
2,220 |
Florida |
2,050 |
Ohio |
1,610 |
Illinois |
1,430 |
Georgia |
1,400 |
Pennsylvania |
1,350 |
Michigan |
1,140 |
| State | Employment |
|---|---|
California |
2,920 |
Texas |
2,240 |
New York |
1,710 |
Florida |
1,490 |
Michigan |
1,140 |
Illinois |
1,100 |
Ohio |
1,060 |
Pennsylvania |
1,040 |
North Carolina |
1,030 |
Minnesota |
810 |
| State | Employment |
|---|---|
California |
2,530 |
Georgia |
2,360 |
New York |
840 |
Nevada |
840 |
New Jersey |
540 |
Colorado |
540 |
Texas |
380 |
Ohio |
350 |
Arizona |
340 |
Tennessee |
320 |
| State | Employment |
|---|---|
New York |
7,580 |
California |
5,890 |
Tennessee |
2,170 |
Illinois |
2,070 |
Texas |
1,790 |
Florida |
1,450 |
Ohio |
1,440 |
Michigan |
1,200 |
Pennsylvania |
1,120 |
Oregon |
1,100 |
| State | Employment |
|---|---|
New York |
2,490 |
California |
870 |
Texas |
860 |
Oregon |
830 |
Florida |
520 |
Pennsylvania |
420 |
Ohio |
410 |
Michigan |
390 |
New Jersey |
320 |
Illinois |
310 |
| State | Employment |
|---|---|
Texas |
680 |
Minnesota |
420 |
California |
320 |
Louisiana |
310 |
South Dakota |
230 |
Virginia |
200 |
Oregon |
160 |
Illinois |
150 |
Florida |
110 |
South Carolina |
100 |
| State | Employment |
|---|---|
New York |
1,940 |
California |
1,400 |
Texas |
680 |
Nevada |
570 |
Massachusetts |
510 |
Hawaii |
360 |
Florida |
310 |
Illinois |
280 |
Missouri |
250 |
Utah |
230 |
| State | Employment |
|---|---|
California |
2,160 |
Colorado |
1,500 |
Missouri |
1,280 |
Utah |
1,190 |
Illinois |
1,120 |
Kansas |
950 |
Michigan |
880 |
Florida |
880 |
Texas |
840 |
New York |
710 |
| State | Employment |
|---|---|
California |
26,340 |
Texas |
13,990 |
Ohio |
13,880 |
Washington |
13,140 |
New York |
12,610 |
Florida |
10,620 |
Illinois |
9,620 |
New Jersey |
8,180 |
Indiana |
7,590 |
Michigan |
7,500 |
| State | Employment |
|---|---|
Florida |
1,250 |
Pennsylvania |
1,030 |
California |
730 |
Illinois |
610 |
Arizona |
600 |
Indiana |
470 |
New Jersey |
460 |
Georgia |
460 |
Massachusetts |
420 |
Texas |
390 |
| State | Employment |
|---|---|
California |
33,610 |
New York |
27,370 |
Florida |
5,980 |
Texas |
5,260 |
Georgia |
5,110 |
Massachusetts |
3,340 |
Illinois |
3,170 |
Pennsylvania |
2,780 |
North Carolina |
2,760 |
District of Columbia |
2,550 |
| State | Employment |
|---|---|
California |
19,470 |
New York |
7,440 |
Illinois |
3,950 |
Georgia |
3,000 |
Louisiana |
2,240 |
Pennsylvania |
2,050 |
Maryland |
1,220 |
Texas |
1,120 |
Colorado |
650 |
Indiana |
630 |
| State | Employment |
|---|---|
California |
2,410 |
Georgia |
1,230 |
Louisiana |
1,000 |
New York |
940 |
Florida |
620 |
Tennessee |
470 |
Texas |
320 |
Minnesota |
290 |
Colorado |
270 |
Maryland |
230 |
| State | Employment |
|---|---|
California |
3,020 |
New York |
2,350 |
Georgia |
620 |
Texas |
580 |
Florida |
510 |
Ohio |
420 |
Illinois |
340 |
Nevada |
330 |
New Mexico |
280 |
Pennsylvania |
250 |
| State | Employment |
|---|---|
California |
18,910 |
Texas |
18,550 |
Florida |
8,070 |
New York |
7,400 |
Georgia |
6,720 |
Michigan |
5,970 |
Illinois |
5,240 |
Pennsylvania |
4,980 |
Ohio |
4,920 |
New Jersey |
3,600 |
| State | Employment |
|---|---|
California |
9,420 |
New York |
5,250 |
Texas |
4,830 |
Florida |
4,410 |
Colorado |
2,370 |
Ohio |
2,330 |
Illinois |
2,260 |
Georgia |
2,200 |
Minnesota |
1,800 |
Pennsylvania |
1,660 |
| State | Employment |
|---|---|
California |
29,060 |
New York |
21,090 |
Texas |
14,050 |
Florida |
13,830 |
Illinois |
11,700 |
Pennsylvania |
7,650 |
Ohio |
7,600 |
North Carolina |
6,470 |
Massachusetts |
6,330 |
Michigan |
6,000 |
| State | Employment |
|---|---|
California |
4,640 |
Florida |
2,570 |
Texas |
2,560 |
Illinois |
2,270 |
Missouri |
2,060 |
New York |
2,040 |
Ohio |
1,650 |
Pennsylvania |
1,520 |
Michigan |
1,170 |
Massachusetts |
1,170 |
| State | Employment |
|---|---|
New York |
8,460 |
California |
7,180 |
Florida |
680 |
Oregon |
570 |
Georgia |
570 |
Massachusetts |
450 |
Washington |
410 |
New Jersey |
370 |
Texas |
300 |
Ohio |
250 |
| State | Employment |
|---|---|
Michigan |
4,520 |
California |
3,910 |
New York |
2,040 |
Texas |
1,910 |
Illinois |
1,260 |
Florida |
1,230 |
Massachusetts |
1,180 |
New Jersey |
1,050 |
Pennsylvania |
1,040 |
Ohio |
1,040 |
| State | Employment |
|---|---|
California |
620 |
Maryland |
530 |
Florida |
510 |
Utah |
480 |
Georgia |
390 |
Virginia |
280 |
Colorado |
250 |
Texas |
230 |
New York |
230 |
Pennsylvania |
140 |
| State | Employment |
|---|---|
California |
11,910 |
New York |
2,600 |
Texas |
2,320 |
Georgia |
1,180 |
Washington |
1,160 |
Florida |
830 |
Massachusetts |
650 |
Oregon |
590 |
Michigan |
550 |
Illinois |
530 |
| State | Employment |
|---|---|
California |
2,220 |
New York |
1,700 |
Florida |
880 |
Texas |
700 |
Ohio |
500 |
Oregon |
340 |
Massachusetts |
340 |
Illinois |
280 |
Washington |
270 |
Utah |
240 |
| State | Employment |
|---|---|
Texas |
480 |
California |
430 |
Colorado |
210 |
Michigan |
200 |
Ohio |
190 |
Missouri |
170 |
Pennsylvania |
150 |
Florida |
150 |
Utah |
140 |
North Carolina |
130 |
| State | Employment |
|---|---|
New York |
8,720 |
California |
8,300 |
Illinois |
2,740 |
Texas |
2,510 |
Florida |
1,630 |
Massachusetts |
1,440 |
Pennsylvania |
1,400 |
Michigan |
1,280 |
Ohio |
1,040 |
New Jersey |
1,020 |
| State | Employment |
|---|---|
California |
327,840 |
New York |
221,800 |
Texas |
141,300 |
Florida |
105,470 |
Illinois |
77,420 |
Ohio |
65,480 |
Georgia |
64,000 |
Pennsylvania |
61,200 |
Michigan |
54,050 |
Massachusetts |
52,440 |
| State | Employment |
|---|---|
California |
35,680 |
North Carolina |
11,400 |
Oregon |
5,110 |
Georgia |
4,980 |
Texas |
4,880 |
Florida |
3,280 |
Nevada |
3,110 |
Colorado |
2,610 |
New Jersey |
2,320 |
Ohio |
2,260 |
| State | Employment |
|---|---|
California |
163,260 |
New York |
131,100 |
Texas |
88,330 |
Illinois |
60,830 |
New Jersey |
57,080 |
Pennsylvania |
49,610 |
Florida |
49,490 |
Ohio |
42,860 |
Washington |
40,040 |
Massachusetts |
37,940 |
| State | Employment |
|---|---|
California |
23,920 |
Florida |
14,480 |
Michigan |
13,810 |
Texas |
9,530 |
New York |
9,310 |
Maryland |
6,120 |
Missouri |
5,110 |
Georgia |
4,760 |
Illinois |
3,780 |
Indiana |
3,330 |
| State | Employment |
|---|---|
California |
20,910 |
Texas |
18,560 |
New York |
17,120 |
Georgia |
11,080 |
Florida |
9,720 |
Pennsylvania |
6,730 |
Illinois |
5,680 |
Virginia |
5,290 |
North Carolina |
4,900 |
Massachusetts |
4,620 |
| State | Employment |
|---|---|
Kentucky |
1,070 |
Florida |
630 |
Michigan |
520 |
Nebraska |
470 |
Tennessee |
460 |
Indiana |
430 |
Alabama |
420 |
Texas |
400 |
Virginia |
340 |
Kansas |
270 |
| State | Employment |
|---|---|
California |
11,220 |
New York |
8,400 |
Illinois |
6,490 |
Ohio |
4,150 |
Texas |
3,740 |
Michigan |
3,230 |
Florida |
3,060 |
Massachusetts |
3,040 |
Wisconsin |
2,890 |
Colorado |
2,750 |
| State | Employment |
|---|---|
New York |
12,990 |
California |
10,300 |
Texas |
9,670 |
Illinois |
6,620 |
Pennsylvania |
5,400 |
Florida |
4,970 |
Ohio |
4,810 |
Massachusetts |
4,730 |
North Carolina |
4,530 |
Virginia |
4,410 |
| State | Employment |
|---|---|
California |
2,030 |
New York |
1,480 |
Missouri |
850 |
Illinois |
770 |
Pennsylvania |
640 |
Virginia |
570 |
Massachusetts |
510 |
Texas |
480 |
District of Columbia |
460 |
Maryland |
410 |
| State | Employment |
|---|---|
New York |
1,580 |
California |
1,320 |
Florida |
770 |
Pennsylvania |
670 |
Texas |
610 |
Massachusetts |
560 |
North Carolina |
540 |
Illinois |
410 |
Ohio |
360 |
Virginia |
330 |
| State | Employment |
|---|---|
New York |
1,000 |
California |
520 |
New Jersey |
420 |
Maryland |
390 |
Texas |
310 |
Massachusetts |
270 |
Pennsylvania |
230 |
Florida |
230 |
Georgia |
220 |
Virginia |
190 |
| State | Employment |
|---|---|
California |
69,720 |
Florida |
24,080 |
Texas |
21,820 |
New York |
18,790 |
Michigan |
10,130 |
Illinois |
9,840 |
Maryland |
9,720 |
New Jersey |
8,140 |
Virginia |
7,810 |
Ohio |
7,700 |
| State | Employment |
|---|---|
California |
103,210 |
Texas |
85,390 |
New York |
32,440 |
Virginia |
25,350 |
Illinois |
23,340 |
North Carolina |
20,830 |
New Jersey |
18,130 |
Florida |
15,810 |
Washington |
15,620 |
Michigan |
15,380 |
| State | Employment |
|---|---|
New York |
33,030 |
California |
32,210 |
Florida |
12,770 |
Texas |
12,080 |
Illinois |
11,610 |
Pennsylvania |
10,190 |
New Jersey |
9,540 |
Massachusetts |
9,060 |
Ohio |
8,330 |
North Carolina |
8,230 |
| State | Employment |
|---|---|
California |
8,670 |
Texas |
3,650 |
New York |
3,650 |
North Carolina |
3,600 |
Washington |
2,150 |
Illinois |
2,150 |
Pennsylvania |
1,290 |
Massachusetts |
1,250 |
Georgia |
1,160 |
Virginia |
1,040 |
| State | Employment |
|---|---|
California |
7,420 |
Florida |
3,490 |
New York |
3,060 |
Virginia |
1,830 |
Michigan |
1,800 |
Texas |
1,750 |
Oregon |
1,310 |
Ohio |
1,240 |
Georgia |
1,190 |
New Jersey |
1,140 |
| State | Employment |
|---|---|
New York |
17,340 |
Texas |
13,990 |
California |
9,750 |
Illinois |
8,710 |
Pennsylvania |
7,970 |
Ohio |
7,770 |
New Jersey |
6,100 |
Minnesota |
5,000 |
Florida |
4,920 |
Massachusetts |
4,730 |
| State | Employment |
|---|---|
New York |
10,960 |
Texas |
8,450 |
New Jersey |
7,010 |
Ohio |
3,850 |
Massachusetts |
3,410 |
Illinois |
3,280 |
Pennsylvania |
3,160 |
Virginia |
3,120 |
Florida |
3,120 |
Georgia |
3,080 |
| State | Employment |
|---|---|
New York |
20,500 |
Texas |
15,600 |
California |
15,320 |
New Jersey |
11,810 |
Illinois |
11,090 |
Ohio |
7,700 |
Florida |
6,910 |
North Carolina |
6,570 |
Massachusetts |
6,200 |
Virginia |
5,740 |
| State | Employment |
|---|---|
New York |
5,930 |
Florida |
1,040 |
Minnesota |
1,020 |
Ohio |
960 |
Illinois |
870 |
Massachusetts |
840 |
Colorado |
810 |
Washington |
800 |
Texas |
760 |
California |
660 |
| State | Employment |
|---|---|
Texas |
12,010 |
Florida |
5,200 |
New York |
4,680 |
North Carolina |
4,490 |
Ohio |
4,060 |
Pennsylvania |
3,700 |
California |
3,100 |
Washington |
2,980 |
Virginia |
2,770 |
Massachusetts |
2,540 |
| State | Employment |
|---|---|
California |
109,840 |
Texas |
107,190 |
New York |
75,360 |
Florida |
50,640 |
Ohio |
47,510 |
Pennsylvania |
46,130 |
Illinois |
44,810 |
Missouri |
30,640 |
New Jersey |
30,230 |
Massachusetts |
27,120 |
| State | Employment |
|---|---|
Texas |
1,550 |
New York |
1,480 |
North Carolina |
1,130 |
Georgia |
780 |
Florida |
490 |
Pennsylvania |
480 |
Washington |
460 |
California |
360 |
Virginia |
350 |
Nebraska |
330 |
| State | Employment |
|---|---|
Texas |
64,340 |
New York |
42,010 |
California |
39,780 |
Florida |
33,600 |
Ohio |
30,880 |
Georgia |
28,440 |
New Jersey |
26,590 |
Pennsylvania |
26,460 |
Illinois |
21,700 |
North Carolina |
18,770 |
| State | Employment |
|---|---|
California |
164,910 |
Texas |
131,880 |
New York |
92,560 |
Florida |
77,170 |
Illinois |
64,270 |
Ohio |
57,220 |
Pennsylvania |
57,100 |
Georgia |
50,250 |
North Carolina |
42,520 |
New Jersey |
40,640 |
| State | Employment |
|---|---|
Texas |
15,770 |
California |
9,870 |
Florida |
9,180 |
New York |
6,450 |
Washington |
5,360 |
New Jersey |
5,290 |
Illinois |
5,080 |
Virginia |
4,030 |
North Carolina |
3,890 |
Minnesota |
3,590 |
| State | Employment |
|---|---|
California |
53,290 |
Texas |
33,810 |
Florida |
31,060 |
Illinois |
25,030 |
New York |
23,890 |
Massachusetts |
17,070 |
New Jersey |
16,420 |
Ohio |
15,430 |
North Carolina |
15,350 |
Pennsylvania |
14,400 |
| State | Employment |
|---|---|
California |
68,650 |
Florida |
18,400 |
Georgia |
10,560 |
Massachusetts |
7,620 |
South Carolina |
6,420 |
Maryland |
5,620 |
Louisiana |
5,550 |
New York |
5,390 |
Pennsylvania |
5,110 |
North Carolina |
4,450 |
| State | Employment |
|---|---|
California |
10,540 |
Texas |
10,440 |
North Carolina |
7,750 |
Florida |
7,230 |
New York |
4,860 |
Illinois |
4,800 |
Washington |
4,670 |
Pennsylvania |
4,620 |
Georgia |
3,660 |
Indiana |
3,300 |
| State | Employment |
|---|---|
California |
2,150 |
Texas |
1,580 |
New York |
990 |
North Carolina |
960 |
Virginia |
900 |
Pennsylvania |
840 |
Ohio |
610 |
Massachusetts |
550 |
Illinois |
510 |
Washington |
450 |
| State | Employment |
|---|---|
California |
280 |
Ohio |
170 |
Alabama |
150 |
Texas |
140 |
Washington |
110 |
Mississippi |
100 |
Missouri |
80 |
Tennessee |
70 |
Oklahoma |
70 |
Kentucky |
60 |
| State | Employment |
|---|---|
New York |
3,280 |
California |
2,940 |
Texas |
1,320 |
Ohio |
1,120 |
Pennsylvania |
1,020 |
Illinois |
1,020 |
Virginia |
970 |
Michigan |
790 |
North Carolina |
690 |
Massachusetts |
650 |
| State | Employment |
|---|---|
New York |
2,190 |
Texas |
2,160 |
California |
1,380 |
Virginia |
1,090 |
Pennsylvania |
1,030 |
Ohio |
950 |
Massachusetts |
950 |
North Carolina |
720 |
Illinois |
720 |
New Jersey |
710 |
| State | Employment |
|---|---|
California |
3,040 |
New York |
2,610 |
Pennsylvania |
1,460 |
Massachusetts |
1,450 |
Texas |
1,430 |
Ohio |
1,130 |
Virginia |
1,090 |
Illinois |
790 |
North Carolina |
740 |
District of Columbia |
650 |
| State | Employment |
|---|---|
New York |
8,130 |
California |
6,820 |
Texas |
5,250 |
Pennsylvania |
3,500 |
Illinois |
3,100 |
New Jersey |
2,610 |
Massachusetts |
2,580 |
Ohio |
2,550 |
North Carolina |
2,540 |
Virginia |
2,250 |
| State | Employment |
|---|---|
New York |
3,280 |
Texas |
2,260 |
California |
2,170 |
Illinois |
1,660 |
Pennsylvania |
1,440 |
Ohio |
1,230 |
New Jersey |
970 |
Indiana |
970 |
North Carolina |
930 |
Michigan |
840 |
| State | Employment |
|---|---|
New York |
11,590 |
California |
9,990 |
Texas |
5,830 |
Massachusetts |
5,780 |
Pennsylvania |
4,380 |
Illinois |
4,250 |
Ohio |
3,870 |
Virginia |
3,320 |
Florida |
3,140 |
New Jersey |
2,780 |
| State | Employment |
|---|---|
New York |
2,750 |
Pennsylvania |
820 |
Ohio |
680 |
Illinois |
620 |
Texas |
570 |
North Carolina |
550 |
Missouri |
550 |
Michigan |
550 |
Minnesota |
490 |
California |
480 |
| State | Employment |
|---|---|
New York |
3,330 |
California |
1,540 |
District of Columbia |
1,490 |
Texas |
1,000 |
Illinois |
740 |
Pennsylvania |
680 |
Virginia |
600 |
Florida |
600 |
Massachusetts |
540 |
Ohio |
520 |
| State | Employment |
|---|---|
North Carolina |
1,560 |
California |
1,250 |
Texas |
1,150 |
New York |
1,130 |
Ohio |
820 |
Pennsylvania |
800 |
Illinois |
560 |
Florida |
520 |
Utah |
500 |
Massachusetts |
490 |
| State | Employment |
|---|---|
Illinois |
360 |
Texas |
310 |
Pennsylvania |
290 |
California |
270 |
New York |
260 |
Tennessee |
230 |
Michigan |
200 |
Alabama |
160 |
Georgia |
150 |
Ohio |
130 |
| State | Employment |
|---|---|
New York |
6,210 |
Texas |
4,650 |
Illinois |
3,870 |
California |
3,170 |
Ohio |
2,850 |
Pennsylvania |
2,530 |
Virginia |
2,430 |
North Carolina |
2,420 |
Wisconsin |
1,950 |
District of Columbia |
1,940 |
| State | Employment |
|---|---|
New York |
5,030 |
Texas |
4,310 |
California |
3,970 |
Pennsylvania |
3,420 |
Ohio |
3,410 |
Florida |
3,110 |
North Carolina |
2,230 |
Illinois |
2,130 |
New Jersey |
2,090 |
Massachusetts |
2,020 |
| State | Employment |
|---|---|
New York |
22,350 |
Texas |
17,920 |
Pennsylvania |
15,130 |
North Carolina |
11,770 |
Ohio |
10,560 |
Illinois |
9,660 |
Florida |
9,390 |
California |
9,180 |
Wisconsin |
6,560 |
Colorado |
5,830 |
| State | Employment |
|---|---|
New York |
3,630 |
California |
2,050 |
Texas |
1,420 |
Illinois |
1,170 |
Puerto Rico |
1,010 |
Florida |
760 |
North Carolina |
710 |
Pennsylvania |
600 |
Michigan |
590 |
New Mexico |
370 |
| State | Employment |
|---|---|
New York |
1,560 |
Texas |
940 |
California |
910 |
Massachusetts |
770 |
Pennsylvania |
670 |
Illinois |
640 |
New Jersey |
630 |
Tennessee |
570 |
Ohio |
540 |
Michigan |
480 |
| State | Employment |
|---|---|
California |
4,980 |
New York |
4,160 |
Texas |
2,870 |
Pennsylvania |
2,290 |
Massachusetts |
1,550 |
Ohio |
1,540 |
Illinois |
1,400 |
Virginia |
1,340 |
New Jersey |
1,200 |
Washington |
1,020 |
| State | Employment |
|---|---|
Texas |
1,760 |
New York |
1,640 |
District of Columbia |
1,010 |
California |
1,010 |
Massachusetts |
930 |
Virginia |
870 |
Pennsylvania |
640 |
New Jersey |
540 |
Ohio |
510 |
Illinois |
490 |
| State | Employment |
|---|---|
Massachusetts |
270 |
California |
250 |
Virginia |
230 |
Pennsylvania |
230 |
Texas |
220 |
New York |
210 |
Ohio |
200 |
Wisconsin |
170 |
Colorado |
170 |
Maryland |
150 |
| State | Employment |
|---|---|
New York |
2,080 |
Massachusetts |
880 |
Texas |
860 |
Pennsylvania |
710 |
California |
690 |
North Carolina |
560 |
Ohio |
470 |
Illinois |
460 |
Virginia |
390 |
New Jersey |
370 |
| State | Employment |
|---|---|
New York |
1,670 |
California |
1,120 |
Massachusetts |
620 |
Pennsylvania |
610 |
Texas |
560 |
District of Columbia |
470 |
Arizona |
400 |
Illinois |
390 |
Florida |
320 |
New Jersey |
300 |
| State | Employment |
|---|---|
New York |
900 |
California |
620 |
Texas |
340 |
Pennsylvania |
300 |
Illinois |
270 |
Washington |
250 |
North Carolina |
230 |
Massachusetts |
190 |
Colorado |
190 |
Ohio |
180 |
| State | Employment |
|---|---|
New York |
1,540 |
Texas |
1,050 |
California |
910 |
Pennsylvania |
820 |
Massachusetts |
590 |
Illinois |
590 |
Michigan |
580 |
Ohio |
560 |
Virginia |
460 |
Florida |
440 |
| State | Employment |
|---|---|
New York |
850 |
California |
580 |
Massachusetts |
370 |
Texas |
340 |
Indiana |
250 |
Pennsylvania |
220 |
Michigan |
220 |
Washington |
190 |
Maryland |
190 |
New Jersey |
170 |
| State | Employment |
|---|---|
New York |
2,530 |
California |
1,620 |
Pennsylvania |
1,470 |
Texas |
1,360 |
Illinois |
980 |
North Carolina |
940 |
Massachusetts |
880 |
Ohio |
870 |
Virginia |
840 |
New Jersey |
840 |
| State | Employment |
|---|---|
California |
1,420 |
New York |
1,320 |
Pennsylvania |
860 |
Texas |
820 |
Massachusetts |
470 |
Virginia |
460 |
Florida |
390 |
Colorado |
390 |
Illinois |
370 |
North Carolina |
350 |
| State | Employment |
|---|---|
New York |
150 |
Colorado |
120 |
California |
110 |
Texas |
90 |
North Carolina |
90 |
Wisconsin |
80 |
Oregon |
80 |
Florida |
80 |
Montana |
70 |
Missouri |
70 |
| State | Employment |
|---|---|
New York |
4,890 |
Texas |
4,030 |
California |
3,590 |
Pennsylvania |
3,190 |
Massachusetts |
2,360 |
Illinois |
2,260 |
Ohio |
2,080 |
Alabama |
1,980 |
North Carolina |
1,880 |
Virginia |
1,840 |
| State | Employment |
|---|---|
Texas |
820 |
North Carolina |
760 |
New York |
470 |
Illinois |
420 |
Wisconsin |
400 |
Florida |
390 |
California |
330 |
Colorado |
310 |
Virginia |
270 |
Nebraska |
270 |
| State | Employment |
|---|---|
Texas |
3,260 |
New York |
2,950 |
Pennsylvania |
2,560 |
California |
2,470 |
Ohio |
1,810 |
Indiana |
1,690 |
Michigan |
1,500 |
Illinois |
1,420 |
North Carolina |
1,400 |
Massachusetts |
1,380 |
| State | Employment |
|---|---|
New York |
1,000 |
Texas |
580 |
California |
440 |
Florida |
380 |
Massachusetts |
340 |
Pennsylvania |
330 |
Georgia |
320 |
North Carolina |
210 |
Michigan |
200 |
Ohio |
190 |
| State | Employment |
|---|---|
California |
5,460 |
Texas |
4,910 |
New York |
4,730 |
Illinois |
2,510 |
Pennsylvania |
2,370 |
Virginia |
2,030 |
Ohio |
1,960 |
Michigan |
1,800 |
North Carolina |
1,760 |
Florida |
1,760 |
| State | Employment |
|---|---|
New York |
3,310 |
Texas |
2,440 |
California |
2,200 |
Pennsylvania |
1,650 |
Virginia |
1,600 |
North Carolina |
1,560 |
Florida |
1,350 |
Illinois |
1,180 |
Ohio |
1,140 |
Massachusetts |
1,120 |
| State | Employment |
|---|---|
New York |
9,050 |
Texas |
6,200 |
California |
5,470 |
Pennsylvania |
4,970 |
Florida |
4,770 |
Massachusetts |
4,170 |
Ohio |
4,010 |
Illinois |
3,900 |
North Carolina |
3,510 |
Virginia |
2,940 |
| State | Employment |
|---|---|
California |
1,064,410 |
Texas |
764,970 |
New York |
708,490 |
Florida |
436,950 |
Illinois |
376,700 |
Pennsylvania |
341,380 |
Ohio |
323,560 |
New Jersey |
292,710 |
North Carolina |
278,130 |
Georgia |
273,700 |
| State | Employment |
|---|---|
California |
8,140 |
Virginia |
6,990 |
Texas |
2,440 |
District of Columbia |
2,430 |
Florida |
2,330 |
New York |
2,260 |
Maryland |
2,050 |
Colorado |
1,790 |
Georgia |
1,190 |
Pennsylvania |
970 |
| State | Employment |
|---|---|
Texas |
7,060 |
Florida |
5,750 |
California |
3,510 |
Pennsylvania |
2,250 |
Ohio |
2,100 |
Michigan |
1,950 |
Oklahoma |
1,880 |
Missouri |
1,870 |
Illinois |
1,750 |
New York |
1,600 |
| State | Employment |
|---|---|
California |
35,040 |
Florida |
30,850 |
New York |
29,310 |
Texas |
27,040 |
Illinois |
13,980 |
Pennsylvania |
12,620 |
North Carolina |
10,950 |
Georgia |
10,820 |
Ohio |
10,280 |
Virginia |
10,220 |
| State | Employment |
|---|---|
New York |
3,260 |
Texas |
3,180 |
Ohio |
2,500 |
California |
1,690 |
Florida |
1,380 |
Georgia |
1,200 |
New Jersey |
1,070 |
Illinois |
1,070 |
Washington |
900 |
Oklahoma |
880 |
| State | Employment |
|---|---|
Texas |
560 |
California |
560 |
New York |
510 |
Florida |
310 |
Ohio |
300 |
Illinois |
300 |
Michigan |
250 |
Wisconsin |
200 |
Massachusetts |
200 |
Pennsylvania |
190 |
| State | Employment |
|---|---|
California |
1,800 |
New York |
1,420 |
Texas |
1,010 |
Pennsylvania |
770 |
Ohio |
770 |
Illinois |
550 |
Florida |
540 |
Virginia |
500 |
Georgia |
500 |
Oregon |
440 |
| State | Employment |
|---|---|
California |
3,060 |
Pennsylvania |
1,000 |
New York |
710 |
Florida |
620 |
Washington |
560 |
New Jersey |
550 |
Georgia |
540 |
Utah |
530 |
Texas |
420 |
Minnesota |
400 |
| State | Employment |
|---|---|
California |
83,750 |
New York |
77,060 |
Florida |
47,900 |
Texas |
44,700 |
Illinois |
31,270 |
District of Columbia |
30,960 |
Pennsylvania |
24,840 |
New Jersey |
21,690 |
Georgia |
19,500 |
Massachusetts |
18,750 |
| State | Employment |
|---|---|
California |
137,550 |
New York |
116,130 |
Florida |
89,680 |
Texas |
86,420 |
Illinois |
50,060 |
Pennsylvania |
42,870 |
District of Columbia |
39,610 |
Virginia |
36,450 |
Ohio |
34,910 |
Georgia |
34,310 |
| State | Employment |
|---|---|
California |
1,430 |
Florida |
1,010 |
New York |
780 |
New Jersey |
650 |
Oregon |
630 |
Illinois |
630 |
Washington |
560 |
Colorado |
530 |
Pennsylvania |
380 |
North Carolina |
310 |
| State | Employment |
|---|---|
New York |
5,230 |
California |
3,120 |
Illinois |
1,650 |
Oregon |
1,520 |
Pennsylvania |
1,500 |
Michigan |
1,170 |
Florida |
1,110 |
Virginia |
690 |
Ohio |
680 |
Montana |
460 |
| State | Employment |
|---|---|
New York |
7,210 |
California |
6,610 |
Oregon |
4,180 |
Texas |
3,140 |
Florida |
3,010 |
Pennsylvania |
2,430 |
Michigan |
2,270 |
Illinois |
2,160 |
Ohio |
1,780 |
Minnesota |
1,360 |
| State | Employment |
|---|---|
California |
16,630 |
New York |
13,750 |
Florida |
11,020 |
Louisiana |
4,570 |
Texas |
3,740 |
New Jersey |
3,320 |
North Carolina |
3,290 |
Minnesota |
3,180 |
Colorado |
3,040 |
Ohio |
2,560 |
| State | Employment |
|---|---|
New York |
7,750 |
California |
5,720 |
Florida |
3,120 |
Massachusetts |
3,090 |
Texas |
2,900 |
Washington |
2,600 |
Ohio |
2,200 |
Indiana |
1,960 |
Pennsylvania |
1,830 |
Maryland |
1,680 |
| State | Employment |
|---|---|
California |
53,690 |
New York |
39,810 |
New Jersey |
27,530 |
Texas |
20,490 |
Ohio |
16,370 |
Illinois |
15,920 |
Pennsylvania |
15,870 |
Massachusetts |
15,540 |
Minnesota |
12,970 |
Florida |
12,150 |
| State | Employment |
|---|---|
California |
13,390 |
Texas |
7,960 |
New York |
4,940 |
Pennsylvania |
4,110 |
North Carolina |
3,160 |
Ohio |
3,120 |
New Jersey |
2,910 |
Georgia |
2,910 |
Illinois |
2,820 |
Virginia |
2,770 |
| State | Employment |
|---|---|
California |
7,230 |
New York |
4,360 |
Florida |
3,030 |
Texas |
2,810 |
Georgia |
2,530 |
Maryland |
2,340 |
Ohio |
2,240 |
Massachusetts |
2,200 |
Minnesota |
2,170 |
Pennsylvania |
2,120 |
| State | Employment |
|---|---|
California |
12,210 |
New York |
4,910 |
Florida |
3,880 |
Ohio |
2,870 |
South Carolina |
2,770 |
Texas |
2,530 |
Oregon |
2,170 |
Wisconsin |
1,660 |
Pennsylvania |
1,660 |
Illinois |
1,540 |
| State | Employment |
|---|---|
California |
14,970 |
New York |
11,540 |
Pennsylvania |
7,610 |
Massachusetts |
6,870 |
Ohio |
6,650 |
Texas |
6,010 |
Virginia |
4,540 |
Florida |
4,380 |
Michigan |
4,190 |
Illinois |
3,550 |
| State | Employment |
|---|---|
California |
19,020 |
New York |
15,720 |
Florida |
10,690 |
Massachusetts |
10,280 |
Texas |
10,250 |
Pennsylvania |
7,950 |
Ohio |
7,230 |
Missouri |
6,230 |
Indiana |
5,430 |
Michigan |
5,410 |
| State | Employment |
|---|---|
California |
32,630 |
New York |
29,880 |
Pennsylvania |
21,180 |
Texas |
21,120 |
Illinois |
14,720 |
Michigan |
13,760 |
North Carolina |
12,380 |
Ohio |
11,560 |
Massachusetts |
10,780 |
Florida |
10,650 |
| State | Employment |
|---|---|
California |
5,300 |
Texas |
2,280 |
Florida |
2,130 |
Louisiana |
2,040 |
Illinois |
1,610 |
New Jersey |
1,190 |
Tennessee |
1,100 |
Pennsylvania |
940 |
Utah |
620 |
Georgia |
610 |
| State | Employment |
|---|---|
California |
32,380 |
Pennsylvania |
20,350 |
Massachusetts |
16,120 |
New York |
14,910 |
Florida |
13,980 |
Virginia |
12,100 |
Illinois |
11,940 |
Texas |
11,570 |
New Jersey |
10,130 |
Washington |
9,540 |
| State | Employment |
|---|---|
California |
15,210 |
New York |
9,190 |
Pennsylvania |
7,390 |
Massachusetts |
6,280 |
Ohio |
5,410 |
Illinois |
3,950 |
Washington |
3,890 |
Florida |
3,680 |
Michigan |
3,590 |
Minnesota |
3,490 |
| State | Employment |
|---|---|
California |
31,710 |
New Jersey |
4,300 |
Florida |
1,990 |
Pennsylvania |
1,820 |
Maryland |
1,590 |
New York |
1,440 |
Minnesota |
1,380 |
Illinois |
1,150 |
Arizona |
1,000 |
Tennessee |
850 |
| State | Employment |
|---|---|
California |
32,650 |
New York |
26,500 |
Texas |
25,810 |
Florida |
19,030 |
Illinois |
13,210 |
Ohio |
10,940 |
Georgia |
9,540 |
Arizona |
8,850 |
Massachusetts |
8,030 |
Pennsylvania |
8,010 |
| State | Employment |
|---|---|
California |
303,870 |
New York |
198,410 |
Texas |
124,830 |
Florida |
107,020 |
Pennsylvania |
106,330 |
Illinois |
86,380 |
Massachusetts |
83,650 |
Ohio |
82,590 |
New Jersey |
71,370 |
Michigan |
62,870 |
| State | Employment |
|---|---|
Texas |
3,540 |
California |
1,700 |
New York |
1,020 |
Ohio |
910 |
South Carolina |
790 |
Illinois |
720 |
Pennsylvania |
680 |
Indiana |
660 |
Virginia |
580 |
Louisiana |
570 |
| State | Employment |
|---|---|
Texas |
12,860 |
California |
8,430 |
Pennsylvania |
4,640 |
Ohio |
4,640 |
New York |
3,930 |
Florida |
2,970 |
Washington |
2,930 |
Virginia |
2,870 |
North Carolina |
2,580 |
Illinois |
2,460 |
| State | Employment |
|---|---|
New York |
8,680 |
California |
8,520 |
Texas |
4,150 |
Illinois |
2,920 |
Missouri |
2,440 |
Florida |
2,250 |
Michigan |
2,060 |
Pennsylvania |
1,900 |
Georgia |
1,830 |
Indiana |
1,750 |
| State | Employment |
|---|---|
California |
2,150 |
Florida |
1,680 |
Texas |
1,480 |
New York |
860 |
Arizona |
700 |
Georgia |
560 |
Tennessee |
510 |
Ohio |
460 |
Virginia |
440 |
North Carolina |
440 |
| State | Employment |
|---|---|
California |
4,060 |
Oregon |
1,120 |
Montana |
860 |
Idaho |
740 |
Minnesota |
700 |
Arizona |
680 |
Wisconsin |
670 |
North Carolina |
640 |
Iowa |
600 |
Utah |
580 |
| State | Employment |
|---|---|
New York |
6,170 |
District of Columbia |
3,650 |
California |
2,470 |
Georgia |
2,240 |
North Carolina |
2,220 |
Massachusetts |
2,080 |
Arizona |
1,610 |
Texas |
1,510 |
Indiana |
1,140 |
Pennsylvania |
1,050 |
| State | Employment |
|---|---|
Illinois |
650 |
Ohio |
460 |
Idaho |
330 |
New York |
290 |
New Mexico |
230 |
Tennessee |
190 |
Florida |
190 |
Texas |
160 |
Michigan |
120 |
California |
110 |
| State | Employment |
|---|---|
Texas |
6,460 |
California |
1,490 |
Oklahoma |
1,030 |
Pennsylvania |
520 |
Arizona |
500 |
Louisiana |
450 |
Alaska |
430 |
New Jersey |
390 |
Florida |
350 |
Michigan |
300 |
| State | Employment |
|---|---|
California |
5,830 |
Texas |
3,060 |
New York |
2,220 |
Ohio |
1,470 |
Pennsylvania |
1,390 |
Florida |
1,380 |
Washington |
1,310 |
North Carolina |
1,010 |
Virginia |
930 |
Georgia |
920 |
| State | Employment |
|---|---|
Texas |
7,350 |
California |
6,510 |
New Jersey |
3,850 |
Pennsylvania |
3,230 |
Illinois |
2,790 |
Ohio |
2,770 |
Louisiana |
2,540 |
New York |
2,510 |
Georgia |
2,150 |
Florida |
2,140 |
| State | Employment |
|---|---|
California |
9,740 |
Texas |
6,810 |
Massachusetts |
6,290 |
Ohio |
5,010 |
New York |
3,920 |
Pennsylvania |
3,490 |
Michigan |
3,460 |
Maryland |
3,380 |
Florida |
3,250 |
Washington |
3,210 |
| State | Employment |
|---|---|
California |
4,170 |
Texas |
1,280 |
Iowa |
1,280 |
Wisconsin |
1,140 |
New York |
1,040 |
Georgia |
880 |
Minnesota |
870 |
Oregon |
860 |
Illinois |
840 |
Nebraska |
810 |
| State | Employment |
|---|---|
California |
4,150 |
Virginia |
3,240 |
District of Columbia |
2,630 |
Maryland |
2,310 |
New York |
2,220 |
Georgia |
2,060 |
Texas |
2,020 |
Ohio |
1,630 |
Florida |
1,330 |
North Carolina |
1,220 |
| State | Employment |
|---|---|
District of Columbia |
3,160 |
Virginia |
1,140 |
Texas |
280 |
California |
140 |
Washington |
120 |
Pennsylvania |
120 |
Illinois |
100 |
New York |
80 |
Michigan |
80 |
Maine |
50 |
| State | Employment |
|---|---|
New York |
410 |
California |
240 |
Utah |
220 |
District of Columbia |
200 |
Texas |
180 |
Virginia |
160 |
Pennsylvania |
130 |
Mississippi |
110 |
New Jersey |
90 |
Florida |
90 |
| State | Employment |
|---|---|
Maryland |
280 |
Texas |
160 |
California |
110 |
Virginia |
80 |
Georgia |
70 |
Colorado |
70 |
Washington |
50 |
Minnesota |
50 |
Louisiana |
40 |
Arizona |
40 |
| State | Employment |
|---|---|
California |
1,610 |
Oregon |
420 |
Arizona |
410 |
Texas |
320 |
Nevada |
320 |
Virginia |
250 |
New Mexico |
250 |
Colorado |
250 |
Florida |
230 |
Washington |
170 |
| State | Employment |
|---|---|
California |
7,980 |
Florida |
2,880 |
Washington |
2,250 |
Texas |
2,050 |
North Carolina |
1,490 |
New York |
1,390 |
Virginia |
1,330 |
Pennsylvania |
1,330 |
Massachusetts |
1,100 |
Oregon |
1,060 |
| State | Employment |
|---|---|
California |
1,020 |
New York |
160 |
Michigan |
110 |
Massachusetts |
110 |
Ohio |
100 |
Washington |
90 |
Florida |
70 |
Wisconsin |
60 |
Utah |
60 |
Pennsylvania |
60 |
| State | Employment |
|---|---|
Florida |
1,220 |
Massachusetts |
820 |
Texas |
790 |
Maryland |
610 |
New York |
550 |
Illinois |
480 |
Washington |
470 |
Pennsylvania |
460 |
Virginia |
440 |
Minnesota |
430 |
| State | Employment |
|---|---|
Virginia |
90 |
California |
40 |
Maryland |
30 |
| State | Employment |
|---|---|
California |
16,960 |
New York |
11,030 |
Texas |
8,430 |
Florida |
5,270 |
Illinois |
5,100 |
Pennsylvania |
4,220 |
Ohio |
4,090 |
Massachusetts |
4,010 |
New Jersey |
3,570 |
Wisconsin |
3,250 |
| State | Employment |
|---|---|
Illinois |
1,060 |
California |
860 |
Massachusetts |
670 |
Maryland |
640 |
New York |
610 |
Texas |
520 |
Minnesota |
490 |
Florida |
450 |
Pennsylvania |
430 |
New Jersey |
430 |
| State | Employment |
|---|---|
District of Columbia |
6,480 |
California |
1,810 |
Virginia |
1,200 |
Massachusetts |
890 |
Texas |
860 |
New York |
820 |
Maryland |
730 |
Pennsylvania |
570 |
Florida |
460 |
Illinois |
450 |
| State | Employment |
|---|---|
California |
1,850 |
Maryland |
1,830 |
Texas |
1,740 |
Virginia |
1,700 |
New York |
910 |
District of Columbia |
740 |
Illinois |
560 |
New Jersey |
540 |
North Carolina |
530 |
Ohio |
520 |
| State | Employment |
|---|---|
California |
930 |
Colorado |
460 |
Florida |
400 |
Washington |
310 |
Minnesota |
300 |
Oregon |
290 |
Ohio |
290 |
Texas |
250 |
Arizona |
210 |
Montana |
190 |
| State | Employment |
|---|---|
Texas |
7,240 |
California |
4,660 |
Colorado |
1,910 |
Pennsylvania |
1,250 |
Washington |
1,030 |
Florida |
950 |
Oklahoma |
930 |
New York |
660 |
Massachusetts |
650 |
Louisiana |
620 |
| State | Employment |
|---|---|
California |
14,380 |
Texas |
5,190 |
Florida |
4,800 |
North Carolina |
3,840 |
New York |
3,840 |
Virginia |
3,270 |
Washington |
3,040 |
Michigan |
3,030 |
New Jersey |
2,740 |
Maryland |
2,700 |
| State | Employment |
|---|---|
California |
670 |
Texas |
650 |
Massachusetts |
470 |
Ohio |
400 |
Washington |
350 |
Pennsylvania |
350 |
Illinois |
270 |
Maryland |
240 |
New York |
230 |
Michigan |
230 |
| State | Employment |
|---|---|
California |
10,130 |
New Jersey |
7,350 |
Pennsylvania |
5,310 |
Texas |
5,000 |
North Carolina |
3,990 |
New York |
3,650 |
Massachusetts |
3,560 |
Ohio |
3,530 |
Michigan |
3,490 |
Maryland |
3,240 |
| State | Employment |
|---|---|
Colorado |
970 |
California |
830 |
Texas |
660 |
Maryland |
600 |
Florida |
460 |
New Jersey |
380 |
New York |
360 |
Oklahoma |
350 |
Virginia |
290 |
Utah |
260 |
| State | Employment |
|---|---|
California |
1,950 |
Maryland |
1,880 |
New Mexico |
1,740 |
Texas |
980 |
Illinois |
930 |
Colorado |
910 |
New York |
900 |
Virginia |
850 |
District of Columbia |
750 |
Washington |
650 |
| State | Employment |
|---|---|
California |
360 |
Texas |
230 |
Arizona |
160 |
Virginia |
100 |
Hawaii |
100 |
District of Columbia |
60 |
New Mexico |
30 |
| State | Employment |
|---|---|
California |
1,300 |
Massachusetts |
450 |
New Jersey |
370 |
Maryland |
330 |
Texas |
320 |
Oregon |
320 |
Ohio |
290 |
Washington |
240 |
Virginia |
180 |
North Carolina |
180 |
| State | Employment |
|---|---|
California |
23,460 |
Massachusetts |
16,860 |
New York |
8,590 |
Pennsylvania |
7,410 |
Washington |
6,300 |
Texas |
6,280 |
Maryland |
5,170 |
North Carolina |
5,130 |
Ohio |
4,240 |
Illinois |
3,710 |
| State | Employment |
|---|---|
Texas |
730 |
California |
720 |
Washington |
450 |
Georgia |
390 |
Maryland |
340 |
Colorado |
340 |
Illinois |
310 |
Ohio |
280 |
New York |
260 |
Florida |
260 |
| State | Employment |
|---|---|
California |
730 |
Oregon |
600 |
Wisconsin |
500 |
Washington |
500 |
Missouri |
420 |
Georgia |
380 |
North Carolina |
350 |
Minnesota |
330 |
Virginia |
310 |
Pennsylvania |
300 |
| State | Employment |
|---|---|
Texas |
2,050 |
California |
1,760 |
Colorado |
1,300 |
Washington |
1,020 |
Mississippi |
840 |
Pennsylvania |
830 |
Ohio |
820 |
Wisconsin |
750 |
Oregon |
740 |
Illinois |
650 |
| State | Employment |
|---|---|
California |
10,650 |
Maryland |
4,080 |
Massachusetts |
3,340 |
Texas |
1,670 |
Florida |
1,670 |
Washington |
1,330 |
North Carolina |
1,270 |
Georgia |
1,090 |
Oregon |
760 |
New York |
710 |
| State | Employment |
|---|---|
Washington |
2,380 |
Florida |
2,150 |
California |
2,140 |
Oregon |
950 |
Alaska |
740 |
Minnesota |
690 |
Colorado |
550 |
Texas |
490 |
Massachusetts |
440 |
Idaho |
440 |
| State | Employment |
|---|---|
California |
3,470 |
Maryland |
1,910 |
Texas |
1,060 |
Massachusetts |
930 |
Georgia |
930 |
New York |
680 |
Illinois |
670 |
Pennsylvania |
640 |
New Jersey |
560 |
Colorado |
550 |
| State | Employment |
|---|---|
New Jersey |
7,280 |
California |
5,610 |
Massachusetts |
4,250 |
Texas |
1,640 |
Pennsylvania |
1,510 |
New York |
910 |
Minnesota |
900 |
Colorado |
890 |
Maryland |
800 |
Illinois |
620 |
| State | Employment |
|---|---|
California |
2,580 |
Iowa |
900 |
North Carolina |
710 |
Minnesota |
650 |
South Dakota |
580 |
Wisconsin |
560 |
Nebraska |
530 |
Texas |
510 |
Oregon |
510 |
Colorado |
410 |
| State | Employment |
|---|---|
California |
1,980 |
New Jersey |
1,340 |
Illinois |
890 |
Texas |
670 |
Minnesota |
630 |
Ohio |
600 |
New York |
590 |
Georgia |
580 |
Michigan |
530 |
Wisconsin |
500 |
| State | Employment |
|---|---|
Wisconsin |
400 |
Texas |
300 |
Minnesota |
200 |
North Carolina |
140 |
New York |
140 |
Nebraska |
110 |
Iowa |
110 |
South Dakota |
90 |
Ohio |
60 |
Michigan |
60 |
| State | Employment |
|---|---|
California |
182,360 |
Texas |
102,540 |
New York |
72,570 |
Massachusetts |
58,340 |
Pennsylvania |
49,320 |
Florida |
46,800 |
Maryland |
43,350 |
New Jersey |
43,130 |
Ohio |
42,150 |
Washington |
39,850 |
| State | Employment |
|---|---|
California |
11,810 |
Texas |
9,800 |
Illinois |
5,150 |
Pennsylvania |
4,720 |
Virginia |
3,610 |
Florida |
2,810 |
Louisiana |
2,760 |
Ohio |
2,590 |
Maryland |
2,450 |
Washington |
2,400 |
| State | Employment |
|---|---|
Texas |
9,410 |
Florida |
4,270 |
California |
4,110 |
North Carolina |
3,430 |
Colorado |
2,320 |
Virginia |
2,140 |
Pennsylvania |
1,470 |
Ohio |
1,460 |
New York |
1,370 |
Georgia |
1,370 |
| State | Employment |
|---|---|
Michigan |
4,700 |
California |
3,470 |
Texas |
3,410 |
Ohio |
2,760 |
Pennsylvania |
2,580 |
Wisconsin |
1,900 |
Illinois |
1,840 |
Indiana |
1,750 |
New York |
1,440 |
Minnesota |
1,330 |
| State | Employment |
|---|---|
Texas |
6,250 |
California |
4,570 |
Michigan |
4,250 |
Minnesota |
3,500 |
Ohio |
3,370 |
Massachusetts |
3,130 |
New York |
2,830 |
North Carolina |
2,800 |
Indiana |
2,390 |
Puerto Rico |
2,050 |
| State | Employment |
|---|---|
California |
3,560 |
Texas |
1,410 |
Florida |
970 |
Virginia |
930 |
Massachusetts |
760 |
Pennsylvania |
690 |
Tennessee |
650 |
New York |
640 |
Ohio |
580 |
Maryland |
520 |
| State | Employment |
|---|---|
California |
2,370 |
Texas |
1,910 |
Massachusetts |
1,070 |
Pennsylvania |
690 |
Virginia |
620 |
Maryland |
540 |
Ohio |
520 |
Minnesota |
510 |
Illinois |
480 |
Tennessee |
440 |
| State | Employment |
|---|---|
California |
23,380 |
Texas |
11,140 |
Florida |
6,510 |
New York |
5,730 |
Virginia |
5,370 |
Pennsylvania |
4,110 |
Massachusetts |
3,600 |
Maryland |
3,430 |
Georgia |
3,380 |
Arizona |
3,290 |
| State | Employment |
|---|---|
California |
8,050 |
Texas |
7,390 |
Florida |
3,370 |
North Carolina |
3,010 |
Illinois |
2,910 |
Minnesota |
2,220 |
Virginia |
2,160 |
Pennsylvania |
2,140 |
Tennessee |
2,100 |
Kentucky |
1,940 |
| State | Employment |
|---|---|
California |
2,220 |
Florida |
1,520 |
Texas |
1,380 |
Ohio |
960 |
Arizona |
920 |
Kansas |
490 |
Alabama |
460 |
Washington |
430 |
New York |
280 |
Colorado |
280 |
| State | Employment |
|---|---|
California |
1,660 |
Louisiana |
1,620 |
Texas |
1,330 |
Oregon |
890 |
Florida |
830 |
Ohio |
810 |
New York |
650 |
Minnesota |
640 |
Tennessee |
450 |
Georgia |
370 |
| State | Employment |
|---|---|
California |
5,260 |
Texas |
4,960 |
Pennsylvania |
3,120 |
New York |
2,540 |
Florida |
2,510 |
Michigan |
2,470 |
Illinois |
2,330 |
Washington |
2,190 |
Ohio |
2,080 |
Wisconsin |
1,930 |
| State | Employment |
|---|---|
California |
3,480 |
Texas |
3,390 |
New York |
1,230 |
Arizona |
1,190 |
Pennsylvania |
1,120 |
Florida |
890 |
Colorado |
800 |
Ohio |
790 |
Washington |
730 |
Illinois |
700 |
| State | Employment |
|---|---|
California |
13,390 |
Texas |
11,280 |
Florida |
6,900 |
New York |
6,360 |
Pennsylvania |
4,540 |
Ohio |
3,220 |
Arizona |
2,640 |
Illinois |
2,580 |
New Jersey |
2,550 |
North Carolina |
2,440 |
| State | Employment |
|---|---|
California |
25,740 |
Michigan |
11,350 |
Texas |
10,380 |
Florida |
9,220 |
Ohio |
7,670 |
Georgia |
6,780 |
Louisiana |
5,590 |
Pennsylvania |
4,910 |
New York |
4,740 |
Maryland |
4,550 |
| State | Employment |
|---|---|
Texas |
18,720 |
California |
2,440 |
Oklahoma |
1,910 |
Colorado |
1,340 |
Louisiana |
1,330 |
Pennsylvania |
970 |
Ohio |
800 |
Alaska |
790 |
Wyoming |
530 |
Mississippi |
500 |
| State | Employment |
|---|---|
Virginia |
2,340 |
South Carolina |
1,580 |
Pennsylvania |
850 |
Michigan |
790 |
New Mexico |
730 |
Illinois |
660 |
Connecticut |
580 |
Idaho |
530 |
California |
510 |
Tennessee |
460 |
| State | Employment |
|---|---|
Texas |
570 |
California |
550 |
Arizona |
520 |
Nevada |
390 |
Colorado |
320 |
Pennsylvania |
290 |
New Mexico |
270 |
Oklahoma |
250 |
Utah |
230 |
Michigan |
180 |
| State | Employment |
|---|---|
Michigan |
43,850 |
California |
27,830 |
Texas |
22,020 |
Pennsylvania |
16,930 |
Ohio |
15,300 |
Illinois |
14,360 |
Wisconsin |
12,090 |
New York |
10,050 |
Massachusetts |
9,490 |
North Carolina |
8,970 |
| State | Employment |
|---|---|
Texas |
2,760 |
California |
2,550 |
Ohio |
2,110 |
Pennsylvania |
1,660 |
Michigan |
1,410 |
Washington |
1,060 |
Indiana |
840 |
Maryland |
810 |
New York |
800 |
Alabama |
790 |
| State | Employment |
|---|---|
Virginia |
2,520 |
Texas |
600 |
Washington |
530 |
District of Columbia |
500 |
Massachusetts |
440 |
Florida |
380 |
Maryland |
360 |
Maine |
350 |
Mississippi |
290 |
California |
280 |
| State | Employment |
|---|---|
Michigan |
29,470 |
California |
26,800 |
Texas |
19,520 |
Ohio |
15,450 |
New York |
11,760 |
Massachusetts |
11,750 |
Illinois |
11,230 |
Indiana |
11,060 |
Wisconsin |
10,760 |
Florida |
10,500 |
| State | Employment |
|---|---|
Texas |
3,700 |
California |
2,190 |
New York |
1,760 |
Pennsylvania |
1,490 |
Georgia |
1,340 |
Florida |
1,090 |
Wisconsin |
770 |
Oklahoma |
770 |
Massachusetts |
710 |
Utah |
680 |
| State | Employment |
|---|---|
California |
8,640 |
Texas |
3,250 |
New York |
3,110 |
Massachusetts |
2,910 |
Pennsylvania |
2,700 |
Washington |
1,900 |
Georgia |
1,760 |
Florida |
1,590 |
Virginia |
1,460 |
Illinois |
1,350 |
| State | Employment |
|---|---|
California |
27,110 |
Texas |
11,970 |
Colorado |
6,170 |
Florida |
5,290 |
Oregon |
5,000 |
Michigan |
4,470 |
Virginia |
4,390 |
Georgia |
4,050 |
Maryland |
3,890 |
Ohio |
3,860 |
| State | Employment |
|---|---|
California |
25,370 |
Texas |
14,440 |
Michigan |
9,620 |
New York |
9,560 |
Pennsylvania |
9,110 |
Ohio |
6,970 |
Massachusetts |
6,960 |
Virginia |
6,150 |
Florida |
6,060 |
Washington |
6,030 |
| State | Employment |
|---|---|
California |
19,940 |
Colorado |
4,700 |
Texas |
3,970 |
Maryland |
3,940 |
Florida |
3,090 |
Massachusetts |
1,930 |
Virginia |
1,850 |
Washington |
1,770 |
Georgia |
1,710 |
Arizona |
1,690 |
| State | Employment |
|---|---|
California |
49,090 |
Texas |
27,920 |
New York |
16,400 |
Florida |
16,060 |
Pennsylvania |
12,260 |
Washington |
11,580 |
Illinois |
11,080 |
Virginia |
10,850 |
North Carolina |
10,520 |
Colorado |
10,090 |
| State | Employment |
|---|---|
Texas |
7,260 |
California |
2,020 |
Louisiana |
1,610 |
New Jersey |
1,350 |
Ohio |
1,330 |
Pennsylvania |
1,000 |
North Carolina |
920 |
Michigan |
880 |
Virginia |
860 |
Maryland |
850 |
| State | Employment |
|---|---|
California |
2,540 |
Illinois |
1,550 |
Massachusetts |
1,390 |
Minnesota |
1,310 |
Florida |
1,220 |
Pennsylvania |
1,180 |
Texas |
970 |
Indiana |
860 |
Colorado |
800 |
Maryland |
740 |
| State | Employment |
|---|---|
California |
180 |
Iowa |
150 |
Texas |
80 |
Ohio |
80 |
Kentucky |
80 |
Indiana |
60 |
Illinois |
60 |
Florida |
60 |
Puerto Rico |
50 |
Pennsylvania |
50 |
| State | Employment |
|---|---|
California |
11,440 |
Washington |
6,680 |
Texas |
6,140 |
Alabama |
4,070 |
Ohio |
3,810 |
Florida |
3,070 |
Maryland |
2,810 |
Kansas |
2,450 |
Georgia |
2,430 |
Colorado |
2,230 |
| State | Employment |
|---|---|
Texas |
4,480 |
California |
4,260 |
Florida |
3,460 |
Pennsylvania |
1,620 |
New York |
1,610 |
Colorado |
1,540 |
Virginia |
1,430 |
Illinois |
1,380 |
New Jersey |
1,270 |
Ohio |
1,240 |
| State | Employment |
|---|---|
Texas |
1,270 |
Colorado |
1,130 |
California |
860 |
North Carolina |
770 |
Florida |
620 |
Virginia |
460 |
Minnesota |
430 |
South Carolina |
380 |
Oregon |
360 |
Maryland |
360 |
| State | Employment |
|---|---|
California |
2,510 |
Florida |
1,630 |
New York |
1,570 |
Texas |
1,130 |
Pennsylvania |
920 |
Colorado |
920 |
Washington |
770 |
Arizona |
760 |
Ohio |
720 |
Virginia |
630 |
| State | Employment |
|---|---|
California |
14,480 |
New York |
11,470 |
Texas |
9,380 |
Illinois |
5,760 |
Florida |
4,230 |
Washington |
4,180 |
Pennsylvania |
4,060 |
Massachusetts |
3,700 |
Colorado |
3,470 |
Ohio |
2,840 |
| State | Employment |
|---|---|
California |
344,670 |
Texas |
243,980 |
Michigan |
139,900 |
Florida |
111,000 |
New York |
107,230 |
Pennsylvania |
102,990 |
Ohio |
97,690 |
Illinois |
85,600 |
Virginia |
77,800 |
Washington |
77,020 |
| State | Employment |
|---|---|
California |
4,690 |
Illinois |
2,240 |
Texas |
2,200 |
New York |
1,980 |
Ohio |
1,390 |
Florida |
1,310 |
Georgia |
1,270 |
Washington |
1,220 |
North Carolina |
1,190 |
Pennsylvania |
1,110 |
| State | Employment |
|---|---|
California |
4,930 |
Pennsylvania |
3,430 |
Massachusetts |
3,080 |
Maryland |
3,020 |
Texas |
1,940 |
Illinois |
1,770 |
North Carolina |
1,640 |
Virginia |
1,350 |
Washington |
1,290 |
New Jersey |
1,250 |
| State | Employment |
|---|---|
California |
10,000 |
Texas |
9,820 |
Virginia |
8,770 |
New York |
6,510 |
Florida |
4,620 |
Illinois |
4,520 |
Ohio |
4,310 |
Maryland |
3,980 |
Georgia |
3,720 |
Pennsylvania |
3,380 |
| State | Employment |
|---|---|
California |
550 |
Virginia |
410 |
New Jersey |
290 |
Maryland |
180 |
Texas |
150 |
Washington |
100 |
New York |
100 |
Michigan |
80 |
Florida |
80 |
New Mexico |
60 |
| State | Employment |
|---|---|
New York |
2,330 |
Illinois |
1,970 |
California |
1,630 |
Ohio |
1,580 |
Pennsylvania |
1,510 |
Connecticut |
1,350 |
Massachusetts |
1,160 |
Texas |
1,080 |
New Jersey |
850 |
Michigan |
740 |
| State | Employment |
|---|---|
California |
83,270 |
Texas |
27,540 |
Georgia |
22,000 |
Pennsylvania |
19,660 |
Maryland |
14,940 |
Virginia |
14,560 |
Colorado |
14,010 |
Illinois |
13,910 |
Ohio |
12,680 |
Washington |
12,340 |
| State | Employment |
|---|---|
California |
20,920 |
Washington |
13,430 |
New York |
13,000 |
Texas |
9,510 |
Florida |
7,200 |
Illinois |
5,610 |
Virginia |
5,030 |
Massachusetts |
4,930 |
Ohio |
4,720 |
Pennsylvania |
4,650 |
| State | Employment |
|---|---|
California |
249,620 |
Texas |
109,510 |
New York |
78,890 |
Washington |
77,650 |
Virginia |
73,310 |
Florida |
59,880 |
Massachusetts |
55,710 |
Illinois |
54,700 |
New Jersey |
50,320 |
Georgia |
45,440 |
| State | Employment |
|---|---|
California |
24,400 |
Texas |
20,430 |
New York |
13,380 |
Florida |
9,670 |
Illinois |
9,260 |
New Jersey |
9,070 |
Pennsylvania |
7,800 |
Virginia |
6,650 |
Alabama |
6,200 |
Washington |
5,680 |
| State | Employment |
|---|---|
California |
13,530 |
Texas |
11,620 |
New York |
7,730 |
Florida |
7,510 |
Virginia |
6,520 |
Pennsylvania |
6,150 |
Georgia |
5,390 |
Illinois |
4,420 |
New Jersey |
4,090 |
North Carolina |
3,800 |
| State | Employment |
|---|---|
Texas |
35,890 |
California |
33,630 |
New York |
25,910 |
Virginia |
18,510 |
Florida |
17,930 |
Maryland |
14,850 |
Colorado |
12,580 |
Pennsylvania |
11,760 |
Ohio |
11,620 |
Illinois |
11,560 |
| State | Employment |
|---|---|
California |
18,210 |
Texas |
13,080 |
Florida |
8,410 |
New York |
8,350 |
Virginia |
8,030 |
Pennsylvania |
7,180 |
Colorado |
6,790 |
Maryland |
6,360 |
Massachusetts |
5,810 |
Georgia |
5,750 |
| State | Employment |
|---|---|
California |
81,230 |
Texas |
60,980 |
New York |
45,250 |
Florida |
42,560 |
Illinois |
23,450 |
Pennsylvania |
22,680 |
North Carolina |
22,440 |
Georgia |
22,360 |
Ohio |
22,090 |
Virginia |
19,730 |
| State | Employment |
|---|---|
California |
16,860 |
Texas |
15,530 |
New York |
13,710 |
Illinois |
11,130 |
Florida |
8,900 |
Maryland |
8,530 |
Pennsylvania |
7,860 |
Ohio |
7,580 |
Virginia |
6,780 |
Georgia |
6,460 |
| State | Employment |
|---|---|
California |
7,370 |
Virginia |
3,180 |
Maryland |
2,790 |
Washington |
1,970 |
Texas |
1,520 |
New York |
1,390 |
New Jersey |
1,110 |
Florida |
1,100 |
Utah |
810 |
New Mexico |
730 |
| State | Employment |
|---|---|
Virginia |
15,010 |
Texas |
10,430 |
California |
9,200 |
New York |
7,120 |
Florida |
6,630 |
North Carolina |
6,020 |
Maryland |
5,860 |
Massachusetts |
4,290 |
New Jersey |
4,120 |
Illinois |
4,120 |
| State | Employment |
|---|---|
California |
64,260 |
Texas |
54,150 |
New York |
39,860 |
Illinois |
30,710 |
Florida |
27,450 |
Ohio |
26,690 |
Virginia |
26,310 |
North Carolina |
26,050 |
Pennsylvania |
21,500 |
Minnesota |
20,240 |
| State | Employment |
|---|---|
California |
644,300 |
Texas |
385,370 |
New York |
272,070 |
Florida |
217,000 |
Virginia |
215,480 |
Illinois |
184,990 |
Washington |
173,940 |
Pennsylvania |
162,020 |
Ohio |
155,290 |
Georgia |
154,890 |
| State | Employment |
|---|---|
California |
58,810 |
New York |
57,980 |
Texas |
40,460 |
Florida |
22,190 |
Illinois |
20,510 |
Massachusetts |
18,130 |
Pennsylvania |
17,480 |
New Jersey |
16,870 |
Ohio |
15,670 |
Georgia |
14,150 |
| State | Employment |
|---|---|
California |
8,910 |
Texas |
5,060 |
Florida |
4,910 |
New York |
4,200 |
Illinois |
2,600 |
Pennsylvania |
2,190 |
Virginia |
2,070 |
North Carolina |
1,880 |
Georgia |
1,850 |
Ohio |
1,780 |
| State | Employment |
|---|---|
California |
8,300 |
New York |
4,650 |
Florida |
4,390 |
Texas |
3,720 |
Pennsylvania |
3,410 |
Utah |
1,910 |
Missouri |
1,800 |
Georgia |
1,740 |
Massachusetts |
1,520 |
Kentucky |
1,510 |
| State | Employment |
|---|---|
California |
34,740 |
Texas |
22,410 |
Florida |
16,220 |
North Carolina |
13,680 |
New York |
13,420 |
Illinois |
12,310 |
Michigan |
11,990 |
Ohio |
10,630 |
Virginia |
10,280 |
Pennsylvania |
10,270 |
| State | Employment |
|---|---|
California |
3,520 |
New York |
2,480 |
Texas |
2,360 |
Arizona |
2,080 |
Florida |
1,960 |
Illinois |
1,670 |
Pennsylvania |
1,420 |
Massachusetts |
1,280 |
Michigan |
970 |
Ohio |
940 |
| State | Employment |
|---|---|
New York |
11,310 |
Texas |
5,810 |
California |
5,130 |
North Carolina |
4,310 |
Ohio |
3,140 |
Florida |
2,290 |
Illinois |
2,010 |
New Jersey |
1,890 |
Arizona |
1,890 |
Pennsylvania |
1,750 |
| State | Employment |
|---|---|
California |
9,110 |
New York |
7,790 |
Illinois |
7,720 |
Texas |
7,330 |
Georgia |
6,730 |
Florida |
5,500 |
Pennsylvania |
4,690 |
Ohio |
4,670 |
New Jersey |
3,470 |
Connecticut |
3,100 |
| State | Employment |
|---|---|
New York |
26,150 |
California |
25,910 |
Florida |
15,830 |
Texas |
12,800 |
Pennsylvania |
9,260 |
Massachusetts |
7,960 |
Illinois |
7,800 |
North Carolina |
7,690 |
Ohio |
7,040 |
Wisconsin |
5,320 |
| State | Employment |
|---|---|
California |
8,130 |
New York |
7,690 |
Texas |
6,830 |
Florida |
3,100 |
Illinois |
3,040 |
North Carolina |
2,530 |
Ohio |
2,520 |
New Jersey |
2,440 |
Pennsylvania |
2,350 |
Georgia |
2,290 |
| State | Employment |
|---|---|
California |
6,030 |
Texas |
3,980 |
Virginia |
3,370 |
Florida |
3,310 |
New York |
3,150 |
Maryland |
2,200 |
District of Columbia |
1,930 |
New Jersey |
1,910 |
Georgia |
1,880 |
Massachusetts |
1,550 |
| State | Employment |
|---|---|
California |
4,760 |
Texas |
4,600 |
Florida |
4,530 |
New York |
2,970 |
Georgia |
2,620 |
Michigan |
2,350 |
Illinois |
2,330 |
North Carolina |
1,800 |
Minnesota |
1,560 |
Colorado |
1,460 |
| State | Employment |
|---|---|
California |
148,500 |
Texas |
114,410 |
New York |
112,030 |
Florida |
71,520 |
Illinois |
51,740 |
Pennsylvania |
50,880 |
Ohio |
47,240 |
Virginia |
42,200 |
New Jersey |
39,820 |
Colorado |
37,180 |
| State | Employment |
|---|---|
California |
209,160 |
Texas |
117,990 |
Florida |
86,800 |
Illinois |
52,030 |
Colorado |
50,930 |
New Jersey |
49,290 |
New York |
49,010 |
Georgia |
47,170 |
Ohio |
43,740 |
Washington |
43,590 |
| State | Employment |
|---|---|
California |
98,760 |
New York |
68,680 |
Florida |
40,480 |
Texas |
35,030 |
Illinois |
33,670 |
Ohio |
26,410 |
Pennsylvania |
25,380 |
Washington |
22,710 |
Virginia |
21,320 |
Georgia |
21,300 |
| State | Employment |
|---|---|
California |
29,600 |
Texas |
27,110 |
New York |
24,190 |
Florida |
19,900 |
Virginia |
13,610 |
Ohio |
12,290 |
Illinois |
10,600 |
Georgia |
9,810 |
Pennsylvania |
9,570 |
Arizona |
9,530 |
| State | Employment |
|---|---|
California |
10,630 |
New York |
9,760 |
Texas |
6,840 |
Florida |
6,080 |
Illinois |
4,030 |
New Jersey |
3,940 |
Pennsylvania |
3,510 |
Georgia |
3,240 |
Ohio |
2,870 |
Virginia |
2,380 |
| State | Employment |
|---|---|
California |
9,400 |
New York |
8,260 |
Texas |
4,380 |
Massachusetts |
4,230 |
Pennsylvania |
4,010 |
Ohio |
3,860 |
Virginia |
2,920 |
Illinois |
2,750 |
Michigan |
2,630 |
Washington |
2,510 |
| State | Employment |
|---|---|
California |
17,020 |
New York |
10,990 |
Texas |
7,960 |
Florida |
7,660 |
Illinois |
4,710 |
Pennsylvania |
4,450 |
Virginia |
4,130 |
Colorado |
3,530 |
Washington |
3,420 |
Michigan |
3,310 |
| State | Employment |
|---|---|
California |
103,970 |
New York |
53,370 |
Florida |
48,910 |
Virginia |
47,320 |
Texas |
39,880 |
Illinois |
36,340 |
Pennsylvania |
27,300 |
Massachusetts |
25,620 |
Washington |
22,160 |
Ohio |
22,010 |
| State | Employment |
|---|---|
California |
23,020 |
Texas |
15,710 |
Illinois |
9,190 |
New Jersey |
8,310 |
Michigan |
8,280 |
Virginia |
7,850 |
Georgia |
7,780 |
Florida |
7,780 |
Pennsylvania |
7,400 |
Ohio |
6,890 |
| State | Employment |
|---|---|
New York |
8,080 |
California |
7,860 |
Illinois |
4,890 |
Ohio |
4,720 |
Pennsylvania |
4,280 |
New Jersey |
4,160 |
Michigan |
3,630 |
Wisconsin |
3,060 |
Massachusetts |
2,670 |
Indiana |
2,540 |
| State | Employment |
|---|---|
California |
130 |
| State | Employment |
|---|---|
California |
71,130 |
Texas |
49,190 |
New York |
41,880 |
Florida |
36,970 |
Illinois |
27,580 |
Ohio |
26,680 |
Pennsylvania |
24,270 |
Virginia |
21,900 |
Georgia |
21,060 |
North Carolina |
19,070 |
| State | Employment |
|---|---|
California |
27,130 |
Texas |
17,380 |
Florida |
13,190 |
New York |
9,940 |
Ohio |
8,980 |
Virginia |
8,720 |
Pennsylvania |
8,720 |
Michigan |
6,910 |
North Carolina |
6,360 |
Massachusetts |
5,970 |
| State | Employment |
|---|---|
California |
39,250 |
Texas |
27,130 |
Florida |
22,620 |
New York |
22,040 |
New Jersey |
12,870 |
Pennsylvania |
12,670 |
Georgia |
10,350 |
Illinois |
10,150 |
Virginia |
9,330 |
Washington |
8,820 |
| State | Employment |
|---|---|
California |
2,340 |
Texas |
1,560 |
Florida |
1,270 |
New Jersey |
640 |
Massachusetts |
590 |
New York |
580 |
Nevada |
580 |
Ohio |
570 |
Georgia |
470 |
Washington |
290 |
| State | Employment |
|---|---|
Florida |
24,880 |
Texas |
22,390 |
New York |
17,930 |
Pennsylvania |
13,440 |
Ohio |
12,560 |
Illinois |
12,090 |
Arizona |
10,930 |
New Jersey |
10,070 |
North Carolina |
8,720 |
Missouri |
7,700 |
| State | Employment |
|---|---|
California |
45,970 |
Texas |
37,660 |
New York |
25,840 |
Florida |
22,600 |
Ohio |
18,020 |
Pennsylvania |
16,370 |
Virginia |
15,850 |
Washington |
14,910 |
Illinois |
14,840 |
Michigan |
14,560 |
| State | Employment |
|---|---|
New York |
3,560 |
Tennessee |
800 |
Texas |
660 |
Florida |
660 |
North Carolina |
380 |
Massachusetts |
380 |
Georgia |
330 |
Illinois |
300 |
Nevada |
220 |
Michigan |
210 |
| State | Employment |
|---|---|
California |
1,052,970 |
Texas |
643,140 |
New York |
611,820 |
Florida |
500,640 |
Illinois |
343,380 |
Ohio |
298,800 |
Pennsylvania |
294,690 |
Virginia |
283,820 |
Georgia |
260,840 |
New Jersey |
251,600 |
| State | Employment |
|---|---|
California |
69,780 |
Illinois |
34,600 |
Florida |
26,560 |
Texas |
25,630 |
District of Columbia |
20,690 |
Virginia |
17,990 |
New York |
16,620 |
Tennessee |
16,600 |
New Jersey |
15,360 |
Maryland |
14,510 |
| State | Employment |
|---|---|
California |
650 |
Pennsylvania |
640 |
Texas |
610 |
New York |
540 |
Florida |
500 |
Ohio |
450 |
Tennessee |
440 |
Indiana |
440 |
Georgia |
410 |
Illinois |
370 |
| State | Employment |
|---|---|
California |
760 |
Texas |
680 |
New York |
640 |
Illinois |
550 |
Pennsylvania |
400 |
Florida |
400 |
Ohio |
350 |
Georgia |
350 |
New Jersey |
310 |
Virginia |
290 |
| State | Employment |
|---|---|
New York |
13,820 |
Pennsylvania |
8,260 |
Massachusetts |
7,620 |
Texas |
6,710 |
Illinois |
5,640 |
Ohio |
5,060 |
Michigan |
4,570 |
Minnesota |
4,010 |
Georgia |
3,800 |
Oregon |
3,710 |
| State | Employment |
|---|---|
California |
37,870 |
Florida |
22,260 |
Texas |
20,320 |
New York |
8,620 |
Illinois |
7,390 |
Ohio |
7,370 |
Georgia |
6,830 |
Arizona |
6,630 |
North Carolina |
6,410 |
Pennsylvania |
6,070 |
| State | Employment |
|---|---|
New York |
830 |
Texas |
810 |
Pennsylvania |
800 |
California |
790 |
Illinois |
550 |
Ohio |
490 |
North Carolina |
480 |
Michigan |
450 |
New Jersey |
440 |
Virginia |
370 |
| State | Employment |
|---|---|
Pennsylvania |
4,580 |
Massachusetts |
3,870 |
Maryland |
3,620 |
North Carolina |
3,390 |
Texas |
2,880 |
Florida |
2,230 |
Illinois |
2,170 |
Washington |
1,960 |
Michigan |
1,630 |
New York |
1,450 |
| State | Employment |
|---|---|
California |
36,940 |
Texas |
33,320 |
New York |
25,740 |
Pennsylvania |
17,330 |
Massachusetts |
15,810 |
Illinois |
14,510 |
Ohio |
14,490 |
New Jersey |
12,620 |
Michigan |
12,310 |
Maryland |
10,890 |
| State | Employment |
|---|---|
California |
4,290 |
Florida |
3,990 |
Texas |
3,560 |
Ohio |
1,380 |
Tennessee |
1,330 |
Georgia |
1,200 |
Pennsylvania |
1,150 |
Oregon |
1,120 |
Illinois |
1,120 |
New York |
1,070 |
| State | Employment |
|---|---|
California |
690 |
Nevada |
580 |
Oklahoma |
350 |
Florida |
310 |
Mississippi |
280 |
New York |
200 |
New Jersey |
180 |
Michigan |
170 |
Louisiana |
170 |
Iowa |
160 |
| State | Employment |
|---|---|
California |
40,440 |
Florida |
20,150 |
Illinois |
18,250 |
Texas |
15,690 |
Tennessee |
10,520 |
New York |
10,470 |
Georgia |
9,660 |
Ohio |
8,150 |
Massachusetts |
7,050 |
Pennsylvania |
6,610 |
| State | Employment |
|---|---|
California |
34,140 |
Texas |
14,500 |
Michigan |
11,410 |
Illinois |
8,900 |
Massachusetts |
8,190 |
Florida |
7,520 |
Pennsylvania |
7,070 |
New York |
7,060 |
Ohio |
6,100 |
Maryland |
5,100 |
| State | Employment |
|---|---|
Maryland |
2,550 |
Texas |
2,120 |
New York |
2,120 |
Illinois |
1,770 |
Florida |
1,430 |
North Carolina |
1,310 |
Virginia |
1,250 |
Pennsylvania |
1,010 |
Ohio |
950 |
Minnesota |
950 |
| State | Employment |
|---|---|
California |
11,670 |
Massachusetts |
11,490 |
Texas |
10,380 |
Illinois |
8,120 |
Pennsylvania |
5,330 |
Michigan |
5,180 |
North Carolina |
4,870 |
Ohio |
4,610 |
Indiana |
3,660 |
Arizona |
3,070 |
| State | Employment |
|---|---|
Texas |
29,960 |
California |
24,540 |
New York |
20,670 |
Illinois |
12,480 |
Ohio |
9,500 |
New Jersey |
9,370 |
Pennsylvania |
8,470 |
North Carolina |
8,390 |
Massachusetts |
8,290 |
Georgia |
8,240 |
| State | Employment |
|---|---|
California |
7,420 |
Texas |
3,580 |
New York |
3,070 |
Pennsylvania |
2,710 |
Illinois |
2,610 |
Massachusetts |
2,120 |
Georgia |
2,040 |
Ohio |
1,920 |
New Jersey |
1,760 |
North Carolina |
1,690 |
| State | Employment |
|---|---|
Texas |
34,560 |
California |
32,830 |
Florida |
23,820 |
North Carolina |
13,500 |
Illinois |
13,040 |
New York |
11,380 |
Colorado |
10,300 |
Pennsylvania |
9,740 |
Washington |
8,430 |
Ohio |
8,110 |
| State | Employment |
|---|---|
California |
1,490 |
Texas |
470 |
Illinois |
260 |
Idaho |
230 |
Nebraska |
190 |
Florida |
180 |
Iowa |
160 |
Washington |
130 |
Oklahoma |
130 |
New York |
110 |
| State | Employment |
|---|---|
California |
5,180 |
New York |
3,050 |
Illinois |
2,580 |
Texas |
2,310 |
Massachusetts |
1,970 |
Florida |
1,840 |
Georgia |
1,540 |
Maryland |
1,340 |
Tennessee |
1,100 |
Minnesota |
1,100 |
| State | Employment |
|---|---|
California |
21,600 |
New York |
10,980 |
Illinois |
10,890 |
Texas |
10,260 |
Florida |
7,980 |
Massachusetts |
6,740 |
Georgia |
5,670 |
Pennsylvania |
5,450 |
Minnesota |
4,560 |
Ohio |
4,330 |
| State | Employment |
|---|---|
New York |
1,550 |
Texas |
1,410 |
Illinois |
1,210 |
Massachusetts |
830 |
Florida |
800 |
Pennsylvania |
710 |
Georgia |
710 |
North Carolina |
530 |
Ohio |
470 |
New Jersey |
430 |
| State | Employment |
|---|---|
California |
19,430 |
Texas |
13,030 |
Illinois |
9,310 |
Florida |
5,890 |
New Jersey |
5,680 |
Ohio |
5,350 |
Pennsylvania |
4,720 |
New York |
4,510 |
Georgia |
4,290 |
Michigan |
3,860 |
| State | Employment |
|---|---|
California |
7,830 |
Texas |
6,150 |
Illinois |
4,380 |
New York |
4,310 |
Florida |
3,270 |
Massachusetts |
3,020 |
Virginia |
2,680 |
Georgia |
2,370 |
North Carolina |
2,360 |
Pennsylvania |
2,340 |
| State | Employment |
|---|---|
California |
20,770 |
Texas |
13,440 |
Michigan |
12,820 |
Ohio |
11,930 |
Illinois |
11,330 |
Pennsylvania |
6,880 |
Wisconsin |
6,310 |
Indiana |
6,040 |
North Carolina |
5,900 |
Florida |
5,900 |
| State | Employment |
|---|---|
California |
92,060 |
Texas |
46,710 |
New York |
46,100 |
Illinois |
41,900 |
Massachusetts |
33,520 |
Florida |
32,860 |
Ohio |
22,110 |
New Jersey |
22,000 |
Pennsylvania |
20,140 |
Georgia |
18,280 |
| State | Employment |
|---|---|
California |
75,700 |
New York |
28,960 |
Texas |
26,980 |
Illinois |
20,370 |
Florida |
20,090 |
Massachusetts |
19,750 |
New Jersey |
15,570 |
Pennsylvania |
15,040 |
Georgia |
14,950 |
Virginia |
14,680 |
| State | Employment |
|---|---|
California |
41,650 |
Texas |
29,720 |
New York |
19,460 |
Illinois |
19,310 |
Florida |
15,970 |
New Jersey |
12,840 |
Massachusetts |
11,930 |
Ohio |
11,560 |
Georgia |
10,100 |
Michigan |
8,440 |
| State | Employment |
|---|---|
California |
9,210 |
New York |
6,550 |
District of Columbia |
5,990 |
Texas |
5,500 |
Illinois |
5,280 |
Massachusetts |
5,250 |
Florida |
2,730 |
Washington |
2,240 |
Georgia |
2,190 |
New Jersey |
2,100 |
| State | Employment |
|---|---|
California |
80,610 |
Texas |
30,420 |
Illinois |
25,650 |
Florida |
25,020 |
New York |
24,730 |
Massachusetts |
17,560 |
Georgia |
15,290 |
New Jersey |
14,770 |
Ohio |
10,930 |
Minnesota |
10,700 |
| State | Employment |
|---|---|
California |
40,900 |
Illinois |
21,980 |
New York |
21,550 |
Massachusetts |
16,720 |
Texas |
16,290 |
Florida |
12,090 |
New Jersey |
11,220 |
Georgia |
9,220 |
Minnesota |
8,350 |
Pennsylvania |
7,710 |
| State | Employment |
|---|---|
New York |
7,840 |
California |
2,670 |
Texas |
1,390 |
Florida |
1,290 |
Massachusetts |
880 |
Georgia |
670 |
Pennsylvania |
650 |
Maryland |
550 |
Tennessee |
530 |
Michigan |
500 |
| State | Employment |
|---|---|
New York |
6,310 |
California |
3,190 |
New Jersey |
2,780 |
Wisconsin |
2,520 |
Michigan |
2,500 |
Ohio |
2,300 |
Pennsylvania |
2,060 |
Texas |
1,970 |
Indiana |
1,650 |
Georgia |
1,650 |
| State | Employment |
|---|---|
California |
259,550 |
Texas |
217,080 |
New York |
168,730 |
Florida |
147,680 |
Illinois |
128,580 |
Pennsylvania |
86,470 |
Georgia |
83,090 |
Massachusetts |
82,190 |
Michigan |
65,180 |
Ohio |
62,150 |
| State | Employment |
|---|---|
California |
31,730 |
Florida |
26,300 |
Illinois |
10,010 |
New York |
8,990 |
Tennessee |
8,720 |
Massachusetts |
7,810 |
Pennsylvania |
6,630 |
Virginia |
6,440 |
Texas |
6,170 |
Minnesota |
5,630 |
| State | Employment |
|---|---|
California |
1,070,120 |
Texas |
634,640 |
New York |
502,060 |
Florida |
474,730 |
Illinois |
451,260 |
Massachusetts |
306,380 |
Georgia |
272,140 |
Pennsylvania |
270,380 |
Ohio |
245,030 |
New Jersey |
218,260 |