
An official website of the United States government
An official website of the United States government
The .gov means it's official.
Federal government websites often end in .gov or .mil. Before sharing sensitive information,
make sure you're on a federal government site.
The site is secure.
The
https:// ensures that you are connecting to the official website and that any
information you provide is encrypted and transmitted securely.
Determine and formulate policies and provide overall direction of companies or private and public sector organizations within guidelines set up by a board of directors or similar governing body. Plan, direct, or coordinate operational activities at the highest level of management with the help of subordinate executives and staff managers.
Employment estimate and mean wage estimates for this occupation:
| Employment (1) | Employment RSE (3) |
Mean hourly wage |
Mean annual wage (2) |
Wage RSE (3) |
|---|---|---|---|---|
| 205,890 | 0.8 % | $93.20 | $193,850 | 0.4 % |
Percentile wage estimates for this occupation:
| Percentile | 10% | 25% | 50% (Median) |
75% | 90% |
|---|---|---|---|---|---|
| Hourly Wage | $29.95 | $54.23 | $88.68 | (5) | (5) |
| Annual Wage (2) | $62,290 | $112,790 | $184,460 | (5) | (5) |
Industries with the highest published employment and wages for this occupation are provided. For a list of all industries with employment in this occupation, see the Create Customized Tables function.
Industries with the highest levels of employment in this occupation:
| Industry | Employment (1) | Percent of industry employment | Hourly mean wage | Annual mean wage (2) |
|---|---|---|---|---|
| Management of Companies and Enterprises | 16,690 | 0.68 | $112.83 | $234,690 |
| Elementary and Secondary Schools | 9,510 | 0.11 | $73.05 | $151,940 |
| State Government, excluding schools and hospitals (OES Designation) | 8,300 | 0.38 | $52.83 | $109,880 |
| Computer Systems Design and Related Services | 8,120 | 0.37 | $111.94 | $232,840 |
| Management, Scientific, and Technical Consulting Services | 7,860 | 0.53 | $99.81 | $207,600 |
Industries with the highest concentration of employment in this occupation:
| Industry | Employment (1) | Percent of industry employment | Hourly mean wage | Annual mean wage (2) |
|---|---|---|---|---|
| Lessors of Nonfinancial Intangible Assets (except Copyrighted Works) | 280 | 1.25 | $102.30 | $212,790 |
| Business, Professional, Labor, Political, and Similar Organizations | 4,450 | 1.02 | $96.20 | $200,090 |
| Grantmaking and Giving Services | 1,420 | 0.99 | $97.89 | $203,610 |
| Computer and Peripheral Equipment Manufacturing | 1,280 | 0.80 | $115.81 | $240,890 |
| Other Investment Pools and Funds | 70 | 0.77 | $118.80 | $247,110 |
Top paying industries for this occupation:
| Industry | Employment (1) | Percent of industry employment | Hourly mean wage | Annual mean wage (2) |
|---|---|---|---|---|
| Pipeline Transportation of Natural Gas | 30 | 0.11 | $129.21 | $268,750 |
| Other Pipeline Transportation | 50 | 0.62 | $129.15 | $268,630 |
| Natural Gas Distribution | 150 | 0.14 | $127.90 | $266,030 |
| Monetary Authorities-Central Bank | 30 | 0.17 | $127.22 | $264,610 |
| Cable and Other Subscription Programming | 230 | 0.44 | $123.11 | $256,070 |
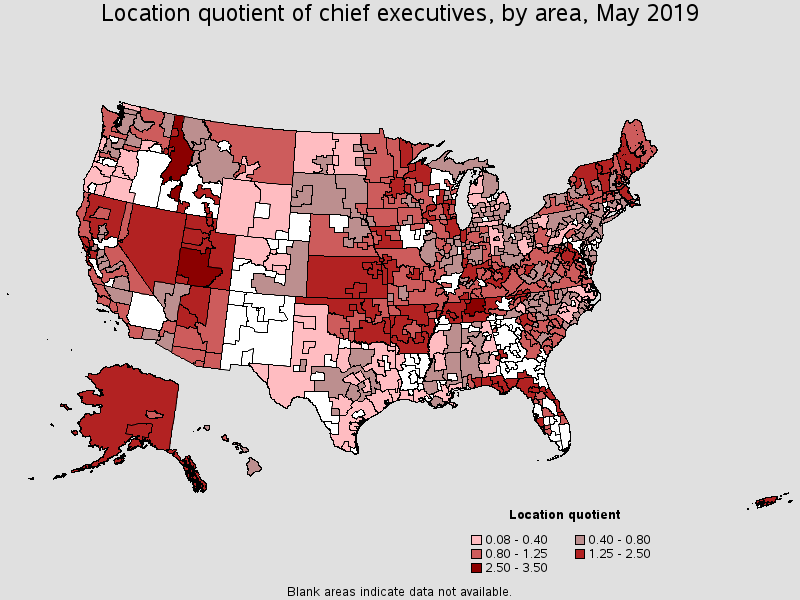
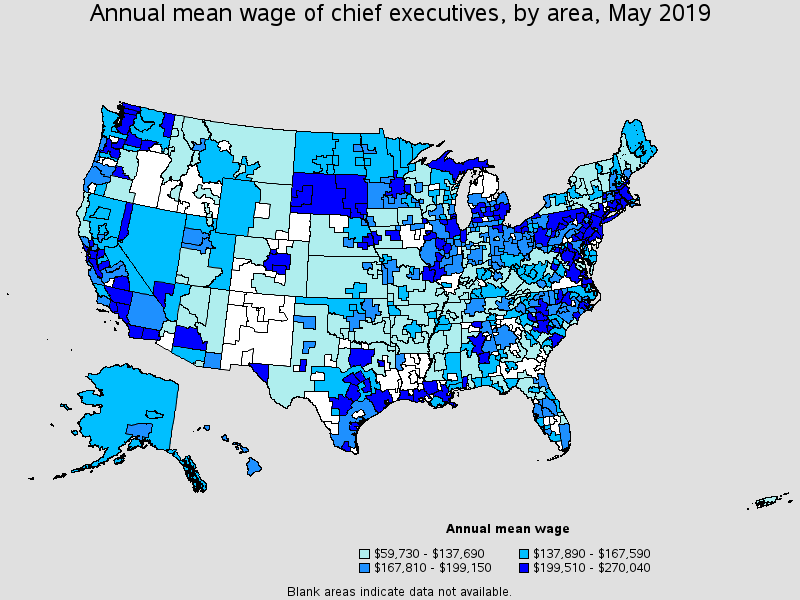
States and areas with the highest published employment, location quotients, and wages for this occupation are provided. For a list of all areas with employment in this occupation, see the Create Customized Tables function.
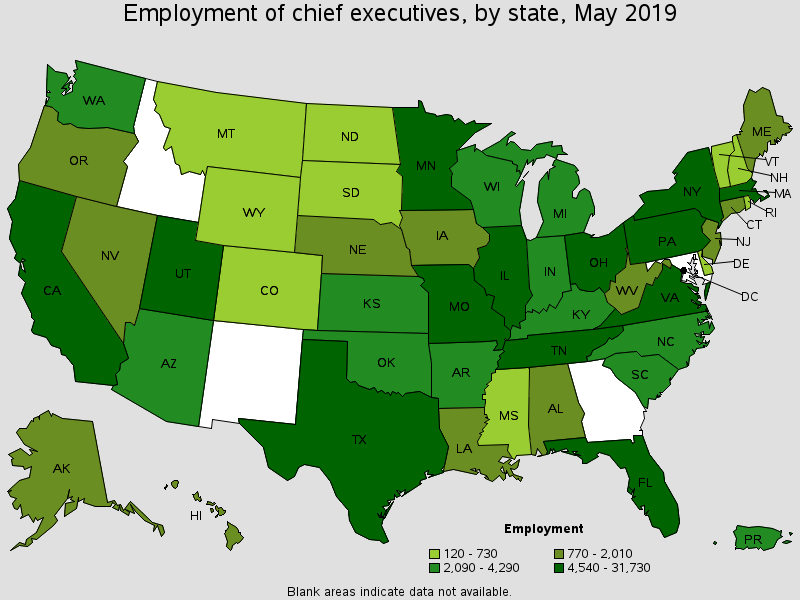
States with the highest employment level in this occupation:
| State | Employment (1) | Employment per thousand jobs | Location quotient (9) | Hourly mean wage | Annual mean wage (2) |
|---|---|---|---|---|---|
| California | 31,730 | 1.83 | 1.30 | $104.10 | $216,520 |
| Florida | 26,300 | 2.99 | 2.13 | $87.02 | $181,000 |
| Illinois | 10,010 | 1.66 | 1.18 | $106.34 | $221,180 |
| New York | 8,990 | 0.94 | 0.67 | $103.60 | $215,490 |
| Tennessee | 8,720 | 2.90 | 2.07 | $76.09 | $158,280 |
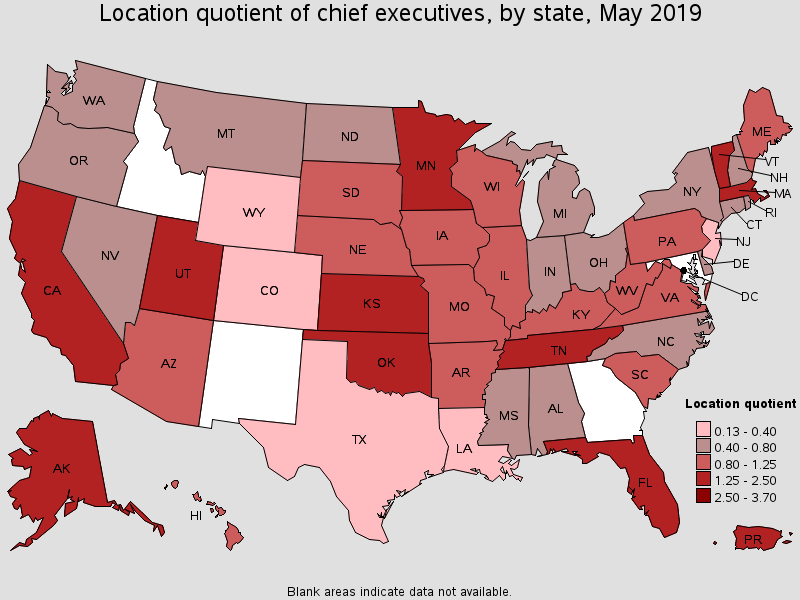
States with the highest concentration of jobs and location quotients in this occupation:
| State | Employment (1) | Employment per thousand jobs | Location quotient (9) | Hourly mean wage | Annual mean wage (2) |
|---|---|---|---|---|---|
| Utah | 4,680 | 3.11 | 2.22 | $78.20 | $162,660 |
| Florida | 26,300 | 2.99 | 2.13 | $87.02 | $181,000 |
| Tennessee | 8,720 | 2.90 | 2.07 | $76.09 | $158,280 |
| Alaska | 920 | 2.90 | 2.07 | $85.00 | $176,790 |
| District of Columbia | 1,960 | 2.71 | 1.93 | $113.20 | $235,450 |
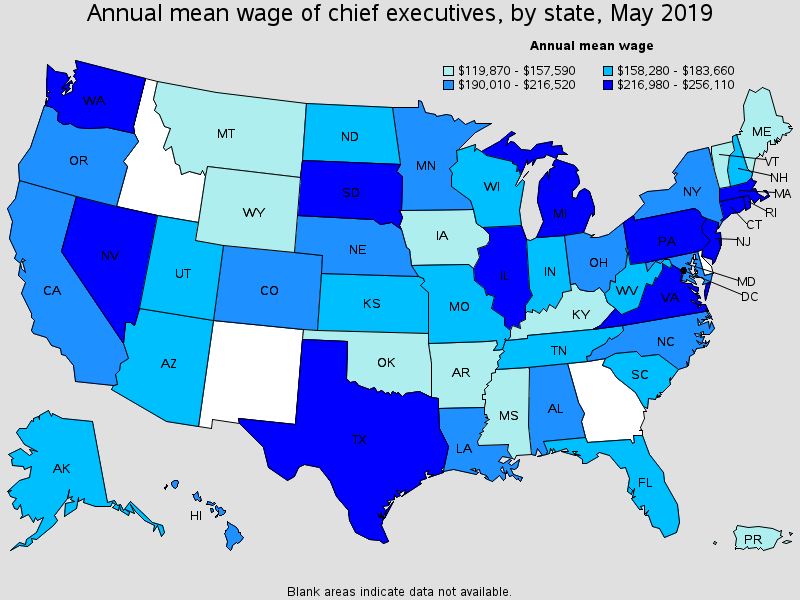
Top paying States for this occupation:
| State | Employment (1) | Employment per thousand jobs | Location quotient (9) | Hourly mean wage | Annual mean wage (2) |
|---|---|---|---|---|---|
| South Dakota | 500 | 1.18 | 0.84 | $123.13 | $256,110 |
| New Jersey | 770 | 0.19 | 0.13 | $121.79 | $253,320 |
| Rhode Island | 300 | 0.61 | 0.44 | $119.89 | $249,360 |
| District of Columbia | 1,960 | 2.71 | 1.93 | $113.20 | $235,450 |
| Connecticut | 970 | 0.58 | 0.42 | $111.34 | $231,590 |
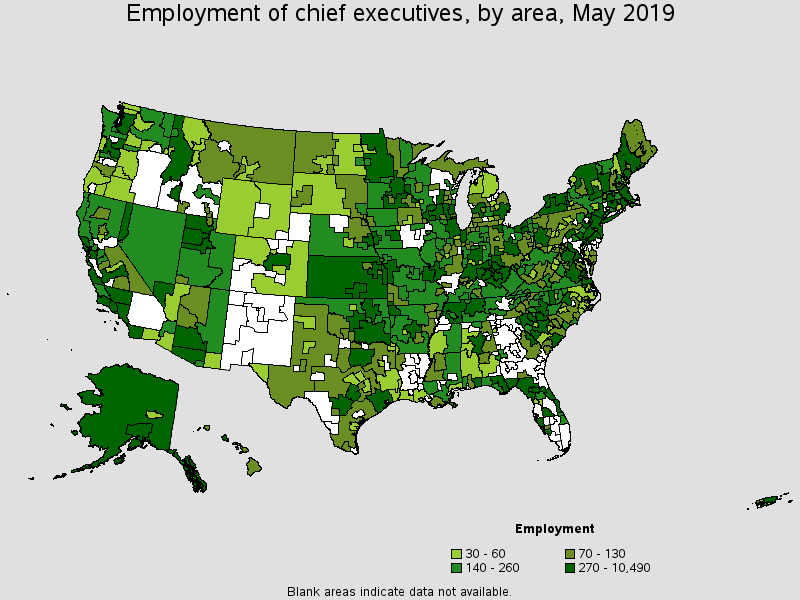
Metropolitan areas with the highest employment level in this occupation:
| Metropolitan area | Employment (1) | Employment per thousand jobs | Location quotient (9) | Hourly mean wage | Annual mean wage (2) |
|---|---|---|---|---|---|
| Los Angeles-Long Beach-Anaheim, CA | 10,490 | 1.68 | 1.20 | $112.41 | $233,810 |
| Chicago-Naperville-Elgin, IL-IN-WI | 8,440 | 1.80 | 1.29 | $107.83 | $224,290 |
| Washington-Arlington-Alexandria, DC-VA-MD-WV | 6,860 | 2.16 | 1.54 | $115.40 | $240,030 |
| Boston-Cambridge-Nashua, MA-NH | 6,520 | 2.33 | 1.66 | $107.51 | $223,620 |
| New York-Newark-Jersey City, NY-NJ-PA | 6,430 | 0.67 | 0.48 | $121.58 | $252,880 |
| San Francisco-Oakland-Hayward, CA | 5,480 | 2.22 | 1.58 | $113.49 | $236,060 |
| Minneapolis-St. Paul-Bloomington, MN-WI | 4,170 | 2.12 | 1.51 | $98.40 | $204,680 |
| Nashville-Davidson--Murfreesboro--Franklin, TN | 3,580 | 3.58 | 2.56 | $84.13 | $174,990 |
| Phoenix-Mesa-Scottsdale, AZ | 3,070 | 1.45 | 1.03 | $96.15 | $200,000 |
| Philadelphia-Camden-Wilmington, PA-NJ-DE-MD | 2,930 | 1.02 | 0.73 | $120.45 | $250,530 |
Metropolitan areas with the highest concentration of jobs and location quotients in this occupation:
| Metropolitan area | Employment (1) | Employment per thousand jobs | Location quotient (9) | Hourly mean wage | Annual mean wage (2) |
|---|---|---|---|---|---|
| Nashville-Davidson--Murfreesboro--Franklin, TN | 3,580 | 3.58 | 2.56 | $84.13 | $174,990 |
| Salt Lake City, UT | 2,500 | 3.41 | 2.43 | $82.62 | $171,840 |
| Provo-Orem, UT | 850 | 3.34 | 2.38 | $86.36 | $179,620 |
| Coeur d'Alene, ID | 210 | 3.29 | 2.35 | $40.09 | $83,380 |
| Anchorage, AK | 520 | 2.99 | 2.13 | $91.41 | $190,140 |
| St. Joseph, MO-KS | 160 | 2.98 | 2.13 | $70.06 | $145,720 |
| Topeka, KS | 320 | 2.95 | 2.10 | $66.20 | $137,690 |
| Pine Bluff, AR | 90 | 2.82 | 2.01 | $50.63 | $105,310 |
| Pocatello, ID | 100 | 2.79 | 1.99 | $35.30 | $73,420 |
| Sebastian-Vero Beach, FL | 150 | 2.77 | 1.98 | $63.98 | $133,090 |
Top paying metropolitan areas for this occupation:
| Metropolitan area | Employment (1) | Employment per thousand jobs | Location quotient (9) | Hourly mean wage | Annual mean wage (2) |
|---|---|---|---|---|---|
| Bridgeport-Stamford-Norwalk, CT | 180 | 0.43 | 0.31 | $129.83 | $270,040 |
| Sioux Falls, SD | 240 | 1.52 | 1.09 | $127.08 | $264,330 |
| Midland, TX | 80 | 0.74 | 0.53 | $124.40 | $258,760 |
| New York-Newark-Jersey City, NY-NJ-PA | 6,430 | 0.67 | 0.48 | $121.58 | $252,880 |
| College Station-Bryan, TX | 50 | 0.44 | 0.31 | $120.62 | $250,890 |
| Philadelphia-Camden-Wilmington, PA-NJ-DE-MD | 2,930 | 1.02 | 0.73 | $120.45 | $250,530 |
| Houston-The Woodlands-Sugar Land, TX | 1,480 | 0.48 | 0.34 | $119.66 | $248,900 |
| San Jose-Sunnyvale-Santa Clara, CA | (8) | (8) | (8) | $119.66 | $248,890 |
| Providence-Warwick, RI-MA | 370 | 0.65 | 0.46 | $119.05 | $247,630 |
| El Paso, TX | 60 | 0.20 | 0.14 | $118.18 | $245,810 |
Nonmetropolitan areas with the highest employment in this occupation:
| Nonmetropolitan area | Employment (1) | Employment per thousand jobs | Location quotient (9) | Hourly mean wage | Annual mean wage (2) |
|---|---|---|---|---|---|
| Kansas nonmetropolitan area | 1,030 | 2.62 | 1.87 | $57.72 | $120,060 |
| South Central Wisconsin nonmetropolitan area | 460 | 2.19 | 1.56 | $58.50 | $121,680 |
| Southwest Maine nonmetropolitan area | 380 | 1.97 | 1.40 | $64.61 | $134,400 |
| Southeast Oklahoma nonmetropolitan area | 360 | 2.14 | 1.53 | $42.31 | $88,000 |
| Southern Indiana nonmetropolitan area | 350 | 1.86 | 1.33 | $55.60 | $115,660 |
Nonmetropolitan areas with the highest concentration of jobs and location quotients in this occupation:
| Nonmetropolitan area | Employment (1) | Employment per thousand jobs | Location quotient (9) | Hourly mean wage | Annual mean wage (2) |
|---|---|---|---|---|---|
| Northwestern Idaho nonmetropolitan area | 310 | 4.49 | 3.20 | $28.72 | $59,730 |
| Central Utah nonmetropolitan area | 220 | 4.44 | 3.17 | $33.21 | $69,070 |
| Northwestern Wisconsin nonmetropolitan area | 160 | 3.31 | 2.36 | $65.57 | $136,390 |
| Alaska nonmetropolitan area | 350 | 3.19 | 2.28 | $75.85 | $157,780 |
| Northern Vermont nonmetropolitan area | 220 | 3.12 | 2.22 | $58.71 | $122,110 |
Top paying nonmetropolitan areas for this occupation:
| Nonmetropolitan area | Employment (1) | Employment per thousand jobs | Location quotient (9) | Hourly mean wage | Annual mean wage (2) |
|---|---|---|---|---|---|
| East South Dakota nonmetropolitan area | 120 | 0.92 | 0.65 | $126.63 | $263,390 |
| Northern Pennsylvania nonmetropolitan area | 110 | 0.66 | 0.47 | $103.86 | $216,030 |
| West South Dakota nonmetropolitan area | 30 | 0.56 | 0.40 | $99.52 | $207,000 |
| Upper Peninsula of Michigan nonmetropolitan area | 90 | 0.77 | 0.55 | $97.93 | $203,690 |
| Coast Oregon nonmetropolitan area | 40 | 0.31 | 0.22 | $94.49 | $196,540 |
These estimates are calculated with data collected from employers in all industry sectors, all metropolitan and nonmetropolitan areas, and all states and the District of Columbia. The top employment and wage figures are provided above. The complete list is available in the downloadable XLS files.
The percentile wage estimate is the value of a wage below which a certain percent of workers fall. The median wage is the 50th percentile wage estimate--50 percent of workers earn less than the median and 50 percent of workers earn more than the median. More about percentile wages.
(1) Estimates for detailed occupations do not sum to the totals because the totals include occupations not shown separately. Estimates do not include self-employed workers.
(2) Annual wages have been calculated by multiplying the hourly mean wage by a "year-round, full-time" hours figure of 2,080 hours; for those occupations where there is not an hourly wage published, the annual wage has been directly calculated from the reported survey data.
(3) The relative standard error (RSE) is a measure of the reliability of a survey statistic. The smaller the relative standard error, the more precise the estimate.
(5) This wage is equal to or greater than $100.00 per hour or $208,000 per year.
(8) Estimate not released.
(9) The location quotient is the ratio of the area concentration of occupational employment to the national average concentration. A location quotient greater than one indicates the occupation has a higher share of employment than average, and a location quotient less than one indicates the occupation is less prevalent in the area than average.
Other OES estimates and related information:
May 2019 National Occupational Employment and Wage Estimates
May 2019 State Occupational Employment and Wage Estimates
May 2019 Metropolitan and Nonmetropolitan Area Occupational Employment and Wage Estimates
May 2019 National Industry-Specific Occupational Employment and Wage Estimates
Last Modified Date: July 6, 2020