
An official website of the United States government
An official website of the United States government
The .gov means it's official.
Federal government websites often end in .gov or .mil. Before sharing sensitive information,
make sure you're on a federal government site.
The site is secure.
The
https:// ensures that you are connecting to the official website and that any
information you provide is encrypted and transmitted securely.
Analyze, test, troubleshoot, and evaluate existing network systems, such as local area networks (LAN), wide area networks (WAN), cloud networks, servers, and other data communications networks. Perform network maintenance to ensure networks operate correctly with minimal interruption. Excludes �Computer Network Architects� (15-1241) and �Network and Computer Systems Administrators� (15-1244).
Employment estimate and mean wage estimates for this occupation:
| Employment (1) | Employment RSE (3) |
Mean hourly wage |
Mean annual wage (2) |
Wage RSE (3) |
|---|---|---|---|---|
| 185,430 | 1.3 % | $33.10 | $68,860 | 0.5 % |
Percentile wage estimates for this occupation:
| Percentile | 10% | 25% | 50% (Median) |
75% | 90% |
|---|---|---|---|---|---|
| Hourly Wage | $18.75 | $23.63 | $30.51 | $40.01 | $51.17 |
| Annual Wage (2) | $38,990 | $49,160 | $63,460 | $83,230 | $106,420 |
Industries with the highest published employment and wages for this occupation are provided. For a list of all industries with employment in this occupation, see the Create Customized Tables function.
Industries with the highest levels of employment in this occupation:
| Industry | Employment (1) | Percent of industry employment | Hourly mean wage | Annual mean wage (2) |
|---|---|---|---|---|
| Computer Systems Design and Related Services | 37,520 | 1.73 | $34.05 | $70,830 |
| Telecommunications | 22,130 | 3.08 | $36.24 | $75,370 |
| Management of Companies and Enterprises | 12,260 | 0.50 | $32.43 | $67,460 |
| Elementary and Secondary Schools | 8,510 | 0.10 | $30.08 | $62,560 |
| Data Processing, Hosting, and Related Services | 6,820 | 2.03 | $35.36 | $73,560 |
Industries with the highest concentration of employment in this occupation:
| Industry | Employment (1) | Percent of industry employment | Hourly mean wage | Annual mean wage (2) |
|---|---|---|---|---|
| Telecommunications | 22,130 | 3.08 | $36.24 | $75,370 |
| Cable and Other Subscription Programming | 1,330 | 2.50 | $30.47 | $63,370 |
| Data Processing, Hosting, and Related Services | 6,820 | 2.03 | $35.36 | $73,560 |
| Computer Systems Design and Related Services | 37,520 | 1.73 | $34.05 | $70,830 |
| Monetary Authorities-Central Bank | 200 | 1.05 | $37.97 | $78,980 |
Top paying industries for this occupation:
| Industry | Employment (1) | Percent of industry employment | Hourly mean wage | Annual mean wage (2) |
|---|---|---|---|---|
| Specialized Design Services | 40 | 0.03 | $42.09 | $87,540 |
| Oil and Gas Extraction | 410 | 0.29 | $41.78 | $86,890 |
| Securities, Commodity Contracts, and Other Financial Investments and Related Activities | 1,730 | 0.18 | $40.75 | $84,770 |
| Aerospace Product and Parts Manufacturing | 280 | 0.05 | $39.13 | $81,380 |
| Scientific Research and Development Services | 1,290 | 0.18 | $38.89 | $80,900 |
States and areas with the highest published employment, location quotients, and wages for this occupation are provided. For a list of all areas with employment in this occupation, see the Create Customized Tables function.
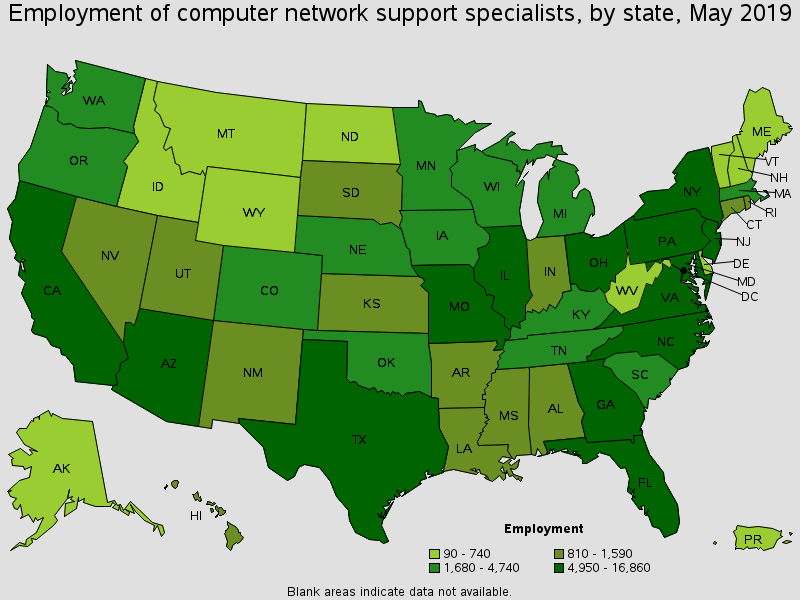
States with the highest employment level in this occupation:
| State | Employment (1) | Employment per thousand jobs | Location quotient (9) | Hourly mean wage | Annual mean wage (2) |
|---|---|---|---|---|---|
| California | 16,860 | 0.97 | 0.77 | $36.13 | $75,150 |
| Texas | 15,530 | 1.25 | 0.99 | $34.39 | $71,530 |
| New York | 13,710 | 1.44 | 1.14 | $37.40 | $77,790 |
| Illinois | 11,130 | 1.85 | 1.46 | $30.80 | $64,070 |
| Florida | 8,900 | 1.01 | 0.80 | $31.26 | $65,030 |
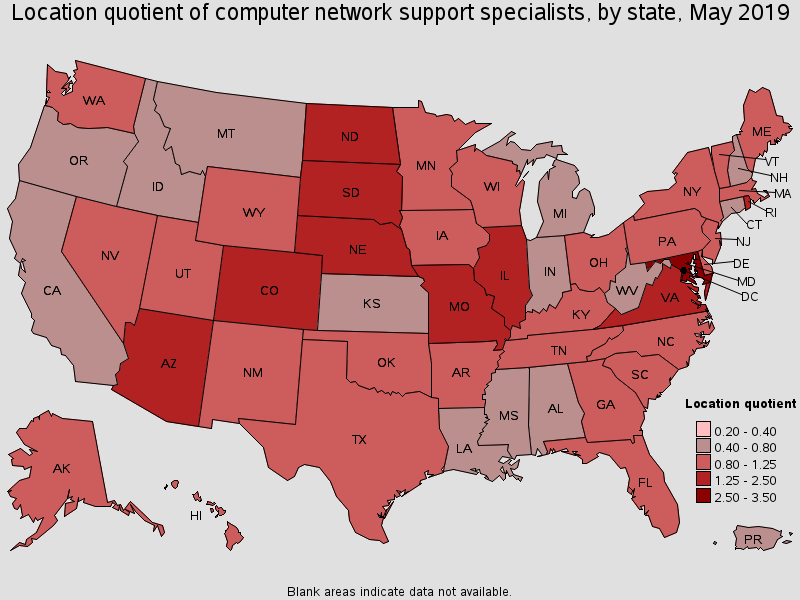
States with the highest concentration of jobs and location quotients in this occupation:
| State | Employment (1) | Employment per thousand jobs | Location quotient (9) | Hourly mean wage | Annual mean wage (2) |
|---|---|---|---|---|---|
| Maryland | 8,530 | 3.16 | 2.50 | $35.30 | $73,410 |
| Rhode Island | 1,190 | 2.46 | 1.95 | $28.90 | $60,110 |
| Missouri | 5,830 | 2.07 | 1.64 | $28.26 | $58,780 |
| Nebraska | 1,990 | 2.03 | 1.61 | $28.25 | $58,760 |
| South Dakota | 820 | 1.92 | 1.52 | $22.97 | $47,770 |
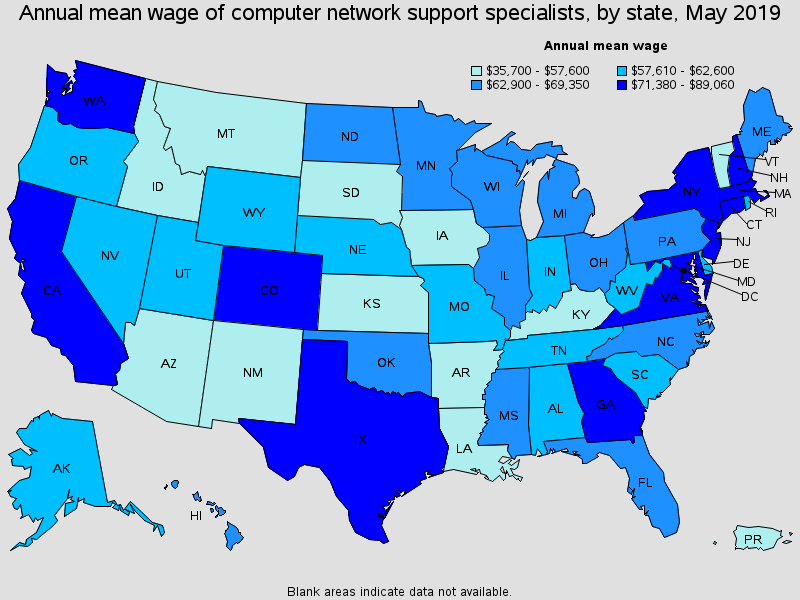
Top paying States for this occupation:
| State | Employment (1) | Employment per thousand jobs | Location quotient (9) | Hourly mean wage | Annual mean wage (2) |
|---|---|---|---|---|---|
| New Jersey | 5,350 | 1.31 | 1.04 | $42.82 | $89,060 |
| Washington | 3,520 | 1.06 | 0.84 | $41.78 | $86,900 |
| Massachusetts | 4,740 | 1.31 | 1.04 | $40.50 | $84,240 |
| District of Columbia | 280 | 0.38 | 0.30 | $40.42 | $84,080 |
| New York | 13,710 | 1.44 | 1.14 | $37.40 | $77,790 |
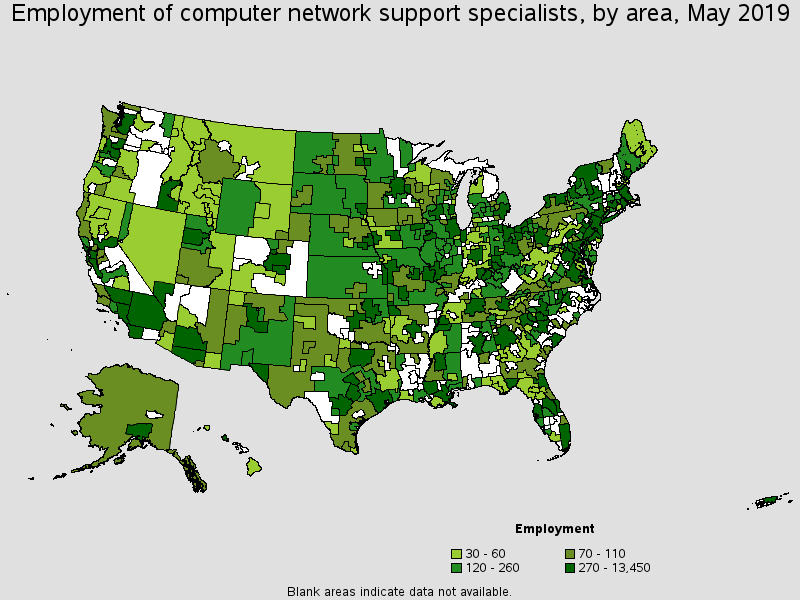
Metropolitan areas with the highest employment level in this occupation:
| Metropolitan area | Employment (1) | Employment per thousand jobs | Location quotient (9) | Hourly mean wage | Annual mean wage (2) |
|---|---|---|---|---|---|
| New York-Newark-Jersey City, NY-NJ-PA | 13,450 | 1.39 | 1.10 | $41.56 | $86,440 |
| Chicago-Naperville-Elgin, IL-IN-WI | 9,120 | 1.95 | 1.54 | $31.49 | $65,500 |
| Washington-Arlington-Alexandria, DC-VA-MD-WV | 7,300 | 2.29 | 1.82 | $37.86 | $78,750 |
| Los Angeles-Long Beach-Anaheim, CA | 5,880 | 0.94 | 0.75 | $33.90 | $70,510 |
| Atlanta-Sandy Springs-Roswell, GA | 5,450 | 1.99 | 1.57 | $34.78 | $72,340 |
| Dallas-Fort Worth-Arlington, TX | 5,300 | 1.45 | 1.15 | $37.94 | $78,920 |
| Baltimore-Columbia-Towson, MD | 4,480 | 3.26 | 2.58 | $35.37 | $73,580 |
| Philadelphia-Camden-Wilmington, PA-NJ-DE-MD | 4,430 | 1.54 | 1.22 | $35.63 | $74,120 |
| Boston-Cambridge-Nashua, MA-NH | 4,300 | 1.54 | 1.22 | $40.81 | $84,880 |
| Phoenix-Mesa-Scottsdale, AZ | 4,070 | 1.92 | 1.52 | $27.40 | $57,000 |
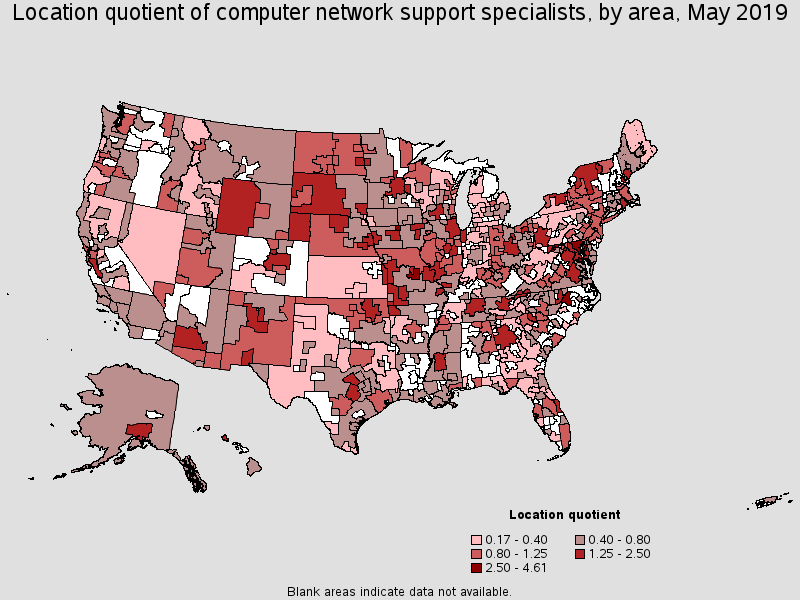
Metropolitan areas with the highest concentration of jobs and location quotients in this occupation:
| Metropolitan area | Employment (1) | Employment per thousand jobs | Location quotient (9) | Hourly mean wage | Annual mean wage (2) |
|---|---|---|---|---|---|
| Jefferson City, MO | 430 | 5.82 | 4.61 | $22.18 | $46,140 |
| California-Lexington Park, MD | 240 | 5.03 | 3.98 | $34.89 | $72,580 |
| Ames, IA | 190 | 4.22 | 3.34 | $25.56 | $53,160 |
| Baltimore-Columbia-Towson, MD | 4,480 | 3.26 | 2.58 | $35.37 | $73,580 |
| Cumberland, MD-WV | 120 | 3.25 | 2.57 | $24.76 | $51,510 |
| Raleigh, NC | 2,070 | 3.19 | 2.52 | $37.03 | $77,020 |
| Fayetteville-Springdale-Rogers, AR-MO | 740 | 2.97 | 2.35 | $20.89 | $43,450 |
| Sioux Falls, SD | 440 | 2.80 | 2.22 | $22.03 | $45,820 |
| Cedar Rapids, IA | 390 | 2.74 | 2.17 | $25.79 | $53,640 |
| Rochester, NY | 1,410 | 2.72 | 2.15 | $29.64 | $61,640 |
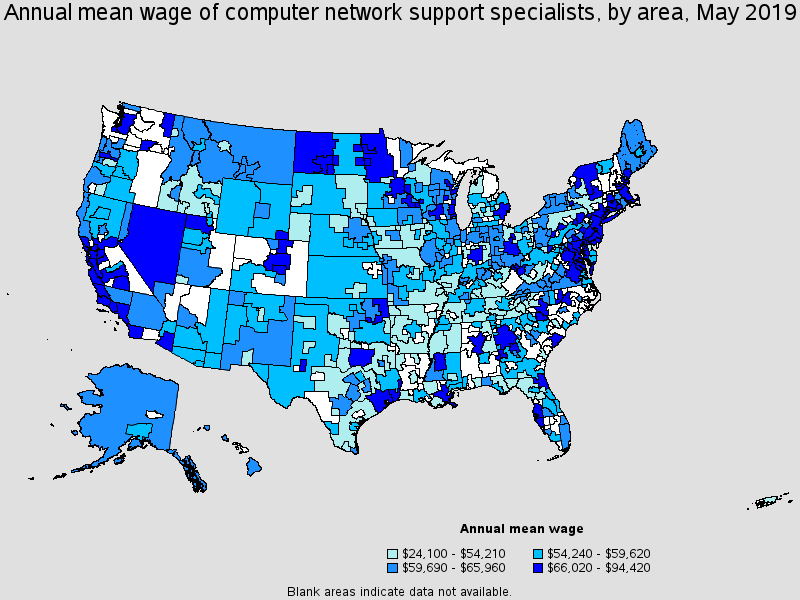
Top paying metropolitan areas for this occupation:
| Metropolitan area | Employment (1) | Employment per thousand jobs | Location quotient (9) | Hourly mean wage | Annual mean wage (2) |
|---|---|---|---|---|---|
| Barnstable Town, MA | 70 | 0.71 | 0.56 | $45.40 | $94,420 |
| Seattle-Tacoma-Bellevue, WA | 2,610 | 1.29 | 1.02 | $43.29 | $90,050 |
| Greeley, CO | 70 | 0.65 | 0.52 | $42.46 | $88,310 |
| New York-Newark-Jersey City, NY-NJ-PA | 13,450 | 1.39 | 1.10 | $41.56 | $86,440 |
| San Francisco-Oakland-Hayward, CA | 3,320 | 1.34 | 1.06 | $41.34 | $85,990 |
| Tampa-St. Petersburg-Clearwater, FL | 1,450 | 1.08 | 0.86 | $41.00 | $85,270 |
| Springfield, MA-CT | 210 | 0.62 | 0.49 | $40.83 | $84,930 |
| Boston-Cambridge-Nashua, MA-NH | 4,300 | 1.54 | 1.22 | $40.81 | $84,880 |
| Atlantic City-Hammonton, NJ | 50 | 0.41 | 0.33 | $40.21 | $83,640 |
| San Jose-Sunnyvale-Santa Clara, CA | 2,190 | 1.92 | 1.52 | $40.08 | $83,370 |
Nonmetropolitan areas with the highest employment in this occupation:
| Nonmetropolitan area | Employment (1) | Employment per thousand jobs | Location quotient (9) | Hourly mean wage | Annual mean wage (2) |
|---|---|---|---|---|---|
| Capital/Northern New York nonmetropolitan area | 350 | 2.40 | 1.90 | $34.54 | $71,830 |
| North Northeastern Ohio non-metropolitan area (non-contiguous) | 290 | 0.88 | 0.69 | $26.04 | $54,170 |
| West Northwestern Ohio nonmetropolitan area | 260 | 1.01 | 0.80 | $30.19 | $62,790 |
| Piedmont North Carolina nonmetropolitan area | 210 | 0.82 | 0.65 | (8) | (8) |
| Western Wyoming nonmetropolitan area | 200 | 2.03 | 1.61 | $27.92 | $58,070 |
Nonmetropolitan areas with the highest concentration of jobs and location quotients in this occupation:
| Nonmetropolitan area | Employment (1) | Employment per thousand jobs | Location quotient (9) | Hourly mean wage | Annual mean wage (2) |
|---|---|---|---|---|---|
| West South Dakota nonmetropolitan area | 150 | 2.53 | 2.00 | $27.65 | $57,510 |
| Capital/Northern New York nonmetropolitan area | 350 | 2.40 | 1.90 | $34.54 | $71,830 |
| Western Wyoming nonmetropolitan area | 200 | 2.03 | 1.61 | $27.92 | $58,070 |
| Maryland nonmetropolitan area | 120 | 1.89 | 1.50 | $32.30 | $67,180 |
| Northwest Nebraska nonmetropolitan area | 70 | 1.84 | 1.46 | $25.40 | $52,830 |
Top paying nonmetropolitan areas for this occupation:
| Nonmetropolitan area | Employment (1) | Employment per thousand jobs | Location quotient (9) | Hourly mean wage | Annual mean wage (2) |
|---|---|---|---|---|---|
| Northeast Oklahoma nonmetropolitan area | 160 | 1.42 | 1.12 | $42.45 | $88,290 |
| Capital/Northern New York nonmetropolitan area | 350 | 2.40 | 1.90 | $34.54 | $71,830 |
| Northeast Virginia nonmetropolitan area | 40 | 0.84 | 0.67 | $33.22 | $69,100 |
| Nevada nonmetropolitan area | 50 | 0.47 | 0.37 | $33.10 | $68,840 |
| West North Dakota nonmetropolitan area | 190 | 1.51 | 1.20 | $32.65 | $67,910 |
These estimates are calculated with data collected from employers in all industry sectors, all metropolitan and nonmetropolitan areas, and all states and the District of Columbia. The top employment and wage figures are provided above. The complete list is available in the downloadable XLS files.
The percentile wage estimate is the value of a wage below which a certain percent of workers fall. The median wage is the 50th percentile wage estimate--50 percent of workers earn less than the median and 50 percent of workers earn more than the median. More about percentile wages.
(1) Estimates for detailed occupations do not sum to the totals because the totals include occupations not shown separately. Estimates do not include self-employed workers.
(2) Annual wages have been calculated by multiplying the hourly mean wage by a "year-round, full-time" hours figure of 2,080 hours; for those occupations where there is not an hourly wage published, the annual wage has been directly calculated from the reported survey data.
(3) The relative standard error (RSE) is a measure of the reliability of a survey statistic. The smaller the relative standard error, the more precise the estimate.
(8) Estimate not released.
(9) The location quotient is the ratio of the area concentration of occupational employment to the national average concentration. A location quotient greater than one indicates the occupation has a higher share of employment than average, and a location quotient less than one indicates the occupation is less prevalent in the area than average.
Other OES estimates and related information:
May 2019 National Occupational Employment and Wage Estimates
May 2019 State Occupational Employment and Wage Estimates
May 2019 Metropolitan and Nonmetropolitan Area Occupational Employment and Wage Estimates
May 2019 National Industry-Specific Occupational Employment and Wage Estimates
Last Modified Date: July 6, 2020