
An official website of the United States government
An official website of the United States government
The .gov means it's official.
Federal government websites often end in .gov or .mil. Before sharing sensitive information,
make sure you're on a federal government site.
The site is secure.
The
https:// ensures that you are connecting to the official website and that any
information you provide is encrypted and transmitted securely.
Create, modify, and test the code and scripts that allow computer applications to run. Work from specifications drawn up by software and web developers or other individuals. May develop and write computer programs to store, locate, and retrieve specific documents, data, and information.
Employment estimate and mean wage estimates for this occupation:
| Employment (1) | Employment RSE (3) |
Mean hourly wage |
Mean annual wage (2) |
Wage RSE (3) |
|---|---|---|---|---|
| 199,540 | 1.6 % | $44.53 | $92,610 | 1.4 % |
Percentile wage estimates for this occupation:
| Percentile | 10% | 25% | 50% (Median) |
75% | 90% |
|---|---|---|---|---|---|
| Hourly Wage | $24.11 | $31.62 | $41.61 | $53.91 | $67.43 |
| Annual Wage (2) | $50,150 | $65,760 | $86,550 | $112,120 | $140,250 |
Industries with the highest published employment and wages for this occupation are provided. For a list of all industries with employment in this occupation, see the Create Customized Tables function.
Industries with the highest levels of employment in this occupation:
| Industry | Employment (1) | Percent of industry employment | Hourly mean wage | Annual mean wage (2) |
|---|---|---|---|---|
| Computer Systems Design and Related Services | 79,650 | 3.66 | $44.05 | $91,620 |
| Software Publishers | 9,890 | 2.29 | $59.75 | $124,280 |
| Management of Companies and Enterprises | 8,740 | 0.35 | $43.89 | $91,300 |
| Data Processing, Hosting, and Related Services | 6,880 | 2.05 | $47.96 | $99,770 |
| Colleges, Universities, and Professional Schools | 6,380 | 0.21 | $37.85 | $78,740 |
Industries with the highest concentration of employment in this occupation:
| Industry | Employment (1) | Percent of industry employment | Hourly mean wage | Annual mean wage (2) |
|---|---|---|---|---|
| Computer Systems Design and Related Services | 79,650 | 3.66 | $44.05 | $91,620 |
| Software Publishers | 9,890 | 2.29 | $59.75 | $124,280 |
| Data Processing, Hosting, and Related Services | 6,880 | 2.05 | $47.96 | $99,770 |
| Other Pipeline Transportation | 70 | 0.85 | $47.88 | $99,580 |
| Scientific Research and Development Services | 4,640 | 0.66 | $51.22 | $106,530 |
Top paying industries for this occupation:
| Industry | Employment (1) | Percent of industry employment | Hourly mean wage | Annual mean wage (2) |
|---|---|---|---|---|
| Lessors of Nonfinancial Intangible Assets (except Copyrighted Works) | 70 | 0.31 | $61.06 | $127,000 |
| Software Publishers | 9,890 | 2.29 | $59.75 | $124,280 |
| Manufacturing and Reproducing Magnetic and Optical Media | 30 | 0.29 | $59.12 | $122,960 |
| Natural Gas Distribution | 250 | 0.23 | $57.46 | $119,520 |
| Grantmaking and Giving Services | 90 | 0.06 | $54.79 | $113,960 |
States and areas with the highest published employment, location quotients, and wages for this occupation are provided. For a list of all areas with employment in this occupation, see the Create Customized Tables function.
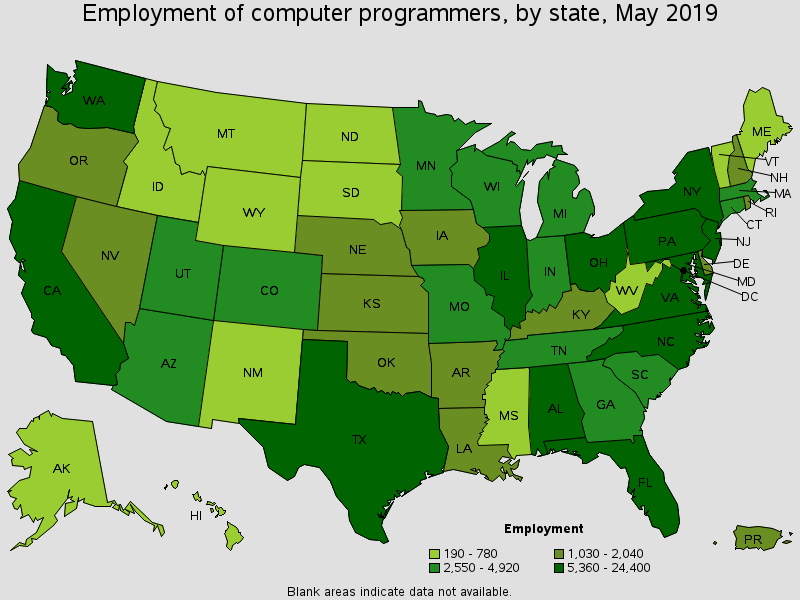
States with the highest employment level in this occupation:
| State | Employment (1) | Employment per thousand jobs | Location quotient (9) | Hourly mean wage | Annual mean wage (2) |
|---|---|---|---|---|---|
| California | 24,400 | 1.40 | 1.03 | $49.90 | $103,790 |
| Texas | 20,430 | 1.64 | 1.21 | $45.97 | $95,620 |
| New York | 13,380 | 1.41 | 1.03 | $44.50 | $92,550 |
| Florida | 9,670 | 1.10 | 0.81 | $38.64 | $80,370 |
| Illinois | 9,260 | 1.54 | 1.13 | $45.20 | $94,010 |
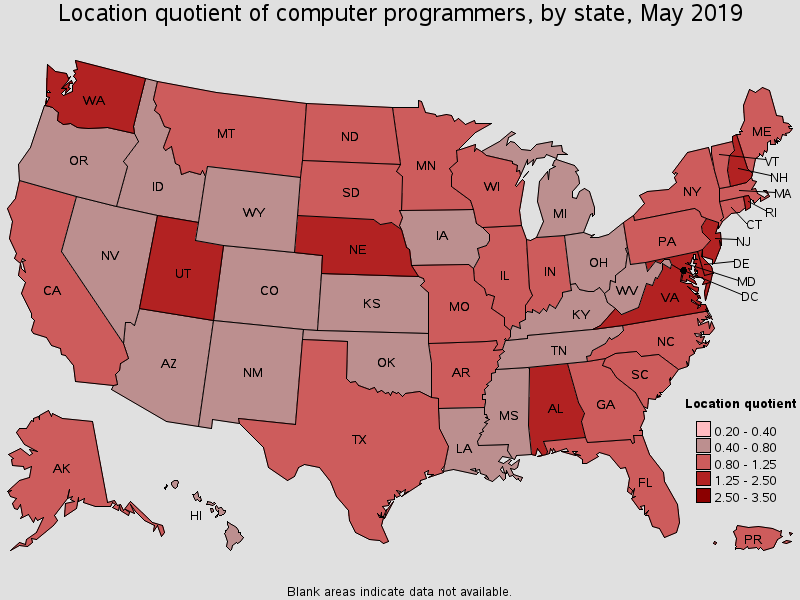
States with the highest concentration of jobs and location quotients in this occupation:
| State | Employment (1) | Employment per thousand jobs | Location quotient (9) | Hourly mean wage | Annual mean wage (2) |
|---|---|---|---|---|---|
| Alabama | 6,200 | 3.14 | 2.31 | $43.44 | $90,360 |
| Delaware | 1,080 | 2.39 | 1.76 | $39.53 | $82,220 |
| Rhode Island | 1,110 | 2.30 | 1.70 | (8) | (8) |
| New Jersey | 9,070 | 2.22 | 1.63 | $44.91 | $93,410 |
| Maryland | 5,610 | 2.08 | 1.53 | $45.77 | $95,190 |
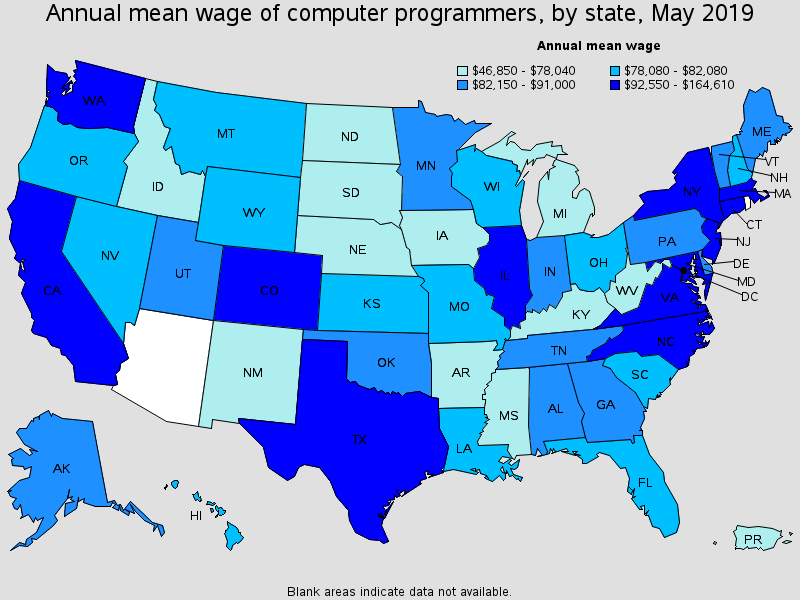
Top paying States for this occupation:
| State | Employment (1) | Employment per thousand jobs | Location quotient (9) | Hourly mean wage | Annual mean wage (2) |
|---|---|---|---|---|---|
| Washington | 5,680 | 1.71 | 1.26 | $79.14 | $164,610 |
| District of Columbia | 620 | 0.86 | 0.63 | $56.42 | $117,350 |
| California | 24,400 | 1.40 | 1.03 | $49.90 | $103,790 |
| Massachusetts | 4,540 | 1.25 | 0.92 | $46.89 | $97,520 |
| Connecticut | 2,630 | 1.58 | 1.16 | $46.39 | $96,480 |
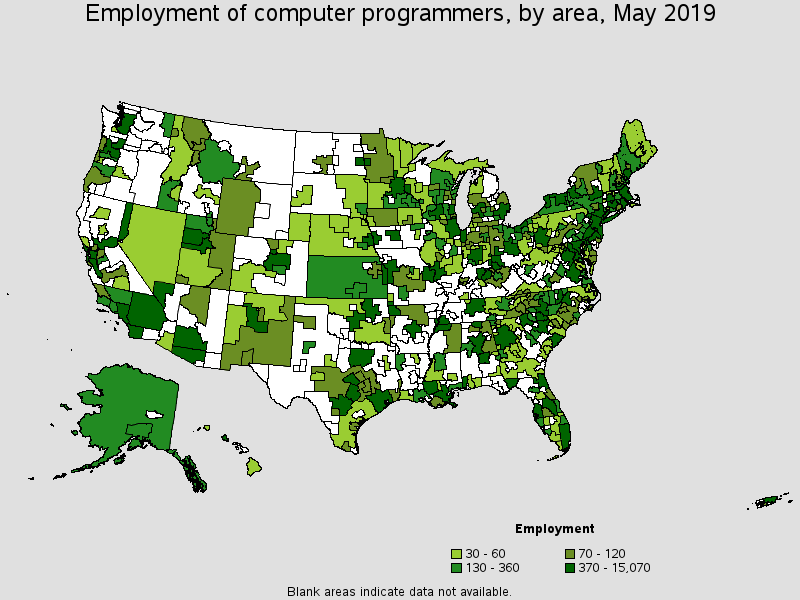
Metropolitan areas with the highest employment level in this occupation:
| Metropolitan area | Employment (1) | Employment per thousand jobs | Location quotient (9) | Hourly mean wage | Annual mean wage (2) |
|---|---|---|---|---|---|
| New York-Newark-Jersey City, NY-NJ-PA | 15,070 | 1.56 | 1.15 | $47.15 | $98,070 |
| Dallas-Fort Worth-Arlington, TX | 9,240 | 2.53 | 1.86 | $47.47 | $98,730 |
| Chicago-Naperville-Elgin, IL-IN-WI | 7,720 | 1.65 | 1.22 | $46.37 | $96,450 |
| Washington-Arlington-Alexandria, DC-VA-MD-WV | 7,150 | 2.25 | 1.66 | $48.12 | $100,090 |
| Los Angeles-Long Beach-Anaheim, CA | 6,920 | 1.11 | 0.82 | $46.06 | $95,800 |
| San Francisco-Oakland-Hayward, CA | 6,120 | 2.48 | 1.82 | $55.96 | $116,400 |
| Philadelphia-Camden-Wilmington, PA-NJ-DE-MD | 5,280 | 1.83 | 1.35 | $45.46 | $94,550 |
| Seattle-Tacoma-Bellevue, WA | 5,040 | 2.49 | 1.83 | (8) | (8) |
| Boston-Cambridge-Nashua, MA-NH | 4,150 | 1.48 | 1.09 | $46.89 | $97,540 |
| Houston-The Woodlands-Sugar Land, TX | 3,850 | 1.26 | 0.93 | $48.11 | $100,070 |
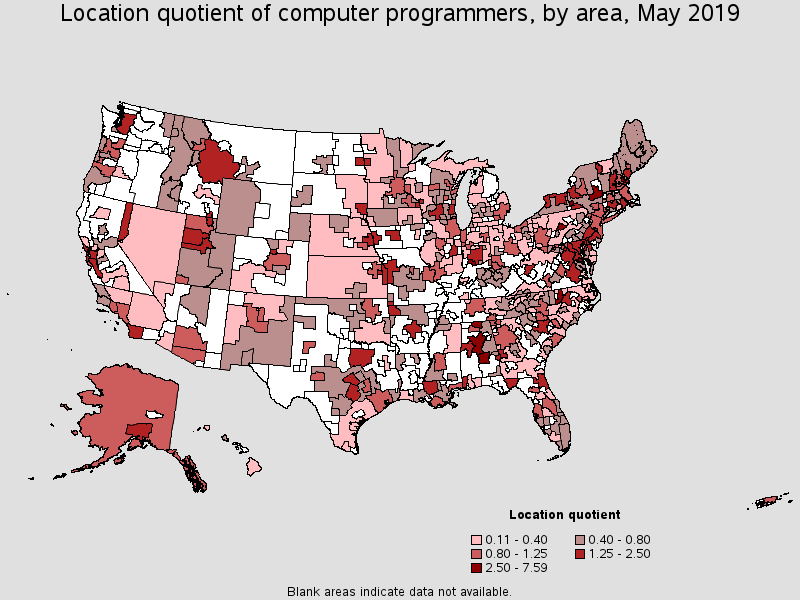
Metropolitan areas with the highest concentration of jobs and location quotients in this occupation:
| Metropolitan area | Employment (1) | Employment per thousand jobs | Location quotient (9) | Hourly mean wage | Annual mean wage (2) |
|---|---|---|---|---|---|
| Huntsville, AL | 2,400 | 10.31 | 7.59 | $46.48 | $96,670 |
| State College, PA | 360 | 5.30 | 3.90 | $34.18 | $71,090 |
| Ithaca, NY | 240 | 4.73 | 3.48 | $49.57 | $103,100 |
| Bloomington, IN | 310 | 4.34 | 3.20 | $29.91 | $62,210 |
| Albany-Schenectady-Troy, NY | 1,930 | 4.26 | 3.14 | $37.84 | $78,700 |
| Dover-Durham, NH-ME | 220 | 4.08 | 3.00 | $44.34 | $92,230 |
| Durham-Chapel Hill, NC | 1,240 | 3.95 | 2.91 | $45.03 | $93,670 |
| Montgomery, AL | 630 | 3.87 | 2.85 | $38.66 | $80,400 |
| Birmingham-Hoover, AL | 1,910 | 3.69 | 2.72 | $42.38 | $88,150 |
| California-Lexington Park, MD | 170 | 3.50 | 2.58 | $49.76 | $103,510 |
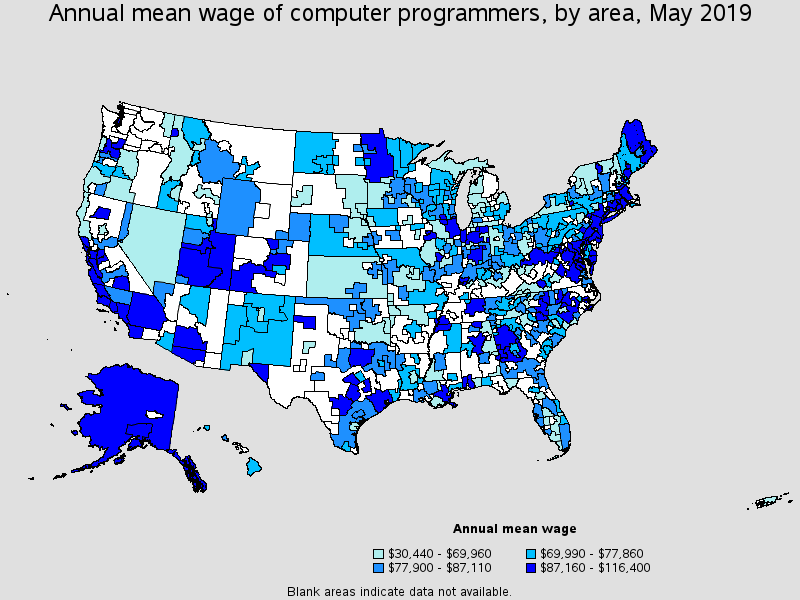
Top paying metropolitan areas for this occupation:
| Metropolitan area | Employment (1) | Employment per thousand jobs | Location quotient (9) | Hourly mean wage | Annual mean wage (2) |
|---|---|---|---|---|---|
| San Francisco-Oakland-Hayward, CA | 6,120 | 2.48 | 1.82 | $55.96 | $116,400 |
| San Jose-Sunnyvale-Santa Clara, CA | 3,510 | 3.08 | 2.26 | $54.80 | $113,990 |
| Charlottesville, VA | 140 | 1.22 | 0.90 | $54.69 | $113,760 |
| Redding, CA | 30 | 0.45 | 0.33 | $54.66 | $113,690 |
| Bridgeport-Stamford-Norwalk, CT | 440 | 1.06 | 0.78 | $52.84 | $109,910 |
| Waterbury, CT | 40 | 0.55 | 0.40 | $50.80 | $105,670 |
| Raleigh, NC | 1,230 | 1.89 | 1.39 | $50.56 | $105,170 |
| Phoenix-Mesa-Scottsdale, AZ | 2,290 | 1.08 | 0.80 | $50.11 | $104,220 |
| San Diego-Carlsbad, CA | 3,780 | 2.53 | 1.86 | $50.01 | $104,030 |
| California-Lexington Park, MD | 170 | 3.50 | 2.58 | $49.76 | $103,510 |
Nonmetropolitan areas with the highest employment in this occupation:
| Nonmetropolitan area | Employment (1) | Employment per thousand jobs | Location quotient (9) | Hourly mean wage | Annual mean wage (2) |
|---|---|---|---|---|---|
| Southwest Montana nonmetropolitan area | 320 | 2.30 | 1.70 | $41.10 | $85,480 |
| West Central-Southwest New Hampshire nonmetropolitan area | 230 | 2.24 | 1.65 | (8) | (8) |
| Northeastern Wisconsin nonmetropolitan area | 200 | 1.01 | 0.74 | $36.41 | $75,740 |
| North Northeastern Ohio non-metropolitan area (non-contiguous) | 170 | 0.52 | 0.38 | $37.99 | $79,010 |
| Alaska nonmetropolitan area | 160 | 1.49 | 1.10 | $45.61 | $94,870 |
Nonmetropolitan areas with the highest concentration of jobs and location quotients in this occupation:
| Nonmetropolitan area | Employment (1) | Employment per thousand jobs | Location quotient (9) | Hourly mean wage | Annual mean wage (2) |
|---|---|---|---|---|---|
| Southwest Montana nonmetropolitan area | 320 | 2.30 | 1.70 | $41.10 | $85,480 |
| West Central-Southwest New Hampshire nonmetropolitan area | 230 | 2.24 | 1.65 | (8) | (8) |
| Alaska nonmetropolitan area | 160 | 1.49 | 1.10 | $45.61 | $94,870 |
| Central New Hampshire nonmetropolitan area | 110 | 1.11 | 0.81 | $29.82 | $62,010 |
| Western Wyoming nonmetropolitan area | 100 | 1.02 | 0.75 | $38.09 | $79,240 |
Top paying nonmetropolitan areas for this occupation:
| Nonmetropolitan area | Employment (1) | Employment per thousand jobs | Location quotient (9) | Hourly mean wage | Annual mean wage (2) |
|---|---|---|---|---|---|
| Alaska nonmetropolitan area | 160 | 1.49 | 1.10 | $45.61 | $94,870 |
| Eastern Utah nonmetropolitan area | 70 | 0.90 | 0.66 | $45.45 | $94,540 |
| Northeast Virginia nonmetropolitan area | 40 | 0.86 | 0.63 | $44.76 | $93,090 |
| Northern West Virginia nonmetropolitan area | 30 | 0.23 | 0.17 | $43.56 | $90,610 |
| Northwest Minnesota nonmetropolitan area | 90 | 0.49 | 0.36 | $43.49 | $90,460 |
These estimates are calculated with data collected from employers in all industry sectors, all metropolitan and nonmetropolitan areas, and all states and the District of Columbia. The top employment and wage figures are provided above. The complete list is available in the downloadable XLS files.
The percentile wage estimate is the value of a wage below which a certain percent of workers fall. The median wage is the 50th percentile wage estimate--50 percent of workers earn less than the median and 50 percent of workers earn more than the median. More about percentile wages.
(1) Estimates for detailed occupations do not sum to the totals because the totals include occupations not shown separately. Estimates do not include self-employed workers.
(2) Annual wages have been calculated by multiplying the hourly mean wage by a "year-round, full-time" hours figure of 2,080 hours; for those occupations where there is not an hourly wage published, the annual wage has been directly calculated from the reported survey data.
(3) The relative standard error (RSE) is a measure of the reliability of a survey statistic. The smaller the relative standard error, the more precise the estimate.
(8) Estimate not released.
(9) The location quotient is the ratio of the area concentration of occupational employment to the national average concentration. A location quotient greater than one indicates the occupation has a higher share of employment than average, and a location quotient less than one indicates the occupation is less prevalent in the area than average.
Other OES estimates and related information:
May 2019 National Occupational Employment and Wage Estimates
May 2019 State Occupational Employment and Wage Estimates
May 2019 Metropolitan and Nonmetropolitan Area Occupational Employment and Wage Estimates
May 2019 National Industry-Specific Occupational Employment and Wage Estimates
Last Modified Date: July 6, 2020