
An official website of the United States government
An official website of the United States government
The .gov means it's official.
Federal government websites often end in .gov or .mil. Before sharing sensitive information,
make sure you're on a federal government site.
The site is secure.
The
https:// ensures that you are connecting to the official website and that any
information you provide is encrypted and transmitted securely.
This occupation includes the 2018 SOC occupations 19-4012 Agricultural Technicians and 19-4013 Food Science Technicians and the 2010 SOC occupation 19-4011 Agricultural and Food Science Technicians.
Employment estimate and mean wage estimates for this occupation:
| Employment (1) | Employment RSE (3) |
Mean hourly wage |
Mean annual wage (2) |
Wage RSE (3) |
|---|---|---|---|---|
| 21,870 | 2.9 % | $21.37 | $44,440 | 1.2 % |
Percentile wage estimates for this occupation:
| Percentile | 10% | 25% | 50% (Median) |
75% | 90% |
|---|---|---|---|---|---|
| Hourly Wage | $13.48 | $16.26 | $19.82 | $24.69 | $30.86 |
| Annual Wage (2) | $28,030 | $33,820 | $41,230 | $51,360 | $64,180 |
Industries with the highest published employment and wages for this occupation are provided. For a list of all industries with employment in this occupation, see the Create Customized Tables function.
Industries with the highest levels of employment in this occupation:
| Industry | Employment (1) | Percent of industry employment | Hourly mean wage | Annual mean wage (2) |
|---|---|---|---|---|
| Colleges, Universities, and Professional Schools | 4,010 | 0.13 | $22.68 | $47,180 |
| Scientific Research and Development Services | 2,280 | 0.32 | $21.52 | $44,760 |
| Dairy Product Manufacturing | 2,230 | 1.48 | $21.63 | $45,000 |
| Management, Scientific, and Technical Consulting Services | 1,270 | 0.09 | $21.47 | $44,660 |
| Architectural, Engineering, and Related Services | 1,100 | 0.07 | $20.31 | $42,240 |
Industries with the highest concentration of employment in this occupation:
| Industry | Employment (1) | Percent of industry employment | Hourly mean wage | Annual mean wage (2) |
|---|---|---|---|---|
| Support Activities for Animal Production | 660 | 2.11 | $17.72 | $36,850 |
| Grain and Oilseed Milling | 910 | 1.51 | $20.63 | $42,910 |
| Dairy Product Manufacturing | 2,230 | 1.48 | $21.63 | $45,000 |
| Fruit and Vegetable Preserving and Specialty Food Manufacturing | 1,040 | 0.62 | $20.35 | $42,340 |
| Animal Food Manufacturing | 330 | 0.51 | $20.63 | $42,910 |
Top paying industries for this occupation:
| Industry | Employment (1) | Percent of industry employment | Hourly mean wage | Annual mean wage (2) |
|---|---|---|---|---|
| Management of Companies and Enterprises | 550 | 0.02 | $27.32 | $56,820 |
| Merchant Wholesalers, Nondurable Goods (4241, 4247, and 4249 only) | 440 | 0.08 | $26.07 | $54,210 |
| Wholesale Electronic Markets and Agents and Brokers | 140 | 0.03 | $24.67 | $51,310 |
| Elementary and Secondary Schools | (8) | (8) | $23.93 | $49,760 |
| Tobacco Manufacturing | (8) | (8) | $23.14 | $48,130 |
States and areas with the highest published employment, location quotients, and wages for this occupation are provided. For a list of all areas with employment in this occupation, see the Create Customized Tables function.
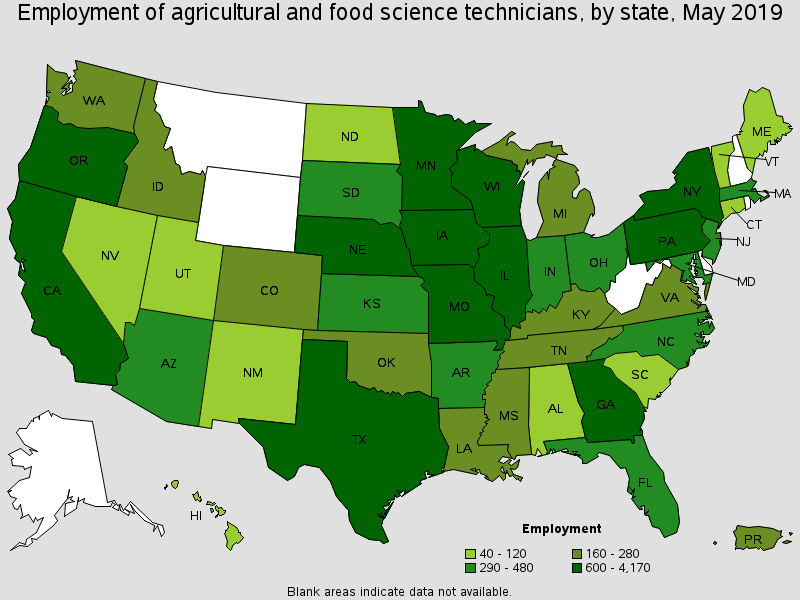
States with the highest employment level in this occupation:
| State | Employment (1) | Employment per thousand jobs | Location quotient (9) | Hourly mean wage | Annual mean wage (2) |
|---|---|---|---|---|---|
| California | 4,170 | 0.24 | 1.61 | $22.47 | $46,730 |
| Texas | 1,280 | 0.10 | 0.69 | $22.16 | $46,090 |
| Iowa | 1,280 | 0.83 | 5.54 | $22.13 | $46,030 |
| Wisconsin | 1,140 | 0.40 | 2.66 | $20.67 | $43,000 |
| New York | 1,040 | 0.11 | 0.73 | $25.71 | $53,480 |
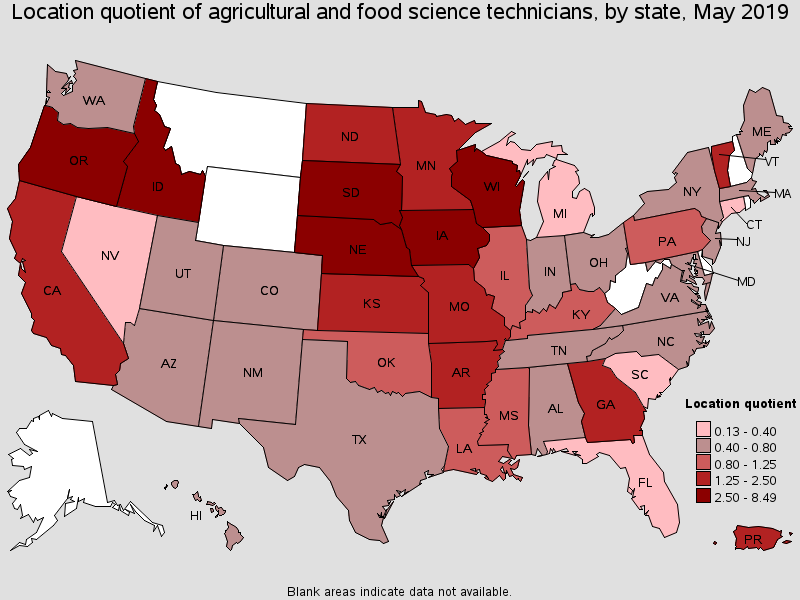
States with the highest concentration of jobs and location quotients in this occupation:
| State | Employment (1) | Employment per thousand jobs | Location quotient (9) | Hourly mean wage | Annual mean wage (2) |
|---|---|---|---|---|---|
| Iowa | 1,280 | 0.83 | 5.54 | $22.13 | $46,030 |
| Nebraska | 810 | 0.82 | 5.54 | $18.96 | $39,440 |
| South Dakota | 300 | 0.70 | 4.69 | $14.24 | $29,610 |
| Oregon | 860 | 0.45 | 3.02 | $20.37 | $42,370 |
| Wisconsin | 1,140 | 0.40 | 2.66 | $20.67 | $43,000 |
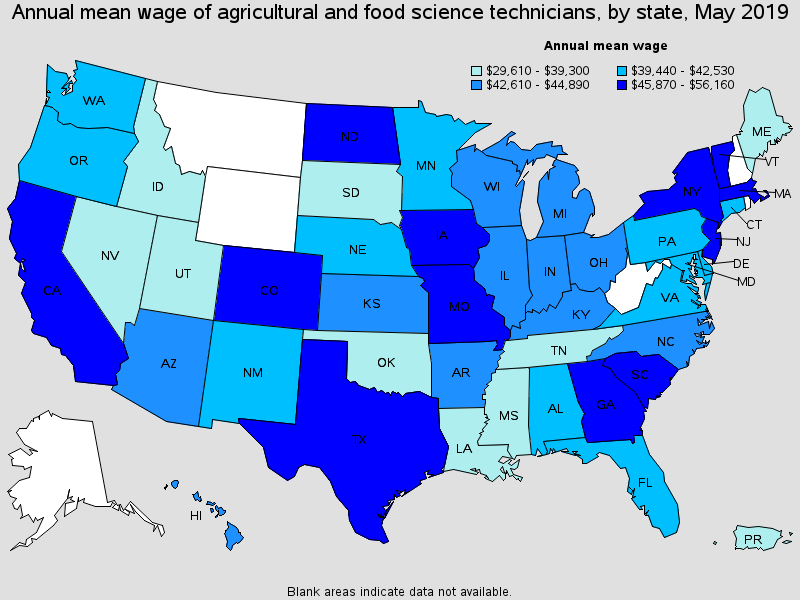
Top paying States for this occupation:
| State | Employment (1) | Employment per thousand jobs | Location quotient (9) | Hourly mean wage | Annual mean wage (2) |
|---|---|---|---|---|---|
| South Carolina | 40 | 0.02 | 0.13 | $27.00 | $56,160 |
| New York | 1,040 | 0.11 | 0.73 | $25.71 | $53,480 |
| Massachusetts | 390 | 0.11 | 0.72 | $25.56 | $53,160 |
| New Jersey | 470 | 0.12 | 0.78 | $24.35 | $50,650 |
| North Dakota | 110 | 0.25 | 1.68 | $23.03 | $47,890 |
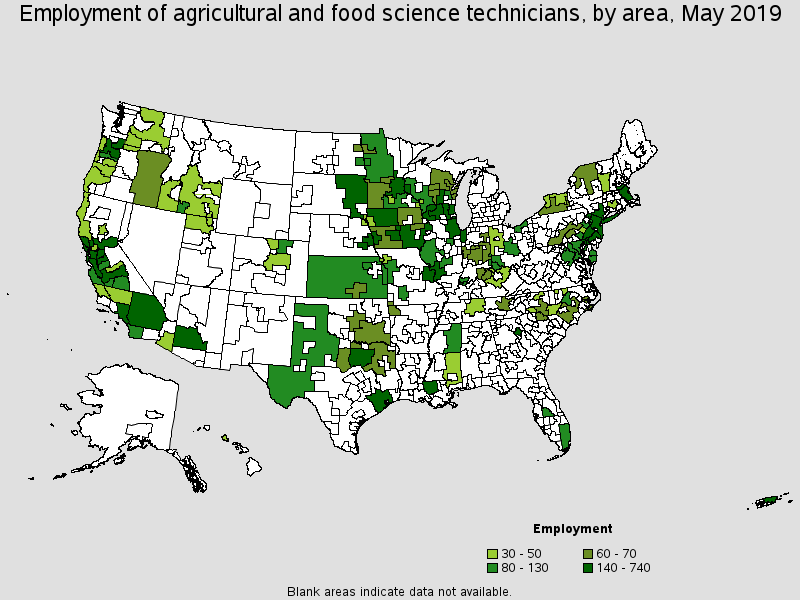
Metropolitan areas with the highest employment level in this occupation:
| Metropolitan area | Employment (1) | Employment per thousand jobs | Location quotient (9) | Hourly mean wage | Annual mean wage (2) |
|---|---|---|---|---|---|
| Sacramento--Roseville--Arden-Arcade, CA | 740 | 0.73 | 4.91 | $25.15 | $52,310 |
| Los Angeles-Long Beach-Anaheim, CA | 650 | 0.10 | 0.70 | $21.47 | $44,650 |
| San Jose-Sunnyvale-Santa Clara, CA | 490 | 0.43 | 2.86 | $25.64 | $53,330 |
| Dallas-Fort Worth-Arlington, TX | 400 | 0.11 | 0.74 | $22.08 | $45,920 |
| Chicago-Naperville-Elgin, IL-IN-WI | 390 | 0.08 | 0.57 | $22.97 | $47,770 |
| Portland-Vancouver-Hillsboro, OR-WA | 390 | 0.32 | 2.15 | $19.49 | $40,540 |
| New York-Newark-Jersey City, NY-NJ-PA | 360 | 0.04 | 0.25 | $23.21 | $48,280 |
| Lincoln, NE | 350 | 1.93 | 12.95 | $18.32 | $38,110 |
| Minneapolis-St. Paul-Bloomington, MN-WI | 350 | 0.18 | 1.18 | $20.25 | $42,120 |
| Boston-Cambridge-Nashua, MA-NH | 300 | 0.11 | 0.73 | $25.79 | $53,650 |
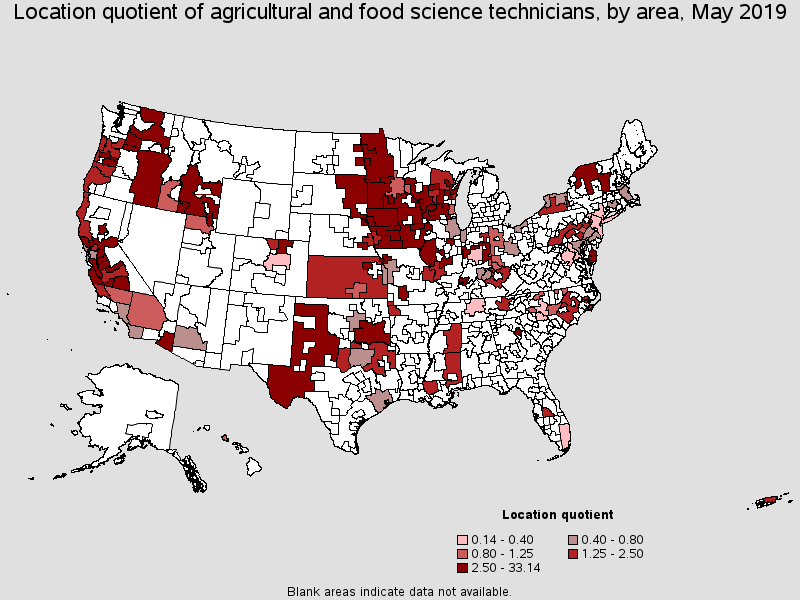
Metropolitan areas with the highest concentration of jobs and location quotients in this occupation:
| Metropolitan area | Employment (1) | Employment per thousand jobs | Location quotient (9) | Hourly mean wage | Annual mean wage (2) |
|---|---|---|---|---|---|
| Ames, IA | 220 | 4.94 | 33.14 | $19.95 | $41,500 |
| Athens-Clarke County, GA | 300 | 3.43 | 23.01 | $25.69 | $53,440 |
| Twin Falls, ID | 130 | 2.79 | 18.77 | $18.04 | $37,530 |
| Napa, CA | 210 | 2.77 | 18.60 | $22.02 | $45,800 |
| Manhattan, KS | 80 | 2.14 | 14.34 | $16.63 | $34,580 |
| Lincoln, NE | 350 | 1.93 | 12.95 | $18.32 | $38,110 |
| Hanford-Corcoran, CA | 80 | 1.77 | 11.91 | $20.38 | $42,390 |
| Grand Forks, ND-MN | 70 | 1.47 | 9.86 | $18.51 | $38,490 |
| Merced, CA | 110 | 1.46 | 9.78 | $25.14 | $52,280 |
| Modesto, CA | 240 | 1.31 | 8.80 | $19.05 | $39,620 |
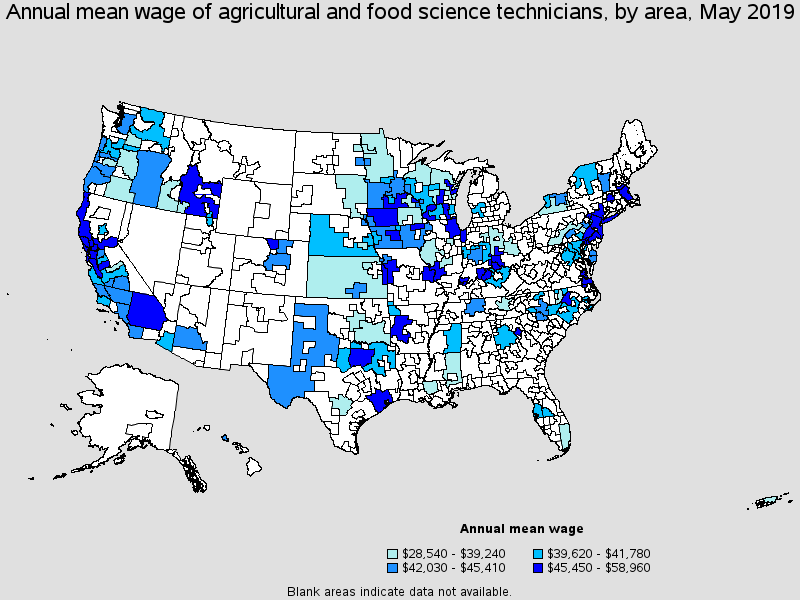
Top paying metropolitan areas for this occupation:
| Metropolitan area | Employment (1) | Employment per thousand jobs | Location quotient (9) | Hourly mean wage | Annual mean wage (2) |
|---|---|---|---|---|---|
| Louisville/Jefferson County, KY-IN | 60 | 0.10 | 0.66 | $28.35 | $58,960 |
| Des Moines-West Des Moines, IA | 160 | 0.44 | 2.96 | $27.46 | $57,120 |
| Kansas City, MO-KS | 110 | 0.10 | 0.70 | $26.61 | $55,340 |
| Raleigh, NC | 120 | 0.19 | 1.26 | $26.16 | $54,400 |
| Boston-Cambridge-Nashua, MA-NH | 300 | 0.11 | 0.73 | $25.79 | $53,650 |
| Athens-Clarke County, GA | 300 | 3.43 | 23.01 | $25.69 | $53,440 |
| San Jose-Sunnyvale-Santa Clara, CA | 490 | 0.43 | 2.86 | $25.64 | $53,330 |
| Houston-The Woodlands-Sugar Land, TX | 290 | 0.09 | 0.63 | $25.46 | $52,960 |
| Evansville, IN-KY | 80 | 0.51 | 3.41 | $25.16 | $52,330 |
| Sacramento--Roseville--Arden-Arcade, CA | 740 | 0.73 | 4.91 | $25.15 | $52,310 |
Nonmetropolitan areas with the highest employment in this occupation:
| Nonmetropolitan area | Employment (1) | Employment per thousand jobs | Location quotient (9) | Hourly mean wage | Annual mean wage (2) |
|---|---|---|---|---|---|
| Southeast Iowa nonmetropolitan area | 410 | 1.82 | 12.19 | $20.99 | $43,660 |
| South Central Wisconsin nonmetropolitan area | 230 | 1.11 | 7.43 | $24.23 | $50,390 |
| East South Dakota nonmetropolitan area | 230 | 1.71 | 11.48 | $13.72 | $28,540 |
| Northwest Iowa nonmetropolitan area | 140 | 1.05 | 7.07 | $25.28 | $52,570 |
| Western Wisconsin nonmetropolitan area | 130 | 0.91 | 6.11 | $19.87 | $41,330 |
Nonmetropolitan areas with the highest concentration of jobs and location quotients in this occupation:
| Nonmetropolitan area | Employment (1) | Employment per thousand jobs | Location quotient (9) | Hourly mean wage | Annual mean wage (2) |
|---|---|---|---|---|---|
| Southeast Iowa nonmetropolitan area | 410 | 1.82 | 12.19 | $20.99 | $43,660 |
| East South Dakota nonmetropolitan area | 230 | 1.71 | 11.48 | $13.72 | $28,540 |
| South Central Wisconsin nonmetropolitan area | 230 | 1.11 | 7.43 | $24.23 | $50,390 |
| Northwest Iowa nonmetropolitan area | 140 | 1.05 | 7.07 | $25.28 | $52,570 |
| Eastern Oregon nonmetropolitan area | 70 | 1.02 | 6.83 | $21.80 | $45,340 |
Top paying nonmetropolitan areas for this occupation:
| Nonmetropolitan area | Employment (1) | Employment per thousand jobs | Location quotient (9) | Hourly mean wage | Annual mean wage (2) |
|---|---|---|---|---|---|
| Northwest Iowa nonmetropolitan area | 140 | 1.05 | 7.07 | $25.28 | $52,570 |
| South Central Wisconsin nonmetropolitan area | 230 | 1.11 | 7.43 | $24.23 | $50,390 |
| West Arkansas nonmetropolitan area | (8) | (8) | (8) | $23.92 | $49,750 |
| Southeast-Central Idaho nonmetropolitan area | 50 | 0.55 | 3.70 | $23.55 | $48,980 |
| North Coast Region of California nonmetropolitan area | 40 | 0.33 | 2.23 | $22.18 | $46,140 |
These estimates are calculated with data collected from employers in all industry sectors, all metropolitan and nonmetropolitan areas, and all states and the District of Columbia. The top employment and wage figures are provided above. The complete list is available in the downloadable XLS files.
The percentile wage estimate is the value of a wage below which a certain percent of workers fall. The median wage is the 50th percentile wage estimate--50 percent of workers earn less than the median and 50 percent of workers earn more than the median. More about percentile wages.
(1) Estimates for detailed occupations do not sum to the totals because the totals include occupations not shown separately. Estimates do not include self-employed workers.
(2) Annual wages have been calculated by multiplying the hourly mean wage by a "year-round, full-time" hours figure of 2,080 hours; for those occupations where there is not an hourly wage published, the annual wage has been directly calculated from the reported survey data.
(3) The relative standard error (RSE) is a measure of the reliability of a survey statistic. The smaller the relative standard error, the more precise the estimate.
(8) Estimate not released.
(9) The location quotient is the ratio of the area concentration of occupational employment to the national average concentration. A location quotient greater than one indicates the occupation has a higher share of employment than average, and a location quotient less than one indicates the occupation is less prevalent in the area than average.
Other OES estimates and related information:
May 2019 National Occupational Employment and Wage Estimates
May 2019 State Occupational Employment and Wage Estimates
May 2019 Metropolitan and Nonmetropolitan Area Occupational Employment and Wage Estimates
May 2019 National Industry-Specific Occupational Employment and Wage Estimates
Last Modified Date: July 6, 2020