
An official website of the United States government
An official website of the United States government
The .gov means it's official.
Federal government websites often end in .gov or .mil. Before sharing sensitive information,
make sure you're on a federal government site.
The site is secure.
The
https:// ensures that you are connecting to the official website and that any
information you provide is encrypted and transmitted securely.
Teach courses in health specialties, in fields such as dentistry, laboratory technology, medicine, pharmacy, public health, therapy, and veterinary medicine. Excludes �Biological Science Teachers, Postsecondary� (25-1042) and �Nursing Instructors and Teachers, Postsecondary� (25-1072) who teach medical science.
Employment estimate and mean wage estimates for this occupation:
| Employment (1) | Employment RSE (3) |
Mean hourly wage |
Mean annual wage (2) |
Mean wage RSE (3) |
|---|---|---|---|---|
| 201,920 | 2.9 % | (4) | $121,620 | 2.3 % |
Percentile wage estimates for this occupation:
| Percentile | 10% | 25% | 50% (Median) |
75% | 90% |
|---|---|---|---|---|---|
| Annual Wage (2) | $44,350 | $62,350 | $97,320 | $159,950 | (5) |
Industries with the highest published employment and wages for this occupation are provided. For a list of all industries with employment in this occupation, see the Create Customized Tables function.
Industries with the highest levels of employment in this occupation:
| Industry | Employment (1) | Percent of industry employment | Hourly mean wage | Annual mean wage (2) |
|---|---|---|---|---|
| Colleges, Universities, and Professional Schools | 166,350 | 5.39 | (4) | $126,510 |
| Junior Colleges | 21,060 | 2.95 | (4) | $76,630 |
| General Medical and Surgical Hospitals | 9,020 | 0.16 | (4) | $154,600 |
| Technical and Trade Schools | 2,650 | 1.96 | (4) | $60,040 |
| Offices of Physicians | 460 | 0.02 | (4) | $96,420 |
Industries with the highest concentration of employment in this occupation:
| Industry | Employment (1) | Percent of industry employment | Hourly mean wage | Annual mean wage (2) |
|---|---|---|---|---|
| Colleges, Universities, and Professional Schools | 166,350 | 5.39 | (4) | $126,510 |
| Junior Colleges | 21,060 | 2.95 | (4) | $76,630 |
| Technical and Trade Schools | 2,650 | 1.96 | (4) | $60,040 |
| Business Schools and Computer and Management Training | 260 | 0.36 | (4) | $83,030 |
| General Medical and Surgical Hospitals | 9,020 | 0.16 | (4) | $154,600 |
Top paying industries for this occupation:
| Industry | Employment (1) | Percent of industry employment | Hourly mean wage | Annual mean wage (2) |
|---|---|---|---|---|
| General Medical and Surgical Hospitals | 9,020 | 0.16 | (4) | $154,600 |
| Specialty (except Psychiatric and Substance Abuse) Hospitals | (8) | (8) | (4) | $139,510 |
| Colleges, Universities, and Professional Schools | 166,350 | 5.39 | (4) | $126,510 |
| Offices of Physicians | 460 | 0.02 | (4) | $96,420 |
| Business Schools and Computer and Management Training | 260 | 0.36 | (4) | $83,030 |
States and areas with the highest published employment, location quotients, and wages for this occupation are provided. For a list of all areas with employment in this occupation, see the Create Customized Tables function.
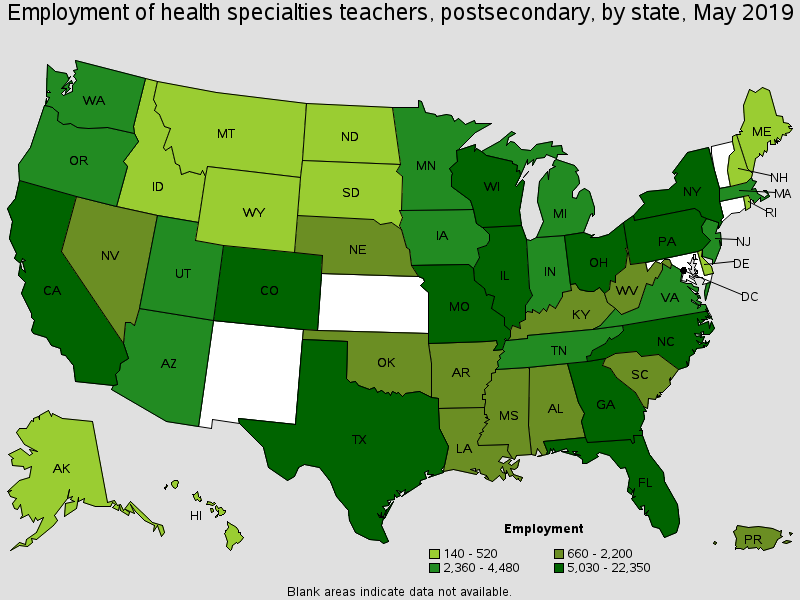
States with the highest employment level in this occupation:
| State | Employment (1) | Employment per thousand jobs | Location quotient (9) | Hourly mean wage | Annual mean wage (2) |
|---|---|---|---|---|---|
| New York | 22,350 | 2.35 | 1.71 | (4) | $130,330 |
| Texas | 17,920 | 1.44 | 1.05 | (4) | $146,000 |
| Pennsylvania | 15,130 | 2.56 | 1.86 | (4) | $99,200 |
| North Carolina | 11,770 | 2.64 | 1.92 | (4) | $140,740 |
| Ohio | 10,560 | 1.94 | 1.41 | (4) | $128,960 |
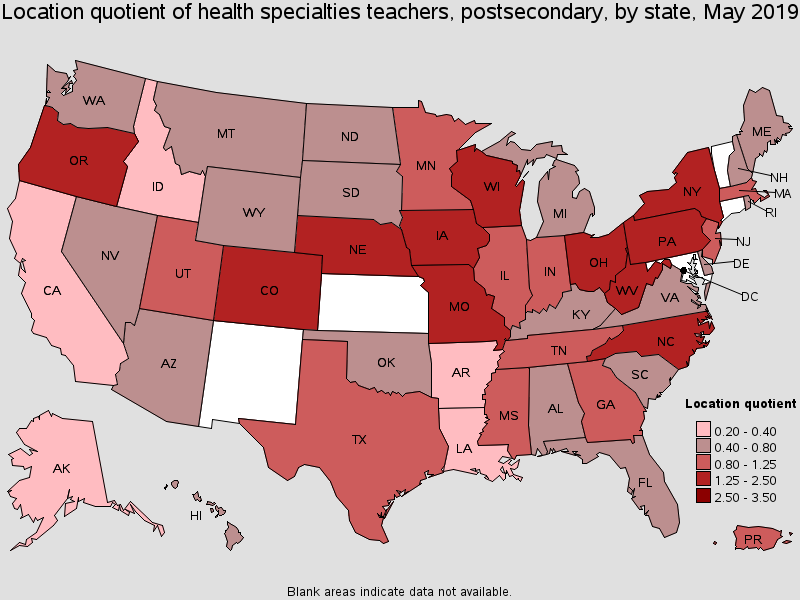
States with the highest concentration of jobs and location quotients in this occupation:
| State | Employment (1) | Employment per thousand jobs | Location quotient (9) | Hourly mean wage | Annual mean wage (2) |
|---|---|---|---|---|---|
| North Carolina | 11,770 | 2.64 | 1.92 | (4) | $140,740 |
| Pennsylvania | 15,130 | 2.56 | 1.86 | (4) | $99,200 |
| West Virginia | 1,730 | 2.47 | 1.79 | (4) | $68,330 |
| New York | 22,350 | 2.35 | 1.71 | (4) | $130,330 |
| Wisconsin | 6,560 | 2.29 | 1.66 | (4) | $78,020 |
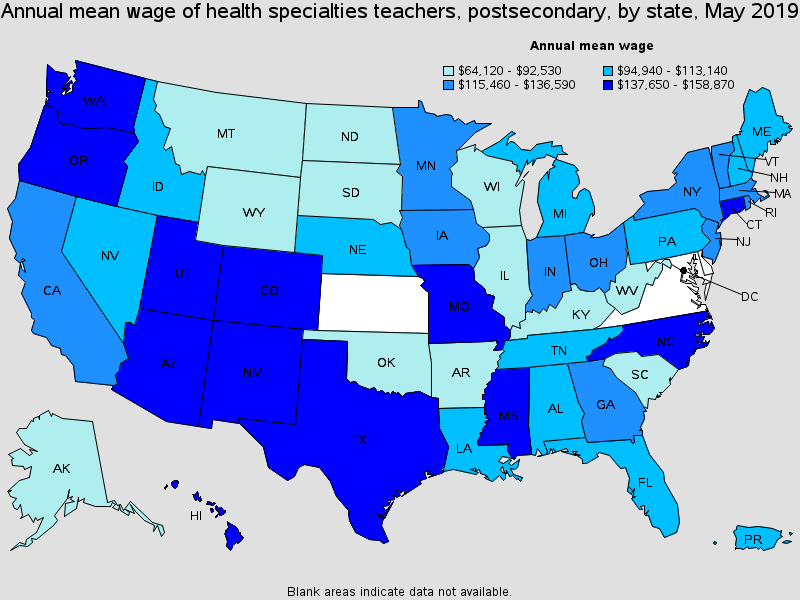
Top paying States for this occupation:
| State | Employment (1) | Employment per thousand jobs | Location quotient (9) | Hourly mean wage | Annual mean wage (2) |
|---|---|---|---|---|---|
| Washington | 2,540 | 0.76 | 0.56 | (4) | $158,870 |
| New Mexico | (8) | (8) | (8) | (4) | $150,480 |
| Mississippi | 1,720 | 1.52 | 1.11 | (4) | $150,240 |
| Oregon | 3,640 | 1.91 | 1.39 | (4) | $147,880 |
| Colorado | 5,830 | 2.18 | 1.58 | (4) | $147,460 |
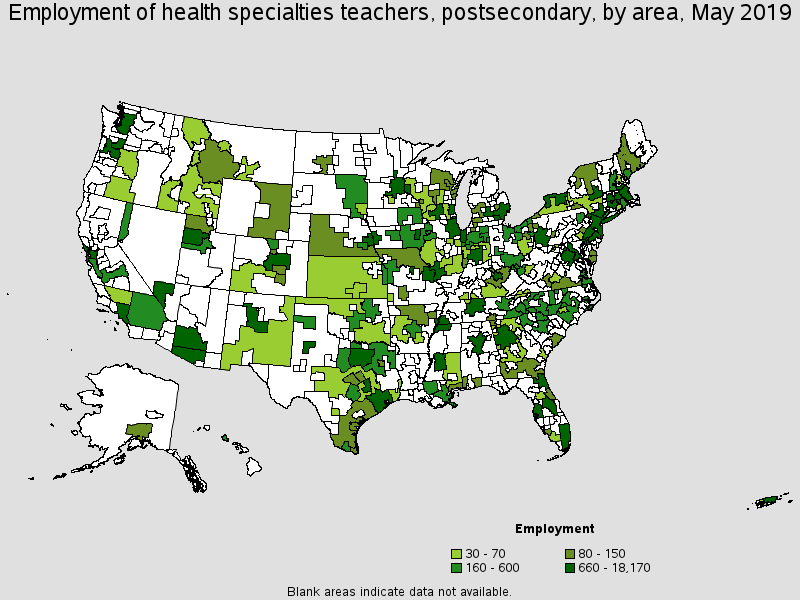
Metropolitan areas with the highest employment level in this occupation:
| Metropolitan area | Employment (1) | Employment per thousand jobs | Location quotient (9) | Hourly mean wage | Annual mean wage (2) |
|---|---|---|---|---|---|
| New York-Newark-Jersey City, NY-NJ-PA | 18,170 | 1.88 | 1.37 | (4) | $129,440 |
| Philadelphia-Camden-Wilmington, PA-NJ-DE-MD | 9,790 | 3.40 | 2.48 | (4) | $104,510 |
| Chicago-Naperville-Elgin, IL-IN-WI | 8,250 | 1.76 | 1.28 | (4) | $91,600 |
| Houston-The Woodlands-Sugar Land, TX | 6,160 | 2.02 | 1.47 | (4) | $180,310 |
| Denver-Aurora-Lakewood, CO | 4,860 | 3.21 | 2.34 | (8) | (8) |
| Dallas-Fort Worth-Arlington, TX | 4,670 | 1.28 | 0.93 | (4) | $162,140 |
| Pittsburgh, PA | 4,490 | 3.89 | 2.83 | (4) | $94,120 |
| St. Louis, MO-IL | 4,310 | 3.14 | 2.29 | (4) | $133,090 |
| Atlanta-Sandy Springs-Roswell, GA | 3,960 | 1.44 | 1.05 | (8) | (8) |
| Miami-Fort Lauderdale-West Palm Beach, FL | 3,930 | 1.49 | 1.08 | (4) | $84,240 |
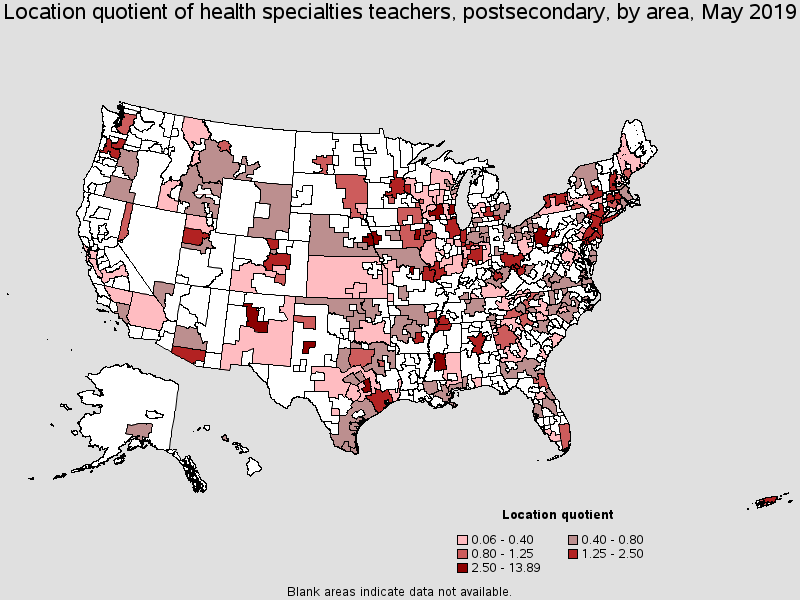
Metropolitan areas with the highest concentration of jobs and location quotients in this occupation:
| Metropolitan area | Employment (1) | Employment per thousand jobs | Location quotient (9) | Hourly mean wage | Annual mean wage (2) |
|---|---|---|---|---|---|
| Iowa City, IA | 1,750 | 19.10 | 13.89 | (8) | (8) |
| Columbia, MO | 790 | 8.38 | 6.10 | (8) | (8) |
| Madison, WI | 2,860 | 7.23 | 5.26 | (4) | $79,520 |
| College Station-Bryan, TX | 660 | 5.85 | 4.26 | (4) | $108,560 |
| Lubbock, TX | 760 | 5.23 | 3.81 | (4) | $124,110 |
| Jackson, MS | 1,120 | 4.21 | 3.06 | (4) | $185,500 |
| Pittsburgh, PA | 4,490 | 3.89 | 2.83 | (4) | $94,120 |
| Omaha-Council Bluffs, NE-IA | 1,780 | 3.60 | 2.62 | (4) | $96,610 |
| Albuquerque, NM | 1,380 | 3.53 | 2.57 | (4) | $156,100 |
| Milwaukee-Waukesha-West Allis, WI | 2,980 | 3.48 | 2.53 | (8) | (8) |
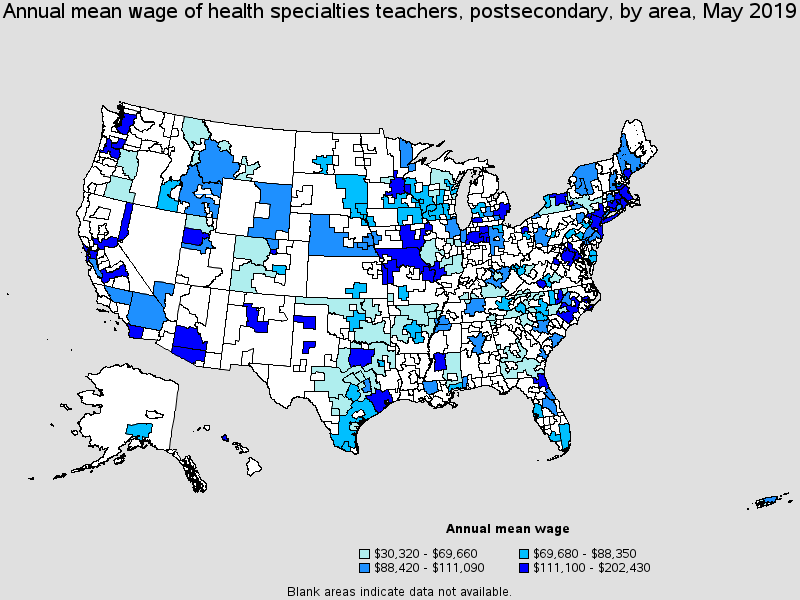
Top paying metropolitan areas for this occupation:
| Metropolitan area | Employment (1) | Employment per thousand jobs | Location quotient (9) | Hourly mean wage | Annual mean wage (2) |
|---|---|---|---|---|---|
| Jacksonville, FL | 840 | 1.20 | 0.87 | (4) | $202,430 |
| Jackson, MS | 1,120 | 4.21 | 3.06 | (4) | $185,500 |
| Kalamazoo-Portage, MI | 150 | 1.04 | 0.76 | (4) | $184,130 |
| Houston-The Woodlands-Sugar Land, TX | 6,160 | 2.02 | 1.47 | (4) | $180,310 |
| Hartford-West Hartford-East Hartford, CT | 800 | 1.38 | 1.00 | (4) | $176,460 |
| Rochester, NY | 1,770 | 3.42 | 2.48 | (4) | $169,340 |
| Dallas-Fort Worth-Arlington, TX | 4,670 | 1.28 | 0.93 | (4) | $162,140 |
| Seattle-Tacoma-Bellevue, WA | 2,380 | 1.18 | 0.86 | (4) | $161,910 |
| Salt Lake City, UT | 1,890 | 2.57 | 1.87 | (4) | $159,870 |
| Portland-Vancouver-Hillsboro, OR-WA | 3,240 | 2.68 | 1.95 | (4) | $156,390 |
Nonmetropolitan areas with the highest employment in this occupation:
| Nonmetropolitan area | Employment (1) | Employment per thousand jobs | Location quotient (9) | Hourly mean wage | Annual mean wage (2) |
|---|---|---|---|---|---|
| Southeast Iowa nonmetropolitan area | 320 | 1.42 | 1.04 | (4) | $121,540 |
| Southern Ohio non-metropolitan area | 290 | 1.84 | 1.34 | (8) | (8) |
| West Central-Southwest New Hampshire nonmetropolitan area | 220 | 2.17 | 1.58 | (4) | $111,090 |
| Piedmont North Carolina nonmetropolitan area | 190 | 0.74 | 0.54 | (4) | $57,600 |
| North Texas Region of Texas nonmetropolitan area | 190 | 0.69 | 0.50 | (4) | $56,680 |
Nonmetropolitan areas with the highest concentration of jobs and location quotients in this occupation:
| Nonmetropolitan area | Employment (1) | Employment per thousand jobs | Location quotient (9) | Hourly mean wage | Annual mean wage (2) |
|---|---|---|---|---|---|
| West Central-Southwest New Hampshire nonmetropolitan area | 220 | 2.17 | 1.58 | (4) | $111,090 |
| Southern Ohio non-metropolitan area | 290 | 1.84 | 1.34 | (8) | (8) |
| Northeast Iowa nonmetropolitan area | 170 | 1.63 | 1.19 | (4) | $81,870 |
| Southeast Iowa nonmetropolitan area | 320 | 1.42 | 1.04 | (4) | $121,540 |
| East South Dakota nonmetropolitan area | 170 | 1.32 | 0.96 | (4) | $87,320 |
Top paying nonmetropolitan areas for this occupation:
| Nonmetropolitan area | Employment (1) | Employment per thousand jobs | Location quotient (9) | Hourly mean wage | Annual mean wage (2) |
|---|---|---|---|---|---|
| Northern Indiana nonmetropolitan area | 160 | 0.73 | 0.53 | (4) | $129,020 |
| Southeast Iowa nonmetropolitan area | 320 | 1.42 | 1.04 | (4) | $121,540 |
| North Missouri nonmetropolitan area | 80 | 0.75 | 0.55 | (4) | $115,000 |
| Southeast Coastal North Carolina nonmetropolitan area | 190 | 0.76 | 0.55 | (4) | $111,730 |
| West Central-Southwest New Hampshire nonmetropolitan area | 220 | 2.17 | 1.58 | (4) | $111,090 |
These estimates are calculated with data collected from employers in all industry sectors, all metropolitan and nonmetropolitan areas, and all states and the District of Columbia. The top employment and wage figures are provided above. The complete list is available in the downloadable XLS files.
The percentile wage estimate is the value of a wage below which a certain percent of workers fall. The median wage is the 50th percentile wage estimate--50 percent of workers earn less than the median and 50 percent of workers earn more than the median. More about percentile wages.
(1) Estimates for detailed occupations do not sum to the totals because the totals include occupations not shown separately. Estimates do not include self-employed workers.
(2) Annual wages have been calculated by multiplying the hourly mean wage by a "year-round, full-time" hours figure of 2,080 hours; for those occupations where there is not an hourly wage published, the annual wage has been directly calculated from the reported survey data.
(3) The relative standard error (RSE) is a measure of the reliability of a survey statistic. The smaller the relative standard error, the more precise the estimate.
(4) Wages for some occupations that do not generally work year-round, full time, are reported either as hourly wages or annual salaries depending on how they are typically paid.
(5) This wage is equal to or greater than $100.00 per hour or $208,000 per year.
(8) Estimate not released.
(9) The location quotient is the ratio of the area concentration of occupational employment to the national average concentration. A location quotient greater than one indicates the occupation has a higher share of employment than average, and a location quotient less than one indicates the occupation is less prevalent in the area than average.
Other OES estimates and related information:
May 2019 National Occupational Employment and Wage Estimates
May 2019 State Occupational Employment and Wage Estimates
May 2019 Metropolitan and Nonmetropolitan Area Occupational Employment and Wage Estimates
May 2019 National Industry-Specific Occupational Employment and Wage Estimates
Last Modified Date: July 6, 2020