
An official website of the United States government
An official website of the United States government
The .gov means it's official.
Federal government websites often end in .gov or .mil. Before sharing sensitive information,
make sure you're on a federal government site.
The site is secure.
The
https:// ensures that you are connecting to the official website and that any
information you provide is encrypted and transmitted securely.
Teach or instruct out-of-school youths and adults in basic education, literacy, or English as a Second Language classes, or in classes for earning a high school equivalency credential.
Employment estimate and mean wage estimates for this occupation:
| Employment (1) | Employment RSE (3) |
Mean hourly wage |
Mean annual wage (2) |
Wage RSE (3) |
|---|---|---|---|---|
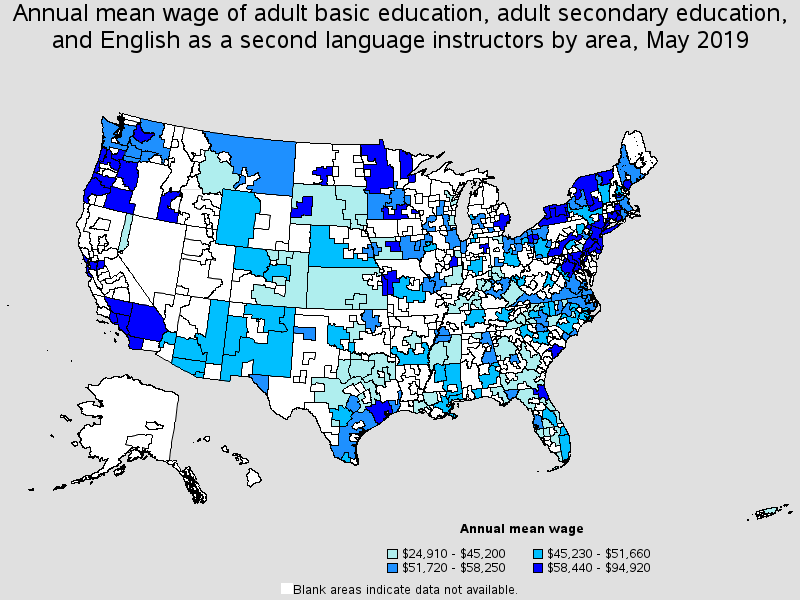
| 51,950 | 7.7 % | $28.36 | $58,980 | 1.7 % |
Percentile wage estimates for this occupation:
| Percentile | 10% | 25% | 50% (Median) |
75% | 90% |
|---|---|---|---|---|---|
| Hourly Wage | $15.66 | $20.50 | $26.13 | $34.47 | $45.08 |
| Annual Wage (2) | $32,580 | $42,640 | $54,350 | $71,700 | $93,760 |
Industries with the highest published employment and wages for this occupation are provided. For a list of all industries with employment in this occupation, see the Create Customized Tables function.
Industries with the highest levels of employment in this occupation:
| Industry | Employment (1) | Percent of industry employment | Hourly mean wage | Annual mean wage (2) |
|---|---|---|---|---|
| Elementary and Secondary Schools | 21,390 | 0.25 | $31.41 | $65,340 |
| Junior Colleges | 12,790 | 1.79 | $28.97 | $60,270 |
| Other Schools and Instruction | 5,240 | 1.13 | $23.27 | $48,400 |
| State Government, excluding schools and hospitals (OES Designation) | 2,350 | 0.11 | $28.93 | $60,180 |
| Colleges, Universities, and Professional Schools | 2,320 | 0.08 | $24.06 | $50,040 |
Industries with the highest concentration of employment in this occupation:
| Industry | Employment (1) | Percent of industry employment | Hourly mean wage | Annual mean wage (2) |
|---|---|---|---|---|
| Junior Colleges | 12,790 | 1.79 | $28.97 | $60,270 |
| Other Schools and Instruction | 5,240 | 1.13 | $23.27 | $48,400 |
| Technical and Trade Schools | 660 | 0.49 | $23.67 | $49,230 |
| Vocational Rehabilitation Services | 1,030 | 0.32 | $21.67 | $45,080 |
| Elementary and Secondary Schools | 21,390 | 0.25 | $31.41 | $65,340 |
Top paying industries for this occupation:
| Industry | Employment (1) | Percent of industry employment | Hourly mean wage | Annual mean wage (2) |
|---|---|---|---|---|
| Other Information Services | 280 | 0.09 | $41.00 | $85,270 |
| Religious Organizations | 80 | 0.04 | $32.71 | $68,030 |
| Elementary and Secondary Schools | 21,390 | 0.25 | $31.41 | $65,340 |
| Junior Colleges | 12,790 | 1.79 | $28.97 | $60,270 |
| State Government, excluding schools and hospitals (OES Designation) | 2,350 | 0.11 | $28.93 | $60,180 |
States and areas with the highest published employment, location quotients, and wages for this occupation are provided. For a list of all areas with employment in this occupation, see the Create Customized Tables function.
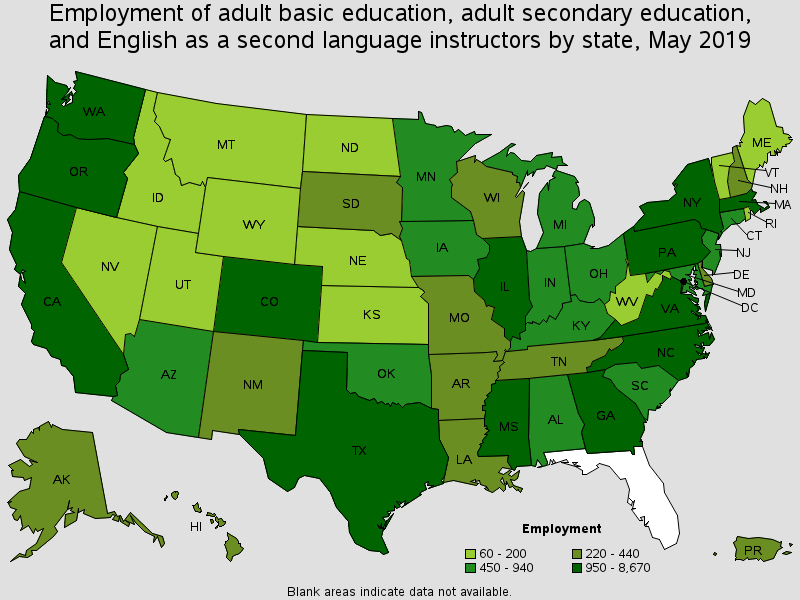
States with the highest employment level in this occupation:
| State | Employment (1) | Employment per thousand jobs | Location quotient (9) | Hourly mean wage | Annual mean wage (2) |
|---|---|---|---|---|---|
| California | 8,670 | 0.50 | 1.41 | $41.16 | $85,600 |
| New York | 3,650 | 0.38 | 1.08 | $34.32 | $71,390 |
| Texas | 3,650 | 0.29 | 0.83 | $25.35 | $52,730 |
| North Carolina | 3,600 | 0.81 | 2.28 | $23.53 | $48,940 |
| Washington | 2,150 | 0.65 | 1.84 | $26.68 | $55,480 |
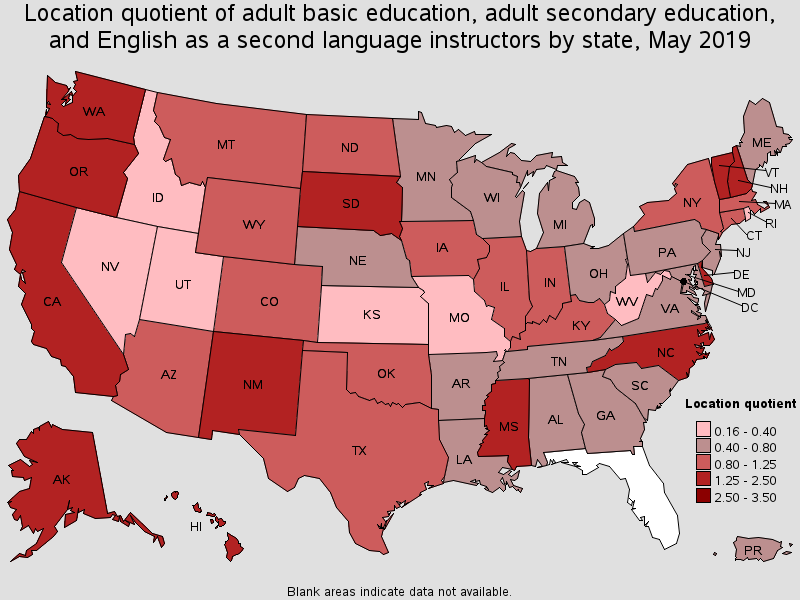
States with the highest concentration of jobs and location quotients in this occupation:
| State | Employment (1) | Employment per thousand jobs | Location quotient (9) | Hourly mean wage | Annual mean wage (2) |
|---|---|---|---|---|---|
| Mississippi | 950 | 0.84 | 2.39 | $22.16 | $46,090 |
| South Dakota | 350 | 0.83 | 2.34 | $17.68 | $36,770 |
| North Carolina | 3,600 | 0.81 | 2.28 | $23.53 | $48,940 |
| Alaska | 240 | 0.75 | 2.12 | $25.70 | $53,460 |
| Vermont | 200 | 0.66 | 1.86 | $27.16 | $56,500 |
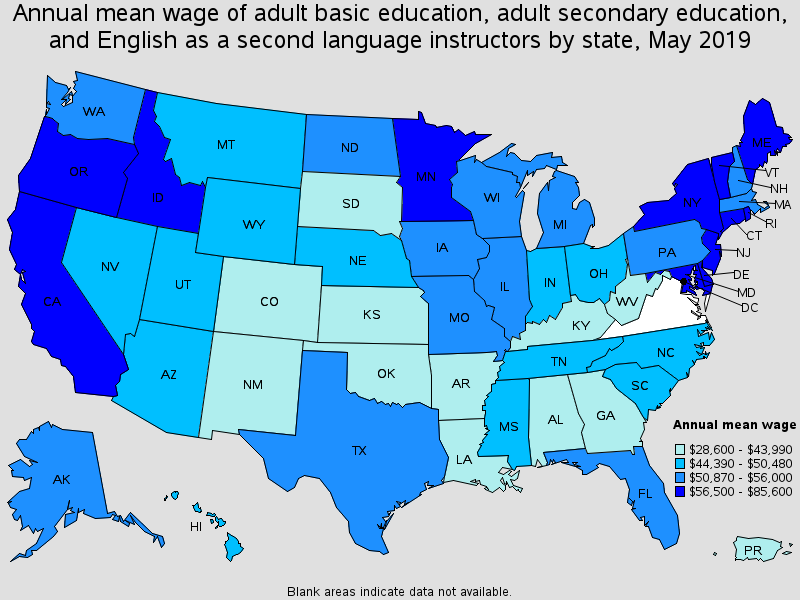
Top paying States for this occupation:
| State | Employment (1) | Employment per thousand jobs | Location quotient (9) | Hourly mean wage | Annual mean wage (2) |
|---|---|---|---|---|---|
| California | 8,670 | 0.50 | 1.41 | $41.16 | $85,600 |
| New York | 3,650 | 0.38 | 1.08 | $34.32 | $71,390 |
| New Jersey | 940 | 0.23 | 0.65 | $33.93 | $70,570 |
| Connecticut | 520 | 0.31 | 0.89 | $31.99 | $66,530 |
| Oregon | 1,000 | 0.52 | 1.48 | $31.18 | $64,850 |
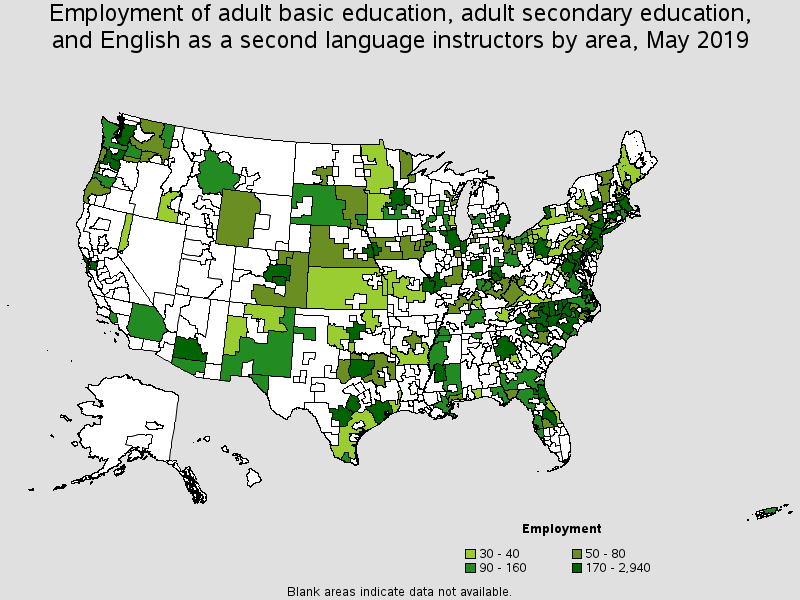
Metropolitan areas with the highest employment level in this occupation:
| Metropolitan area | Employment (1) | Employment per thousand jobs | Location quotient (9) | Hourly mean wage | Annual mean wage (2) |
|---|---|---|---|---|---|
| New York-Newark-Jersey City, NY-NJ-PA | 2,940 | 0.30 | 0.86 | $35.31 | $73,440 |
| San Francisco-Oakland-Hayward, CA | 1,690 | 0.68 | 1.94 | $45.64 | $94,920 |
| Seattle-Tacoma-Bellevue, WA | 1,230 | 0.61 | 1.73 | $26.54 | $55,200 |
| Chicago-Naperville-Elgin, IL-IN-WI | 1,170 | 0.25 | 0.71 | $28.01 | $58,250 |
| Boston-Cambridge-Nashua, MA-NH | 1,160 | 0.42 | 1.17 | $25.31 | $52,650 |
| Washington-Arlington-Alexandria, DC-VA-MD-WV | 1,120 | 0.35 | 1.00 | $30.87 | $64,210 |
| Houston-The Woodlands-Sugar Land, TX | 1,040 | 0.34 | 0.96 | $32.08 | $66,730 |
| Philadelphia-Camden-Wilmington, PA-NJ-DE-MD | 930 | 0.32 | 0.92 | $28.19 | $58,630 |
| Dallas-Fort Worth-Arlington, TX | 890 | 0.24 | 0.69 | $19.53 | $40,610 |
| Portland-Vancouver-Hillsboro, OR-WA | 740 | 0.61 | 1.74 | $30.38 | $63,190 |
Metropolitan areas with the highest concentration of jobs and location quotients in this occupation:
| Metropolitan area | Employment (1) | Employment per thousand jobs | Location quotient (9) | Hourly mean wage | Annual mean wage (2) |
|---|---|---|---|---|---|
| Goldsboro, NC | 100 | 2.28 | 6.44 | $21.31 | $44,330 |
| Asheville, NC | 350 | 1.75 | 4.94 | $21.60 | $44,920 |
| Yakima, WA | 150 | 1.58 | 4.48 | $26.11 | $54,310 |
| Jackson, MS | 380 | 1.45 | 4.09 | $22.52 | $46,840 |
| Muskegon, MI | 70 | 1.18 | 3.34 | $22.25 | $46,280 |
| Rockford, IL | 170 | 1.15 | 3.24 | (8) | (8) |
| New Bern, NC | 50 | 1.11 | 3.14 | $23.43 | $48,740 |
| Winston-Salem, NC | 290 | 1.09 | 3.08 | $21.74 | $45,230 |
| Rocky Mount, NC | 50 | 0.95 | 2.70 | $24.09 | $50,110 |
| Eugene, OR | 140 | 0.92 | 2.59 | $32.12 | $66,820 |
Top paying metropolitan areas for this occupation:
| Metropolitan area | Employment (1) | Employment per thousand jobs | Location quotient (9) | Hourly mean wage | Annual mean wage (2) |
|---|---|---|---|---|---|
| San Francisco-Oakland-Hayward, CA | 1,690 | 0.68 | 1.94 | $45.64 | $94,920 |
| Riverside-San Bernardino-Ontario, CA | 120 | 0.08 | 0.22 | $44.41 | $92,360 |
| Los Angeles-Long Beach-Anaheim, CA | (8) | (8) | (8) | $43.27 | $90,000 |
| Oxnard-Thousand Oaks-Ventura, CA | 140 | 0.44 | 1.26 | $39.79 | $82,760 |
| San Diego-Carlsbad, CA | (8) | (8) | (8) | $39.34 | $81,830 |
| Stockton-Lodi, CA | (8) | (8) | (8) | $36.51 | $75,940 |
| Kansas City, MO-KS | 30 | 0.03 | 0.09 | $36.32 | $75,540 |
| Bakersfield, CA | (8) | (8) | (8) | $36.17 | $75,240 |
| Duluth, MN-WI | 50 | 0.38 | 1.08 | $35.46 | $73,750 |
| Buffalo-Cheektowaga-Niagara Falls, NY | 250 | 0.46 | 1.30 | $35.31 | $73,450 |
Nonmetropolitan areas with the highest employment in this occupation:
| Nonmetropolitan area | Employment (1) | Employment per thousand jobs | Location quotient (9) | Hourly mean wage | Annual mean wage (2) |
|---|---|---|---|---|---|
| Southeast Coastal North Carolina nonmetropolitan area | 450 | 1.80 | 5.10 | $22.42 | $46,640 |
| Piedmont North Carolina nonmetropolitan area | 350 | 1.36 | 3.85 | $21.73 | $45,200 |
| Northeast Coastal North Carolina nonmetropolitan area | 150 | 1.55 | 4.37 | $26.32 | $54,740 |
| North Florida nonmetropolitan area | 140 | 1.13 | 3.20 | $17.78 | $36,980 |
| Eastern New Mexico nonmetropolitan area | 120 | 0.74 | 2.10 | $23.51 | $48,900 |
Nonmetropolitan areas with the highest concentration of jobs and location quotients in this occupation:
| Nonmetropolitan area | Employment (1) | Employment per thousand jobs | Location quotient (9) | Hourly mean wage | Annual mean wage (2) |
|---|---|---|---|---|---|
| West South Dakota nonmetropolitan area | 120 | 1.96 | 5.54 | $16.82 | $34,990 |
| Southeast Coastal North Carolina nonmetropolitan area | 450 | 1.80 | 5.10 | $22.42 | $46,640 |
| Northeast Coastal North Carolina nonmetropolitan area | 150 | 1.55 | 4.37 | $26.32 | $54,740 |
| Piedmont North Carolina nonmetropolitan area | 350 | 1.36 | 3.85 | $21.73 | $45,200 |
| North Florida nonmetropolitan area | 140 | 1.13 | 3.20 | $17.78 | $36,980 |
Top paying nonmetropolitan areas for this occupation:
| Nonmetropolitan area | Employment (1) | Employment per thousand jobs | Location quotient (9) | Hourly mean wage | Annual mean wage (2) |
|---|---|---|---|---|---|
| Southern Pennsylvania nonmetropolitan area | 40 | 0.19 | 0.55 | $35.28 | $73,390 |
| Central Oregon nonmetropolitan area | (8) | (8) | (8) | $35.12 | $73,040 |
| Coast Oregon nonmetropolitan area | 60 | 0.54 | 1.53 | $33.69 | $70,070 |
| Southwest New York nonmetropolitan area | 40 | 0.21 | 0.59 | $30.75 | $63,960 |
| Northwest Minnesota nonmetropolitan area | 30 | 0.18 | 0.51 | $29.97 | $62,330 |
These estimates are calculated with data collected from employers in all industry sectors, all metropolitan and nonmetropolitan areas, and all states and the District of Columbia. The top employment and wage figures are provided above. The complete list is available in the downloadable XLS files.
The percentile wage estimate is the value of a wage below which a certain percent of workers fall. The median wage is the 50th percentile wage estimate--50 percent of workers earn less than the median and 50 percent of workers earn more than the median. More about percentile wages.
(1) Estimates for detailed occupations do not sum to the totals because the totals include occupations not shown separately. Estimates do not include self-employed workers.
(2) Annual wages have been calculated by multiplying the hourly mean wage by a "year-round, full-time" hours figure of 2,080 hours; for those occupations where there is not an hourly wage published, the annual wage has been directly calculated from the reported survey data.
(3) The relative standard error (RSE) is a measure of the reliability of a survey statistic. The smaller the relative standard error, the more precise the estimate.
(8) Estimate not released.
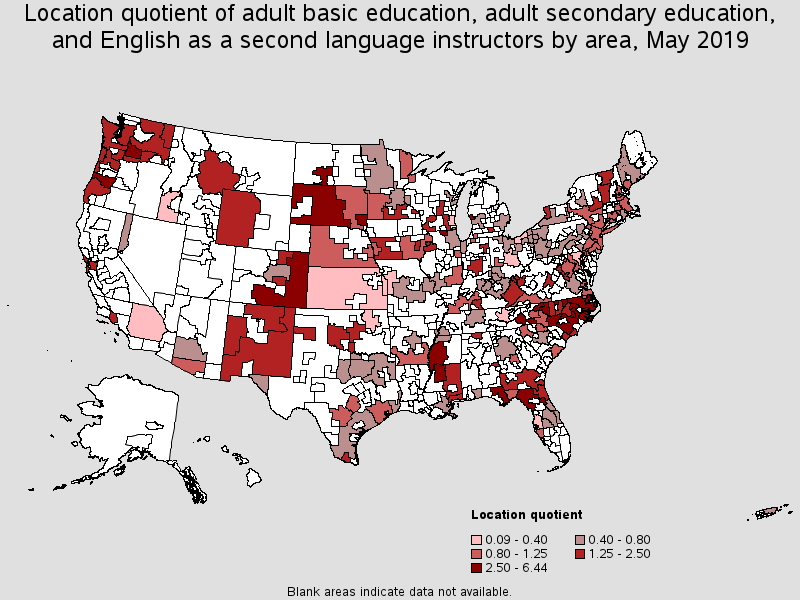
(9) The location quotient is the ratio of the area concentration of occupational employment to the national average concentration. A location quotient greater than one indicates the occupation has a higher share of employment than average, and a location quotient less than one indicates the occupation is less prevalent in the area than average.
Other OES estimates and related information:
May 2019 National Occupational Employment and Wage Estimates
May 2019 State Occupational Employment and Wage Estimates
May 2019 Metropolitan and Nonmetropolitan Area Occupational Employment and Wage Estimates
May 2019 National Industry-Specific Occupational Employment and Wage Estimates
Last Modified Date: July 6, 2020