An official website of the United States government
 United States Department of Labor
Design, cut, and arrange live, dried, or artificial flowers and foliage.
Employment estimate and mean wage estimates for this occupation:
| Employment (1) | Employment RSE (3) |
Mean hourly wage |
Mean annual wage (2) |
Wage RSE (3) |
|---|---|---|---|---|
| 41,770 | 2.4 % | $14.31 | $29,760 | 0.8 % |
Percentile wage estimates for this occupation:
| Percentile | 10% | 25% | 50% (Median) |
75% | 90% |
|---|---|---|---|---|---|
| Hourly Wage | $9.47 | $11.19 | $13.48 | $16.76 | $19.90 |
| Annual Wage (2) | $19,710 | $23,280 | $28,040 | $34,870 | $41,400 |
Industries with the highest published employment and wages for this occupation are provided. For a list of all industries with employment in this occupation, see the Create Customized Tables function.
Industries with the highest levels of employment in this occupation:
| Industry | Employment (1) | Percent of industry employment | Hourly mean wage | Annual mean wage (2) |
|---|---|---|---|---|
| Florists | 28,100 | 45.49 | $14.12 | $29,370 |
| Food and Beverage Stores (4451 and 4452 only) | 5,720 | 0.20 | $14.74 | $30,670 |
| Merchant Wholesalers, Nondurable Goods (4241, 4247, and 4249 only) | 2,430 | 0.43 | $13.74 | $28,570 |
| General Merchandise Stores | 770 | 0.02 | $13.79 | $28,680 |
| Sporting Goods, Hobby, and Musical Instrument Stores | 620 | 0.13 | $12.85 | $26,730 |
Industries with the highest concentration of employment in this occupation:
| Industry | Employment (1) | Percent of industry employment | Hourly mean wage | Annual mean wage (2) |
|---|---|---|---|---|
| Florists | 28,100 | 45.49 | $14.12 | $29,370 |
| Merchant Wholesalers, Nondurable Goods (4241, 4247, and 4249 only) | 2,430 | 0.43 | $13.74 | $28,570 |
| Lawn and Garden Equipment and Supplies Stores | 460 | 0.28 | $15.03 | $31,270 |
| Death Care Services | 300 | 0.22 | $14.83 | $30,850 |
| Food and Beverage Stores (4451 and 4452 only) | 5,720 | 0.20 | $14.74 | $30,670 |
Top paying industries for this occupation:
| Industry | Employment (1) | Percent of industry employment | Hourly mean wage | Annual mean wage (2) |
|---|---|---|---|---|
| Promoters of Performing Arts, Sports, and Similar Events | (8) | (8) | $24.72 | $51,420 |
| Other Personal Services | 340 | 0.10 | $19.34 | $40,230 |
| Traveler Accommodation | 190 | 0.01 | $18.38 | $38,220 |
| Rental and Leasing Services (5322, 5323, and 5324 only) | 40 | 0.01 | $17.48 | $36,360 |
| Services to Buildings and Dwellings | 240 | 0.01 | $17.38 | $36,150 |
States and areas with the highest published employment, location quotients, and wages for this occupation are provided. For a list of all areas with employment in this occupation, see the Create Customized Tables function.
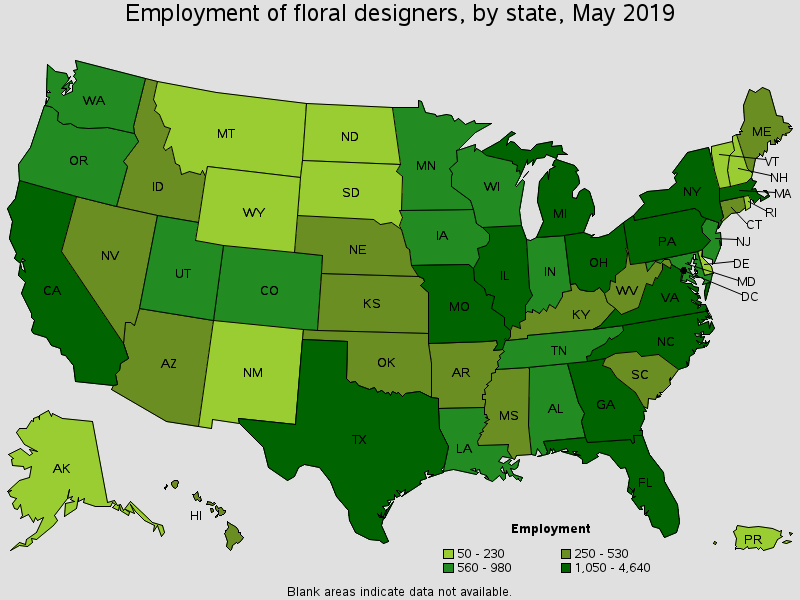
States with the highest employment level in this occupation:
| State | Employment (1) | Employment per thousand jobs | Location quotient (9) | Hourly mean wage | Annual mean wage (2) |
|---|---|---|---|---|---|
| California | 4,640 | 0.27 | 0.94 | $16.79 | $34,930 |
| Florida | 2,570 | 0.29 | 1.03 | $14.69 | $30,560 |
| Texas | 2,560 | 0.21 | 0.73 | $12.84 | $26,700 |
| Illinois | 2,270 | 0.38 | 1.32 | $13.71 | $28,520 |
| Missouri | 2,060 | 0.73 | 2.57 | $12.75 | $26,520 |
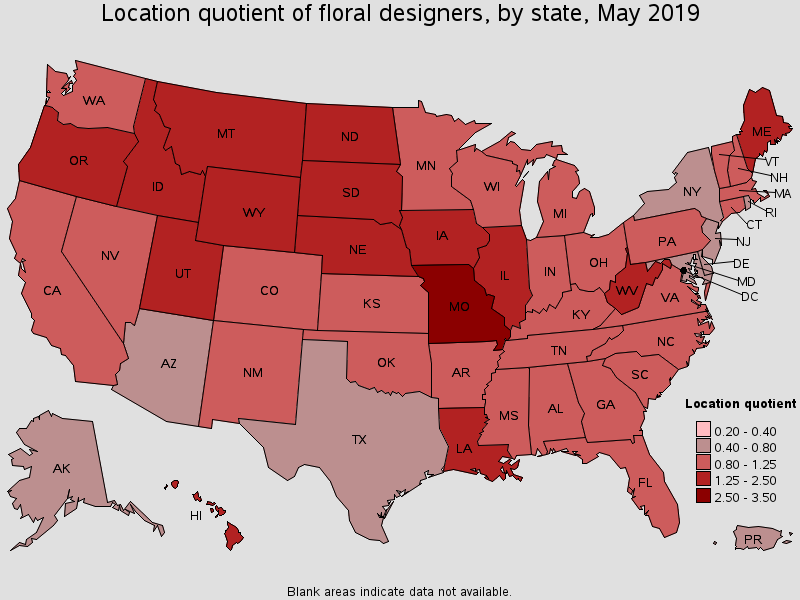
States with the highest concentration of jobs and location quotients in this occupation:
| State | Employment (1) | Employment per thousand jobs | Location quotient (9) | Hourly mean wage | Annual mean wage (2) |
|---|---|---|---|---|---|
| Missouri | 2,060 | 0.73 | 2.57 | $12.75 | $26,520 |
| Wyoming | 150 | 0.54 | 1.88 | $12.73 | $26,470 |
| South Dakota | 210 | 0.50 | 1.76 | $14.36 | $29,880 |
| Oregon | 930 | 0.49 | 1.71 | $13.73 | $28,570 |
| Utah | 690 | 0.46 | 1.62 | $12.60 | $26,210 |
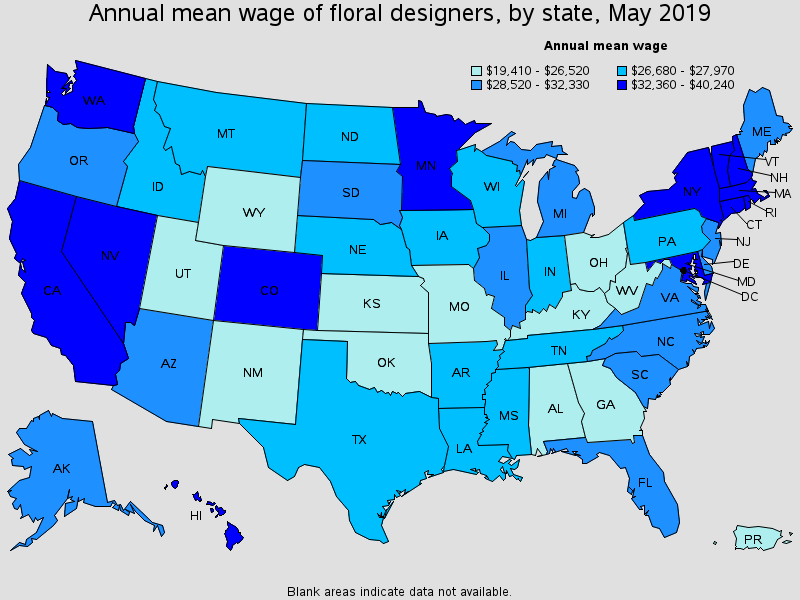
Top paying States for this occupation:
| State | Employment (1) | Employment per thousand jobs | Location quotient (9) | Hourly mean wage | Annual mean wage (2) |
|---|---|---|---|---|---|
| Connecticut | 530 | 0.32 | 1.11 | $19.35 | $40,240 |
| District of Columbia | 50 | 0.07 | 0.26 | $19.27 | $40,080 |
| Massachusetts | 1,170 | 0.32 | 1.14 | $17.40 | $36,200 |
| Vermont | 100 | 0.32 | 1.13 | $16.84 | $35,030 |
| California | 4,640 | 0.27 | 0.94 | $16.79 | $34,930 |
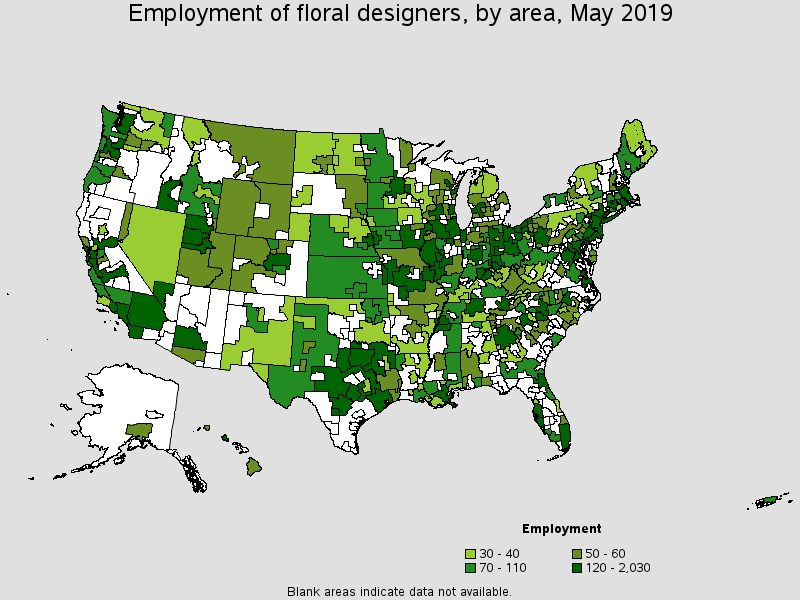
Metropolitan areas with the highest employment level in this occupation:
| Metropolitan area | Employment (1) | Employment per thousand jobs | Location quotient (9) | Hourly mean wage | Annual mean wage (2) |
|---|---|---|---|---|---|
| New York-Newark-Jersey City, NY-NJ-PA | 2,030 | 0.21 | 0.74 | $16.19 | $33,680 |
| Los Angeles-Long Beach-Anaheim, CA | 1,420 | 0.23 | 0.80 | $16.63 | $34,600 |
| Chicago-Naperville-Elgin, IL-IN-WI | 1,390 | 0.30 | 1.05 | $14.65 | $30,470 |
| St. Louis, MO-IL | 1,050 | 0.77 | 2.69 | $12.75 | $26,520 |
| San Francisco-Oakland-Hayward, CA | 990 | 0.40 | 1.41 | $19.19 | $39,920 |
| Boston-Cambridge-Nashua, MA-NH | 860 | 0.31 | 1.08 | $17.69 | $36,790 |
| Philadelphia-Camden-Wilmington, PA-NJ-DE-MD | 750 | 0.26 | 0.92 | $15.13 | $31,460 |
| Miami-Fort Lauderdale-West Palm Beach, FL | 710 | 0.27 | 0.94 | $15.55 | $32,340 |
| Dallas-Fort Worth-Arlington, TX | 690 | 0.19 | 0.67 | $13.67 | $28,430 |
| Kansas City, MO-KS | 640 | 0.59 | 2.08 | $12.88 | $26,800 |
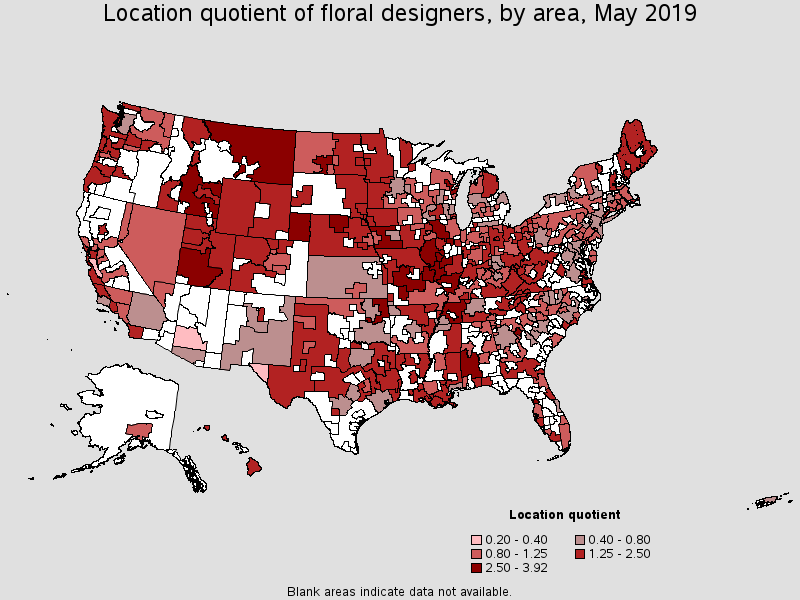
Metropolitan areas with the highest concentration of jobs and location quotients in this occupation:
| Metropolitan area | Employment (1) | Employment per thousand jobs | Location quotient (9) | Hourly mean wage | Annual mean wage (2) |
|---|---|---|---|---|---|
| Springfield, IL | 120 | 1.11 | 3.91 | $13.43 | $27,940 |
| Springfield, MO | 200 | 0.96 | 3.38 | $12.26 | $25,490 |
| Homosassa Springs, FL | 30 | 0.95 | 3.35 | $14.00 | $29,120 |
| Bismarck, ND | 60 | 0.78 | 2.75 | $13.19 | $27,430 |
| St. Louis, MO-IL | 1,050 | 0.77 | 2.69 | $12.75 | $26,520 |
| Green Bay, WI | 130 | 0.74 | 2.61 | $10.88 | $22,620 |
| Athens-Clarke County, GA | 70 | 0.74 | 2.60 | $11.44 | $23,790 |
| Santa Cruz-Watsonville, CA | 70 | 0.73 | 2.57 | $13.62 | $28,320 |
| Lima, OH | 30 | 0.69 | 2.44 | $12.68 | $26,370 |
| Bend-Redmond, OR | 60 | 0.69 | 2.41 | $15.06 | $31,330 |
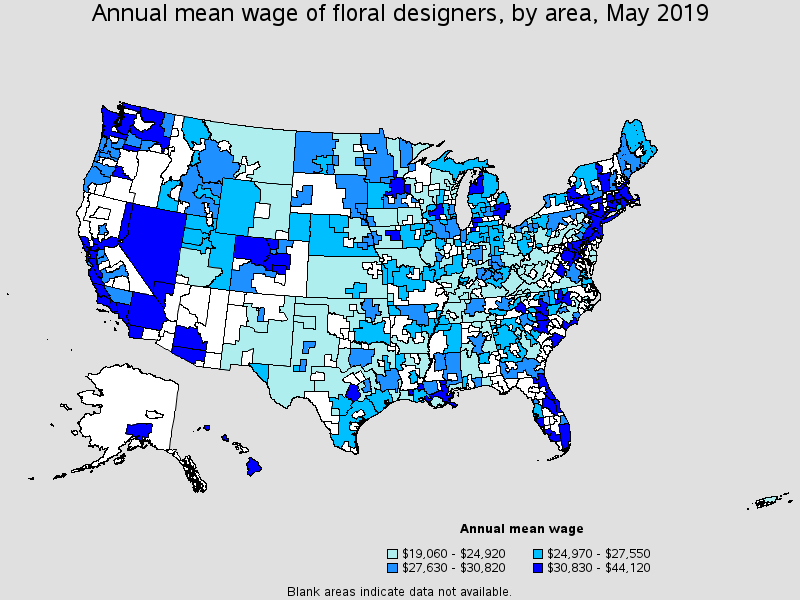
Top paying metropolitan areas for this occupation:
| Metropolitan area | Employment (1) | Employment per thousand jobs | Location quotient (9) | Hourly mean wage | Annual mean wage (2) |
|---|---|---|---|---|---|
| Santa Maria-Santa Barbara, CA | 40 | 0.21 | 0.72 | $21.21 | $44,120 |
| Hartford-West Hartford-East Hartford, CT | 150 | 0.25 | 0.87 | $21.19 | $44,080 |
| Bridgeport-Stamford-Norwalk, CT | 200 | 0.49 | 1.72 | $20.36 | $42,340 |
| Santa Rosa, CA | 60 | 0.27 | 0.96 | $19.26 | $40,070 |
| San Francisco-Oakland-Hayward, CA | 990 | 0.40 | 1.41 | $19.19 | $39,920 |
| Minneapolis-St. Paul-Bloomington, MN-WI | 290 | 0.15 | 0.52 | $18.82 | $39,150 |
| Charlottesville, VA | 60 | 0.48 | 1.69 | $18.62 | $38,730 |
| San Jose-Sunnyvale-Santa Clara, CA | 120 | 0.11 | 0.38 | $18.61 | $38,710 |
| New Haven, CT | 90 | 0.31 | 1.08 | $18.39 | $38,240 |
| Burlington-South Burlington, VT | 40 | 0.36 | 1.27 | $17.91 | $37,260 |
Nonmetropolitan areas with the highest employment in this occupation:
| Nonmetropolitan area | Employment (1) | Employment per thousand jobs | Location quotient (9) | Hourly mean wage | Annual mean wage (2) |
|---|---|---|---|---|---|
| Central Missouri nonmetropolitan area | 180 | 1.11 | 3.92 | $12.64 | $26,300 |
| West Northwestern Ohio nonmetropolitan area | 170 | 0.66 | 2.32 | $12.11 | $25,180 |
| Northwest Illinois nonmetropolitan area | 150 | 1.09 | 3.82 | $13.38 | $27,820 |
| North Texas Region of Texas nonmetropolitan area | 140 | 0.52 | 1.84 | $11.72 | $24,380 |
| North Northeastern Ohio non-metropolitan area (non-contiguous) | 140 | 0.42 | 1.47 | $10.95 | $22,770 |
Nonmetropolitan areas with the highest concentration of jobs and location quotients in this occupation:
| Nonmetropolitan area | Employment (1) | Employment per thousand jobs | Location quotient (9) | Hourly mean wage | Annual mean wage (2) |
|---|---|---|---|---|---|
| Central Missouri nonmetropolitan area | 180 | 1.11 | 3.92 | $12.64 | $26,300 |
| Northwest Illinois nonmetropolitan area | 150 | 1.09 | 3.82 | $13.38 | $27,820 |
| Central Utah nonmetropolitan area | 50 | 0.99 | 3.48 | $11.00 | $22,870 |
| Southwest Iowa nonmetropolitan area | 80 | 0.97 | 3.42 | $11.65 | $24,240 |
| Northeast Oklahoma nonmetropolitan area | 110 | 0.95 | 3.34 | $11.60 | $24,120 |
Top paying nonmetropolitan areas for this occupation:
| Nonmetropolitan area | Employment (1) | Employment per thousand jobs | Location quotient (9) | Hourly mean wage | Annual mean wage (2) |
|---|---|---|---|---|---|
| Northwest Colorado nonmetropolitan area | 60 | 0.49 | 1.73 | $19.59 | $40,750 |
| Hawaii / Kauai nonmetropolitan area | 50 | 0.49 | 1.73 | $17.90 | $37,240 |
| Southern Vermont nonmetropolitan area | (8) | (8) | (8) | $16.05 | $33,390 |
| Nevada nonmetropolitan area | 30 | 0.34 | 1.21 | $16.05 | $33,380 |
| Northwest Lower Peninsula of Michigan nonmetropolitan area | 40 | 0.29 | 1.03 | $15.32 | $31,870 |
These estimates are calculated with data collected from employers in all industry sectors, all metropolitan and nonmetropolitan areas, and all states and the District of Columbia. The top employment and wage figures are provided above. The complete list is available in the downloadable XLS files.
The percentile wage estimate is the value of a wage below which a certain percent of workers fall. The median wage is the 50th percentile wage estimate--50 percent of workers earn less than the median and 50 percent of workers earn more than the median. More about percentile wages.
(1) Estimates for detailed occupations do not sum to the totals because the totals include occupations not shown separately. Estimates do not include self-employed workers.
(2) Annual wages have been calculated by multiplying the hourly mean wage by a "year-round, full-time" hours figure of 2,080 hours; for those occupations where there is not an hourly wage published, the annual wage has been directly calculated from the reported survey data.
(3) The relative standard error (RSE) is a measure of the reliability of a survey statistic. The smaller the relative standard error, the more precise the estimate.
(8) Estimate not released.
(9) The location quotient is the ratio of the area concentration of occupational employment to the national average concentration. A location quotient greater than one indicates the occupation has a higher share of employment than average, and a location quotient less than one indicates the occupation is less prevalent in the area than average.
Other OES estimates and related information:
May 2019 National Occupational Employment and Wage Estimates
May 2019 State Occupational Employment and Wage Estimates
May 2019 Metropolitan and Nonmetropolitan Area Occupational Employment and Wage Estimates
May 2019 National Industry-Specific Occupational Employment and Wage Estimates
Last Modified Date: July 6, 2020