
An official website of the United States government
An official website of the United States government
The .gov means it's official.
Federal government websites often end in .gov or .mil. Before sharing sensitive information,
make sure you're on a federal government site.
The site is secure.
The
https:// ensures that you are connecting to the official website and that any
information you provide is encrypted and transmitted securely.
Examine, diagnose, and treat diseases, injuries, and malformations of teeth and gums. May treat diseases of nerve, pulp, and other dental tissues affecting oral hygiene and retention of teeth. May fit dental appliances or provide preventive care. Excludes �Oral and Maxillofacial Surgeons� (29-1022), �Orthodontists� (29-1023), �Prosthodontists� (29-1024), and �Dentists, All Other Specialists� (29-1029).
Employment estimate and mean wage estimates for this occupation:
| Employment (1) | Employment RSE (3) |
Mean hourly wage |
Mean annual wage (2) |
Wage RSE (3) |
|---|---|---|---|---|
| 110,730 | 1.9 % | $85.70 | $178,260 | 1.2 % |
Percentile wage estimates for this occupation:
| Percentile | 10% | 25% | 50% (Median) |
75% | 90% |
|---|---|---|---|---|---|
| Hourly Wage | $38.87 | $54.36 | $74.81 | (5) | (5) |
| Annual Wage (2) | $80,850 | $113,060 | $155,600 | (5) | (5) |
Industries with the highest published employment and wages for this occupation are provided. For a list of all industries with employment in this occupation, see the Create Customized Tables function.
Industries with the highest levels of employment in this occupation:
| Industry | Employment (1) | Percent of industry employment | Hourly mean wage | Annual mean wage (2) |
|---|---|---|---|---|
| Offices of Dentists | 98,970 | 10.25 | $86.85 | $180,660 |
| Offices of Physicians | 3,340 | 0.13 | $77.24 | $160,670 |
| Outpatient Care Centers | 2,840 | 0.30 | $75.94 | $157,950 |
| General Medical and Surgical Hospitals | 1,690 | 0.03 | $70.03 | $145,650 |
| State Government, excluding schools and hospitals (OES Designation) | 1,090 | 0.05 | $88.14 | $183,320 |
Industries with the highest concentration of employment in this occupation:
| Industry | Employment (1) | Percent of industry employment | Hourly mean wage | Annual mean wage (2) |
|---|---|---|---|---|
| Offices of Dentists | 98,970 | 10.25 | $86.85 | $180,660 |
| Outpatient Care Centers | 2,840 | 0.30 | $75.94 | $157,950 |
| Offices of Physicians | 3,340 | 0.13 | $77.24 | $160,670 |
| State Government, excluding schools and hospitals (OES Designation) | 1,090 | 0.05 | $88.14 | $183,320 |
| Psychiatric and Substance Abuse Hospitals | 130 | 0.05 | $75.74 | $157,550 |
Top paying industries for this occupation:
| Industry | Employment (1) | Percent of industry employment | Hourly mean wage | Annual mean wage (2) |
|---|---|---|---|---|
| Residential Intellectual and Developmental Disability, Mental Health, and Substance Abuse Facilities | 30 | 0.01 | $94.89 | $197,370 |
| Offices of Other Health Practitioners | 180 | 0.02 | $94.16 | $195,850 |
| State Government, excluding schools and hospitals (OES Designation) | 1,090 | 0.05 | $88.14 | $183,320 |
| Offices of Dentists | 98,970 | 10.25 | $86.85 | $180,660 |
| Employment Services | 340 | 0.01 | $79.48 | $165,330 |
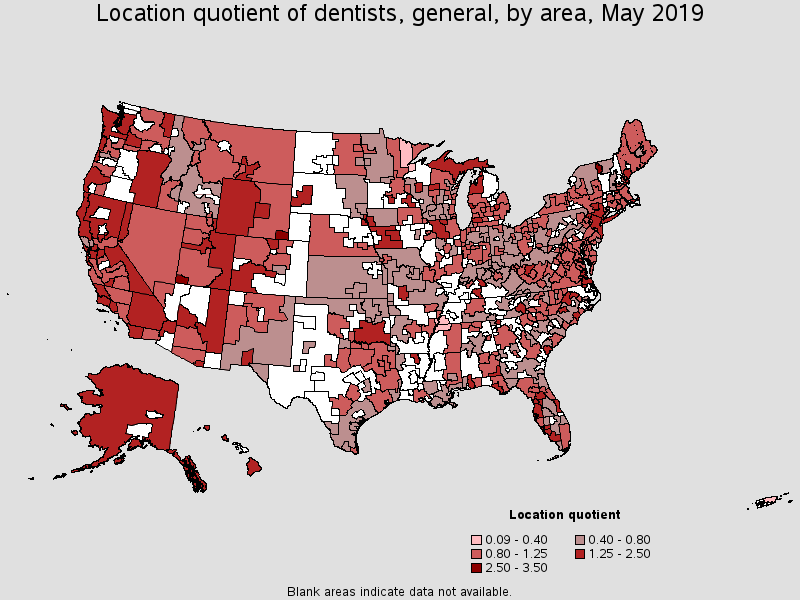
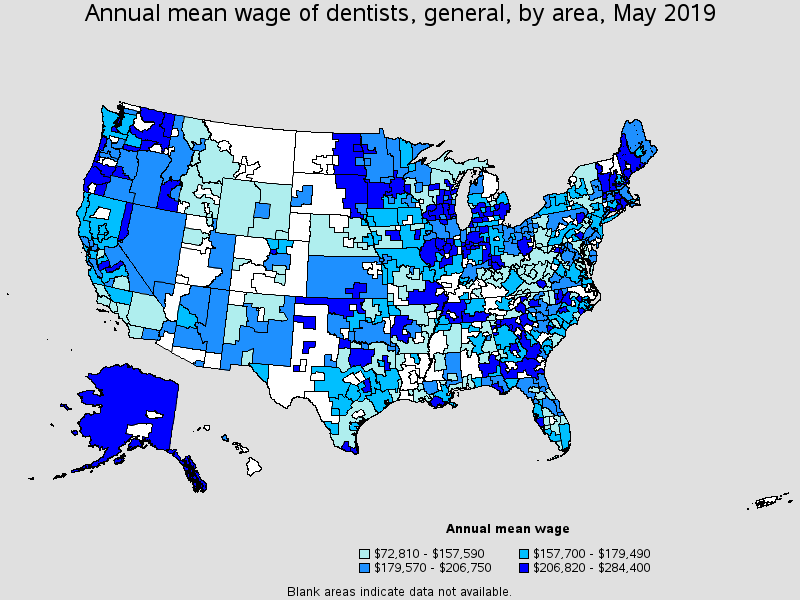
States and areas with the highest published employment, location quotients, and wages for this occupation are provided. For a list of all areas with employment in this occupation, see the Create Customized Tables function.
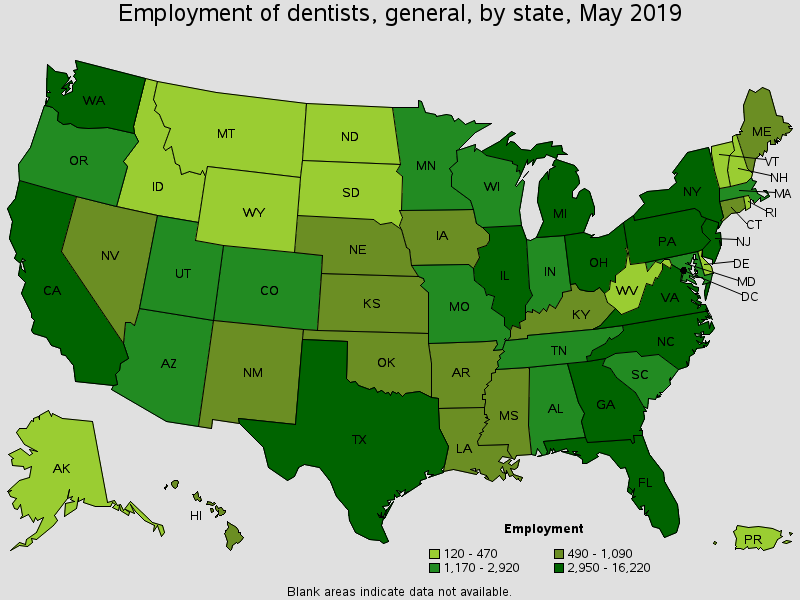
States with the highest employment level in this occupation:
| State | Employment (1) | Employment per thousand jobs | Location quotient (9) | Hourly mean wage | Annual mean wage (2) |
|---|---|---|---|---|---|
| California | 16,220 | 0.93 | 1.24 | $74.84 | $155,670 |
| New York | 8,780 | 0.92 | 1.22 | $80.33 | $167,090 |
| Texas | 8,590 | 0.69 | 0.92 | $88.22 | $183,510 |
| Florida | 7,110 | 0.81 | 1.07 | $83.48 | $173,630 |
| Illinois | 3,850 | 0.64 | 0.85 | $90.95 | $189,170 |
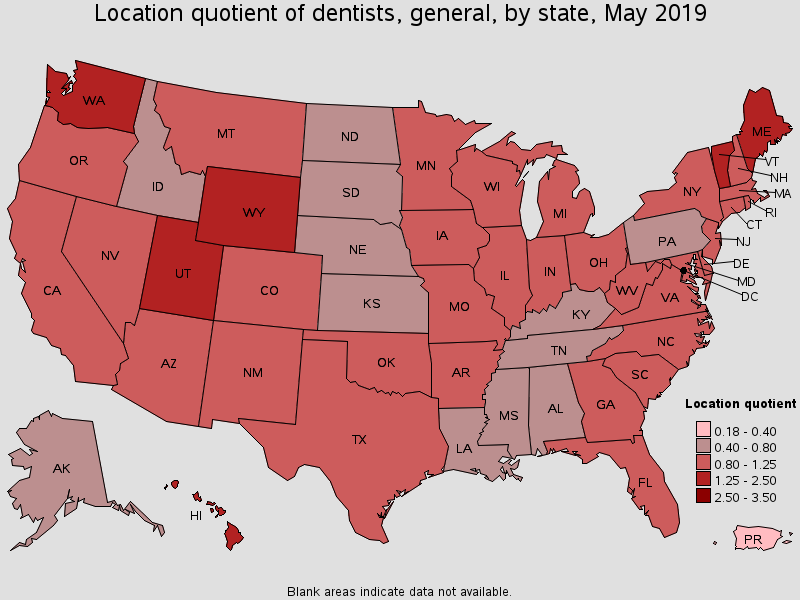
States with the highest concentration of jobs and location quotients in this occupation:
| State | Employment (1) | Employment per thousand jobs | Location quotient (9) | Hourly mean wage | Annual mean wage (2) |
|---|---|---|---|---|---|
| Vermont | 360 | 1.17 | 1.56 | $125.86 | $261,790 |
| Wyoming | 300 | 1.10 | 1.45 | $61.53 | $127,990 |
| Hawaii | 700 | 1.10 | 1.46 | $87.60 | $182,210 |
| Utah | 1,510 | 1.00 | 1.33 | $64.77 | $134,730 |
| Washington | 3,300 | 0.99 | 1.32 | $89.06 | $185,240 |
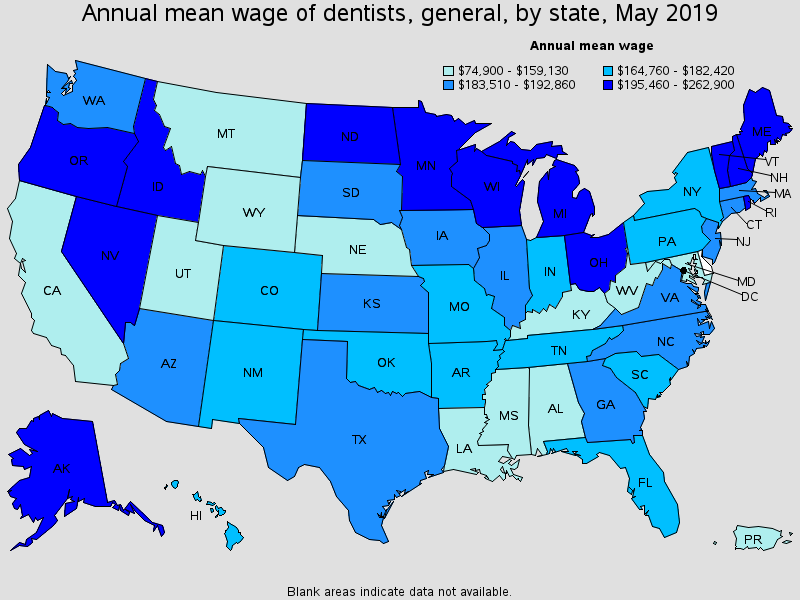
Top paying States for this occupation:
| State | Employment (1) | Employment per thousand jobs | Location quotient (9) | Hourly mean wage | Annual mean wage (2) |
|---|---|---|---|---|---|
| Rhode Island | 320 | 0.65 | 0.86 | $126.39 | $262,900 |
| Vermont | 360 | 1.17 | 1.56 | $125.86 | $261,790 |
| Alaska | 190 | 0.59 | 0.78 | $115.35 | $239,930 |
| North Dakota | 200 | 0.48 | 0.64 | $108.54 | $225,770 |
| Maine | 590 | 0.96 | 1.27 | $105.96 | $220,400 |
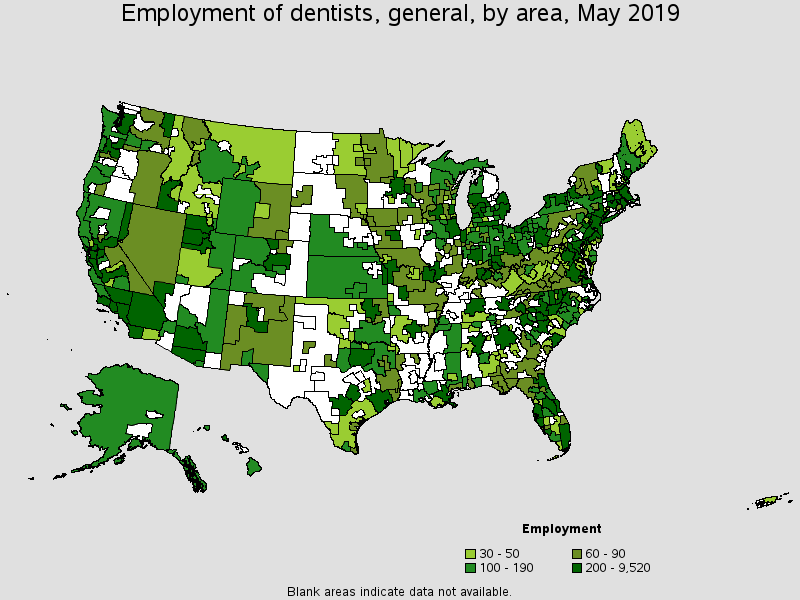
Metropolitan areas with the highest employment level in this occupation:
| Metropolitan area | Employment (1) | Employment per thousand jobs | Location quotient (9) | Hourly mean wage | Annual mean wage (2) |
|---|---|---|---|---|---|
| New York-Newark-Jersey City, NY-NJ-PA | 9,520 | 0.99 | 1.31 | $82.04 | $170,640 |
| Los Angeles-Long Beach-Anaheim, CA | 5,660 | 0.91 | 1.20 | $68.18 | $141,810 |
| Chicago-Naperville-Elgin, IL-IN-WI | 2,960 | 0.63 | 0.84 | $88.64 | $184,380 |
| Dallas-Fort Worth-Arlington, TX | 2,930 | 0.80 | 1.06 | $99.61 | $207,180 |
| Washington-Arlington-Alexandria, DC-VA-MD-WV | 2,890 | 0.91 | 1.21 | $93.73 | $194,960 |
| San Francisco-Oakland-Hayward, CA | 2,890 | 1.17 | 1.55 | $81.60 | $169,730 |
| Houston-The Woodlands-Sugar Land, TX | 2,420 | 0.79 | 1.05 | $80.14 | $166,700 |
| Boston-Cambridge-Nashua, MA-NH | 2,150 | 0.77 | 1.02 | $92.59 | $192,590 |
| Atlanta-Sandy Springs-Roswell, GA | 2,110 | 0.77 | 1.02 | $84.20 | $175,140 |
| Seattle-Tacoma-Bellevue, WA | 2,020 | 1.00 | 1.33 | $81.87 | $170,290 |
Metropolitan areas with the highest concentration of jobs and location quotients in this occupation:
| Metropolitan area | Employment (1) | Employment per thousand jobs | Location quotient (9) | Hourly mean wage | Annual mean wage (2) |
|---|---|---|---|---|---|
| Burlington-South Burlington, VT | 250 | 2.07 | 2.75 | $132.42 | $275,430 |
| St. George, UT | 140 | 2.01 | 2.66 | (8) | (8) |
| Cheyenne, WY | 90 | 1.92 | 2.54 | $49.74 | $103,450 |
| The Villages, FL | 50 | 1.64 | 2.17 | $83.54 | $173,760 |
| Rocky Mount, NC | 90 | 1.64 | 2.17 | $70.69 | $147,040 |
| Prescott, AZ | 110 | 1.64 | 2.17 | $78.88 | $164,080 |
| Elizabethtown-Fort Knox, KY | 90 | 1.63 | 2.17 | (8) | (8) |
| Provo-Orem, UT | 410 | 1.62 | 2.15 | (8) | (8) |
| Portland-South Portland, ME | 340 | 1.61 | 2.14 | $103.80 | $215,910 |
| Leominster-Gardner, MA | 80 | 1.56 | 2.07 | $86.19 | $179,260 |
Top paying metropolitan areas for this occupation:
| Metropolitan area | Employment (1) | Employment per thousand jobs | Location quotient (9) | Hourly mean wage | Annual mean wage (2) |
|---|---|---|---|---|---|
| Warner Robins, GA | 40 | 0.61 | 0.81 | (5) | (5) |
| Burlington, NC | 40 | 0.60 | 0.79 | $133.82 | $278,360 |
| Burlington-South Burlington, VT | 250 | 2.07 | 2.75 | $132.42 | $275,430 |
| Longview, TX | 60 | 0.68 | 0.90 | $130.98 | $272,440 |
| Olympia-Tumwater, WA | (8) | (8) | (8) | $128.48 | $267,240 |
| Reno, NV | 230 | 0.95 | 1.26 | $123.32 | $256,510 |
| Providence-Warwick, RI-MA | 400 | 0.69 | 0.91 | $122.22 | $254,220 |
| Amarillo, TX | (8) | (8) | (8) | $121.68 | $253,090 |
| Iowa City, IA | 30 | 0.34 | 0.45 | $121.00 | $251,670 |
| Fond du Lac, WI | (8) | (8) | (8) | $118.93 | $247,370 |
Nonmetropolitan areas with the highest employment in this occupation:
| Nonmetropolitan area | Employment (1) | Employment per thousand jobs | Location quotient (9) | Hourly mean wage | Annual mean wage (2) |
|---|---|---|---|---|---|
| Balance of Lower Peninsula of Michigan nonmetropolitan area | 230 | 0.84 | 1.12 | $81.95 | $170,460 |
| Piedmont North Carolina nonmetropolitan area | 220 | 0.83 | 1.10 | $96.58 | $200,880 |
| Northwest Lower Peninsula of Michigan nonmetropolitan area | 190 | 1.55 | 2.05 | $99.23 | $206,400 |
| North Northeastern Ohio non-metropolitan area (non-contiguous) | 180 | 0.55 | 0.72 | $89.14 | $185,410 |
| Southeast Oklahoma nonmetropolitan area | 170 | 1.00 | 1.32 | $93.11 | $193,660 |
Nonmetropolitan areas with the highest concentration of jobs and location quotients in this occupation:
| Nonmetropolitan area | Employment (1) | Employment per thousand jobs | Location quotient (9) | Hourly mean wage | Annual mean wage (2) |
|---|---|---|---|---|---|
| Northwest Lower Peninsula of Michigan nonmetropolitan area | 190 | 1.55 | 2.05 | $99.23 | $206,400 |
| Southwest Colorado nonmetropolitan area | 150 | 1.50 | 1.99 | (8) | (8) |
| Hawaii / Kauai nonmetropolitan area | 150 | 1.48 | 1.96 | (8) | (8) |
| Eastern Utah nonmetropolitan area | 110 | 1.41 | 1.86 | $89.15 | $185,420 |
| Upper Peninsula of Michigan nonmetropolitan area | 150 | 1.38 | 1.83 | $75.31 | $156,640 |
Top paying nonmetropolitan areas for this occupation:
| Nonmetropolitan area | Employment (1) | Employment per thousand jobs | Location quotient (9) | Hourly mean wage | Annual mean wage (2) |
|---|---|---|---|---|---|
| East North Dakota nonmetropolitan area | 50 | 0.71 | 0.94 | $136.73 | $284,400 |
| East Georgia nonmetropolitan area | 70 | 0.85 | 1.13 | $129.52 | $269,400 |
| Central Indiana nonmetropolitan area | 130 | 0.81 | 1.08 | $126.15 | $262,400 |
| West Central-Southwest New Hampshire nonmetropolitan area | 50 | 0.50 | 0.66 | $122.30 | $254,390 |
| Southwest Maine nonmetropolitan area | 130 | 0.69 | 0.91 | $122.26 | $254,300 |
These estimates are calculated with data collected from employers in all industry sectors, all metropolitan and nonmetropolitan areas, and all states and the District of Columbia. The top employment and wage figures are provided above. The complete list is available in the downloadable XLS files.
The percentile wage estimate is the value of a wage below which a certain percent of workers fall. The median wage is the 50th percentile wage estimate--50 percent of workers earn less than the median and 50 percent of workers earn more than the median. More about percentile wages.
(1) Estimates for detailed occupations do not sum to the totals because the totals include occupations not shown separately. Estimates do not include self-employed workers.
(2) Annual wages have been calculated by multiplying the hourly mean wage by a "year-round, full-time" hours figure of 2,080 hours; for those occupations where there is not an hourly wage published, the annual wage has been directly calculated from the reported survey data.
(3) The relative standard error (RSE) is a measure of the reliability of a survey statistic. The smaller the relative standard error, the more precise the estimate.
(5) This wage is equal to or greater than $100.00 per hour or $208,000 per year.
(8) Estimate not released.
(9) The location quotient is the ratio of the area concentration of occupational employment to the national average concentration. A location quotient greater than one indicates the occupation has a higher share of employment than average, and a location quotient less than one indicates the occupation is less prevalent in the area than average.
Other OES estimates and related information:
May 2019 National Occupational Employment and Wage Estimates
May 2019 State Occupational Employment and Wage Estimates
May 2019 Metropolitan and Nonmetropolitan Area Occupational Employment and Wage Estimates
May 2019 National Industry-Specific Occupational Employment and Wage Estimates
Last Modified Date: July 6, 2020