
An official website of the United States government
An official website of the United States government
The .gov means it's official.
Federal government websites often end in .gov or .mil. Before sharing sensitive information,
make sure you're on a federal government site.
The site is secure.
The
https:// ensures that you are connecting to the official website and that any
information you provide is encrypted and transmitted securely.
All healthcare support workers not listed separately.
Employment estimate and mean wage estimates for this occupation:
| Employment (1) | Employment RSE (3) |
Mean hourly wage |
Mean annual wage (2) |
Wage RSE (3) |
|---|---|---|---|---|
| 93,270 | 1.6 % | $19.24 | $40,010 | 0.6 % |
Percentile wage estimates for this occupation:
| Percentile | 10% | 25% | 50% (Median) |
75% | 90% |
|---|---|---|---|---|---|
| Hourly Wage | $11.44 | $14.16 | $18.49 | $23.29 | $28.13 |
| Annual Wage (2) | $23,790 | $29,460 | $38,460 | $48,440 | $58,500 |
Industries with the highest published employment and wages for this occupation are provided. For a list of all industries with employment in this occupation, see the Create Customized Tables function.
Industries with the highest levels of employment in this occupation:
| Industry | Employment (1) | Percent of industry employment | Hourly mean wage | Annual mean wage (2) |
|---|---|---|---|---|
| General Medical and Surgical Hospitals | 23,980 | 0.43 | $18.17 | $37,790 |
| Federal Executive Branch (OES Designation) | 13,840 | 0.69 | $22.64 | $47,090 |
| Elementary and Secondary Schools | 9,590 | 0.11 | $20.21 | $42,040 |
| Nursing Care Facilities (Skilled Nursing Facilities) | 5,400 | 0.34 | $15.73 | $32,720 |
| Offices of Other Health Practitioners | 4,770 | 0.50 | $20.03 | $41,650 |
Industries with the highest concentration of employment in this occupation:
| Industry | Employment (1) | Percent of industry employment | Hourly mean wage | Annual mean wage (2) |
|---|---|---|---|---|
| Medical and Diagnostic Laboratories | 2,660 | 0.96 | $16.60 | $34,520 |
| Other Ambulatory Health Care Services | 2,800 | 0.90 | $18.01 | $37,460 |
| Federal Executive Branch (OES Designation) | 13,840 | 0.69 | $22.64 | $47,090 |
| Offices of Other Health Practitioners | 4,770 | 0.50 | $20.03 | $41,650 |
| Psychiatric and Substance Abuse Hospitals | 1,070 | 0.43 | $16.94 | $35,230 |
Top paying industries for this occupation:
| Industry | Employment (1) | Percent of industry employment | Hourly mean wage | Annual mean wage (2) |
|---|---|---|---|---|
| Business, Professional, Labor, Political, and Similar Organizations | 40 | 0.01 | $31.52 | $65,550 |
| Offices of Dentists | 540 | 0.06 | $23.81 | $49,530 |
| Medical Equipment and Supplies Manufacturing | 370 | 0.12 | $23.74 | $49,380 |
| Federal Executive Branch (OES Designation) | 13,840 | 0.69 | $22.64 | $47,090 |
| Management of Companies and Enterprises | 610 | 0.02 | $22.32 | $46,430 |
States and areas with the highest published employment, location quotients, and wages for this occupation are provided. For a list of all areas with employment in this occupation, see the Create Customized Tables function.
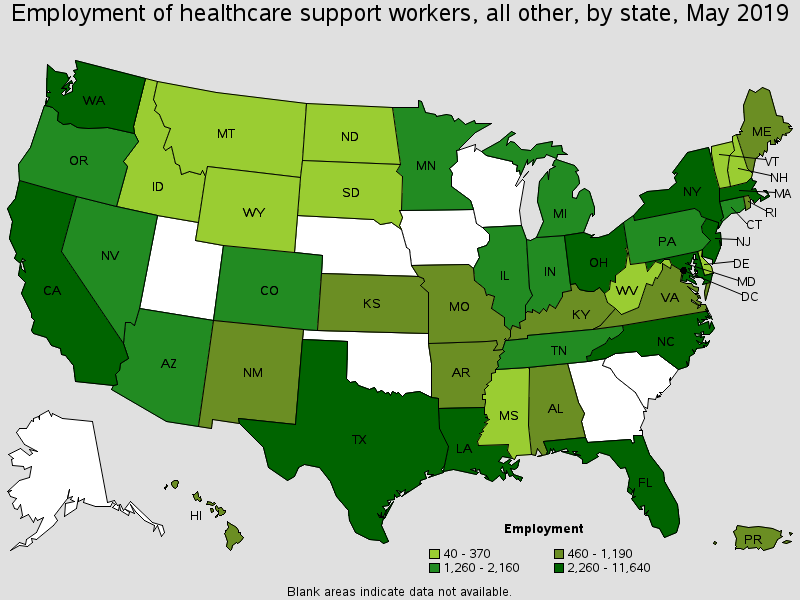
States with the highest employment level in this occupation:
| State | Employment (1) | Employment per thousand jobs | Location quotient (9) | Hourly mean wage | Annual mean wage (2) |
|---|---|---|---|---|---|
| California | 11,640 | 0.67 | 1.05 | $22.81 | $47,440 |
| Texas | 7,490 | 0.60 | 0.95 | $20.12 | $41,850 |
| New Jersey | 5,740 | 1.41 | 2.21 | $17.93 | $37,280 |
| Florida | 5,740 | 0.65 | 1.03 | $18.54 | $38,560 |
| New York | 5,390 | 0.57 | 0.89 | $19.25 | $40,040 |
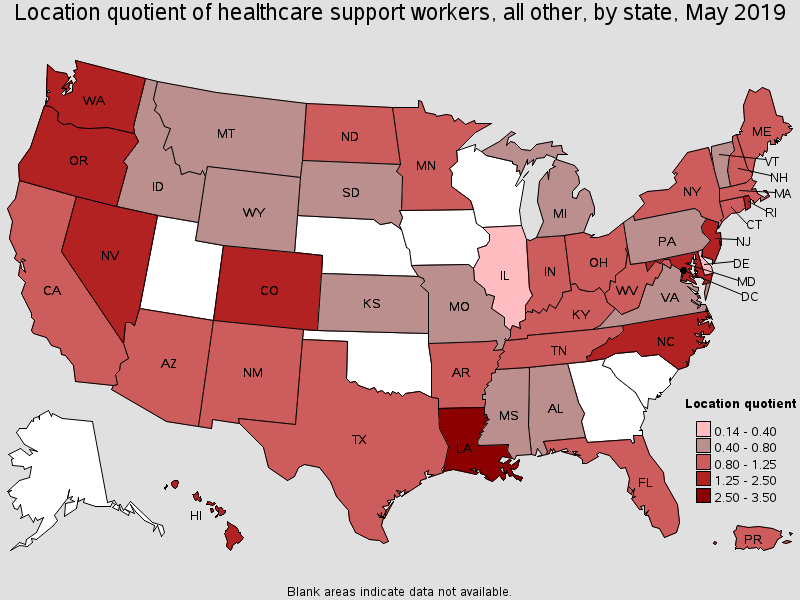
States with the highest concentration of jobs and location quotients in this occupation:
| State | Employment (1) | Employment per thousand jobs | Location quotient (9) | Hourly mean wage | Annual mean wage (2) |
|---|---|---|---|---|---|
| Louisiana | 3,060 | 1.59 | 2.51 | $14.49 | $30,140 |
| Hawaii | 940 | 1.48 | 2.33 | $20.44 | $42,520 |
| New Jersey | 5,740 | 1.41 | 2.21 | $17.93 | $37,280 |
| Rhode Island | 650 | 1.34 | 2.11 | $17.94 | $37,310 |
| Maryland | 3,590 | 1.33 | 2.09 | $18.77 | $39,040 |
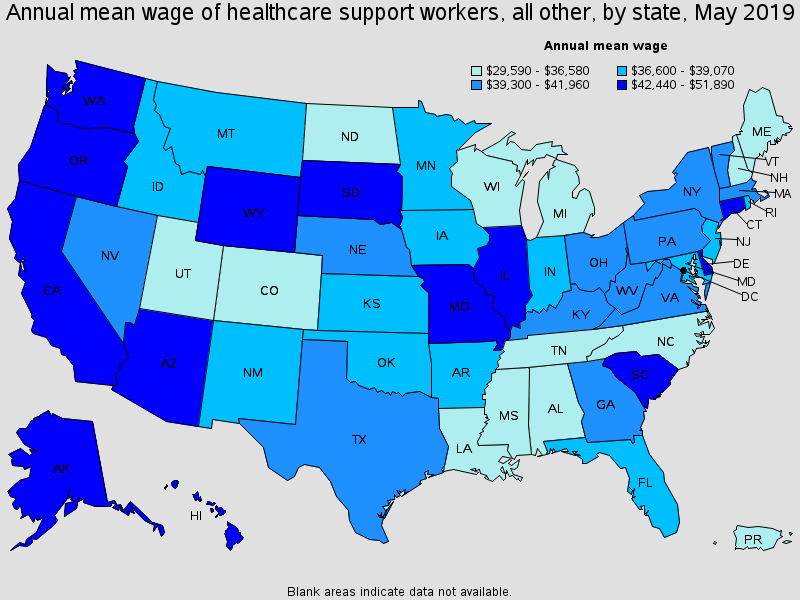
Top paying States for this occupation:
| State | Employment (1) | Employment per thousand jobs | Location quotient (9) | Hourly mean wage | Annual mean wage (2) |
|---|---|---|---|---|---|
| District of Columbia | 200 | 0.27 | 0.43 | $24.95 | $51,890 |
| Delaware | 40 | 0.09 | 0.14 | $24.24 | $50,410 |
| Alaska | (8) | (8) | (8) | $24.21 | $50,350 |
| California | 11,640 | 0.67 | 1.05 | $22.81 | $47,440 |
| Illinois | 1,380 | 0.23 | 0.36 | $22.75 | $47,320 |
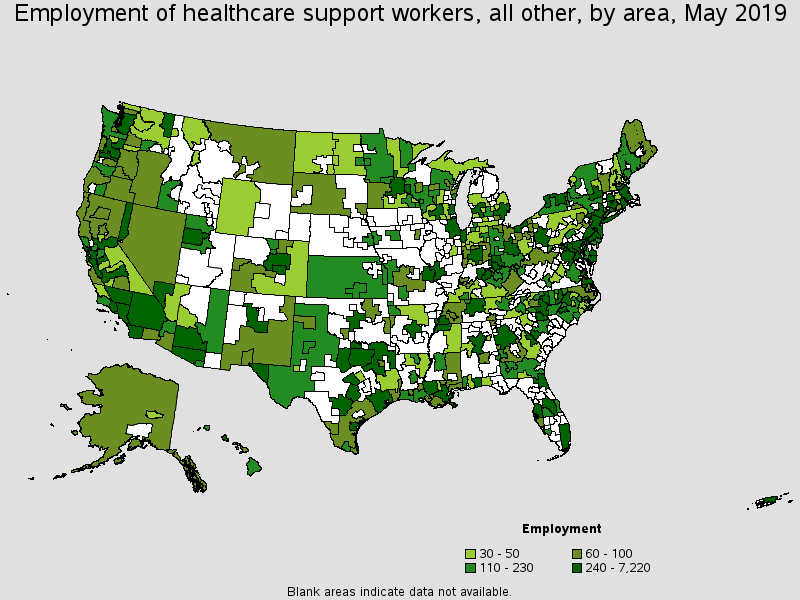
Metropolitan areas with the highest employment level in this occupation:
| Metropolitan area | Employment (1) | Employment per thousand jobs | Location quotient (9) | Hourly mean wage | Annual mean wage (2) |
|---|---|---|---|---|---|
| New York-Newark-Jersey City, NY-NJ-PA | 7,220 | 0.75 | 1.18 | $19.00 | $39,520 |
| Los Angeles-Long Beach-Anaheim, CA | 3,370 | 0.54 | 0.85 | $22.66 | $47,130 |
| Baltimore-Columbia-Towson, MD | 2,100 | 1.52 | 2.40 | $17.96 | $37,360 |
| Miami-Fort Lauderdale-West Palm Beach, FL | 2,060 | 0.78 | 1.23 | $19.76 | $41,110 |
| Boston-Cambridge-Nashua, MA-NH | 1,820 | 0.65 | 1.03 | $17.72 | $36,860 |
| Dallas-Fort Worth-Arlington, TX | 1,810 | 0.49 | 0.78 | $19.38 | $40,320 |
| San Francisco-Oakland-Hayward, CA | 1,690 | 0.68 | 1.08 | $24.50 | $50,950 |
| Philadelphia-Camden-Wilmington, PA-NJ-DE-MD | 1,540 | 0.54 | 0.84 | $20.26 | $42,140 |
| Seattle-Tacoma-Bellevue, WA | 1,480 | 0.73 | 1.15 | $23.85 | $49,610 |
| San Diego-Carlsbad, CA | 1,450 | 0.97 | 1.53 | $23.09 | $48,030 |
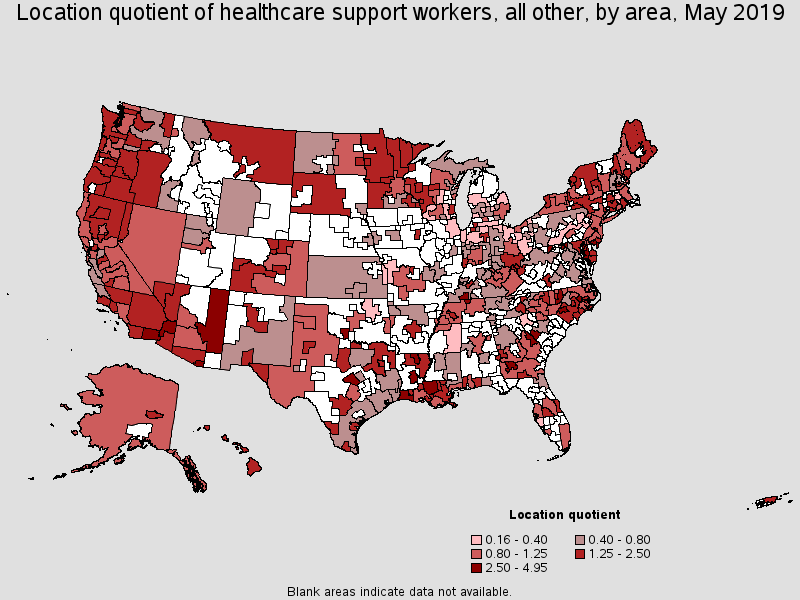
Metropolitan areas with the highest concentration of jobs and location quotients in this occupation:
| Metropolitan area | Employment (1) | Employment per thousand jobs | Location quotient (9) | Hourly mean wage | Annual mean wage (2) |
|---|---|---|---|---|---|
| Fayetteville, NC | 410 | 3.15 | 4.95 | $21.20 | $44,090 |
| Albany, GA | 170 | 2.90 | 4.57 | $22.07 | $45,910 |
| Ocean City, NJ | 100 | 2.62 | 4.12 | $20.27 | $42,170 |
| Greenville, NC | 190 | 2.43 | 3.82 | $15.36 | $31,940 |
| Trenton, NJ | 580 | 2.41 | 3.79 | $17.44 | $36,270 |
| Clarksville, TN-KY | 200 | 2.35 | 3.70 | $20.13 | $41,870 |
| Killeen-Temple, TX | 330 | 2.33 | 3.67 | $20.87 | $43,420 |
| Hagerstown-Martinsburg, MD-WV | 240 | 2.30 | 3.62 | $18.92 | $39,350 |
| Alexandria, LA | 120 | 2.04 | 3.21 | $15.97 | $33,210 |
| Lawton, OK | 90 | 2.02 | 3.19 | $20.82 | $43,310 |
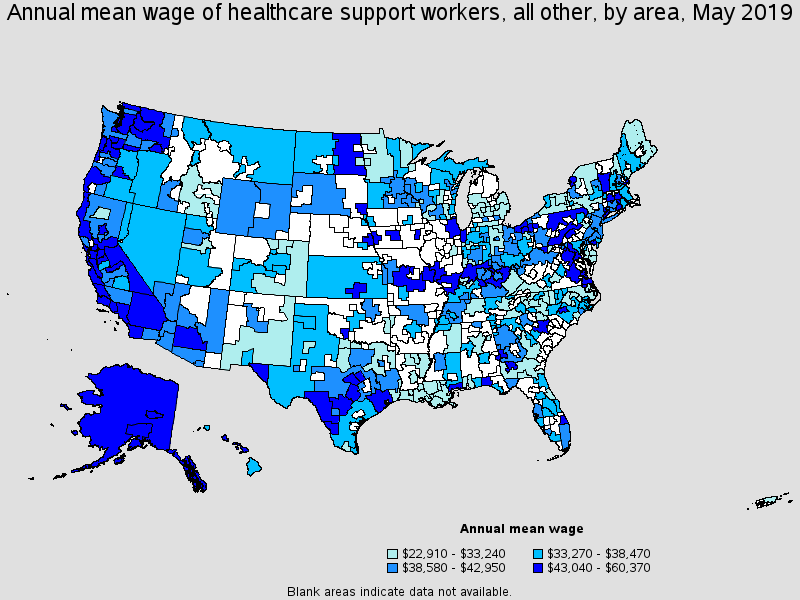
Top paying metropolitan areas for this occupation:
| Metropolitan area | Employment (1) | Employment per thousand jobs | Location quotient (9) | Hourly mean wage | Annual mean wage (2) |
|---|---|---|---|---|---|
| San Jose-Sunnyvale-Santa Clara, CA | 540 | 0.48 | 0.75 | $29.03 | $60,370 |
| Fairbanks, AK | 40 | 1.20 | 1.90 | $26.00 | $54,090 |
| Morgantown, WV | (8) | (8) | (8) | $25.56 | $53,170 |
| Springfield, MA-CT | 270 | 0.81 | 1.28 | $24.83 | $51,650 |
| Stockton-Lodi, CA | 110 | 0.44 | 0.69 | $24.64 | $51,260 |
| San Francisco-Oakland-Hayward, CA | 1,690 | 0.68 | 1.08 | $24.50 | $50,950 |
| Salinas, CA | 80 | 0.44 | 0.69 | $24.12 | $50,170 |
| Seattle-Tacoma-Bellevue, WA | 1,480 | 0.73 | 1.15 | $23.85 | $49,610 |
| Danbury, CT | 80 | 1.07 | 1.69 | $23.69 | $49,280 |
| San Antonio-New Braunfels, TX | 970 | 0.94 | 1.48 | $23.62 | $49,130 |
Nonmetropolitan areas with the highest employment in this occupation:
| Nonmetropolitan area | Employment (1) | Employment per thousand jobs | Location quotient (9) | Hourly mean wage | Annual mean wage (2) |
|---|---|---|---|---|---|
| North Texas Region of Texas nonmetropolitan area | 390 | 1.43 | 2.25 | $13.08 | $27,200 |
| Arizona nonmetropolitan area | 210 | 2.31 | 3.64 | $20.65 | $42,950 |
| Northwest Minnesota nonmetropolitan area | 210 | 1.08 | 1.70 | $15.04 | $31,270 |
| Southeast Coastal North Carolina nonmetropolitan area | 200 | 0.80 | 1.26 | $16.30 | $33,910 |
| Central East New York nonmetropolitan area | 200 | 1.25 | 1.96 | $15.08 | $31,360 |
Nonmetropolitan areas with the highest concentration of jobs and location quotients in this occupation:
| Nonmetropolitan area | Employment (1) | Employment per thousand jobs | Location quotient (9) | Hourly mean wage | Annual mean wage (2) |
|---|---|---|---|---|---|
| Arizona nonmetropolitan area | 210 | 2.31 | 3.64 | $20.65 | $42,950 |
| Maryland nonmetropolitan area | 130 | 2.13 | 3.36 | $15.37 | $31,970 |
| Central Oregon nonmetropolitan area | 100 | 1.57 | 2.48 | $17.21 | $35,790 |
| North Texas Region of Texas nonmetropolitan area | 390 | 1.43 | 2.25 | $13.08 | $27,200 |
| Hawaii / Kauai nonmetropolitan area | 140 | 1.40 | 2.21 | $16.83 | $35,020 |
Top paying nonmetropolitan areas for this occupation:
| Nonmetropolitan area | Employment (1) | Employment per thousand jobs | Location quotient (9) | Hourly mean wage | Annual mean wage (2) |
|---|---|---|---|---|---|
| Border Region of Texas nonmetropolitan area | (8) | (8) | (8) | $26.03 | $54,130 |
| Southern Pennsylvania nonmetropolitan area | 30 | 0.16 | 0.26 | $25.48 | $53,010 |
| Alaska nonmetropolitan area | 60 | 0.59 | 0.94 | $24.93 | $51,860 |
| Central Kentucky nonmetropolitan area | 120 | 0.69 | 1.09 | $24.76 | $51,500 |
| Central Missouri nonmetropolitan area | 90 | 0.54 | 0.86 | $22.83 | $47,490 |
These estimates are calculated with data collected from employers in all industry sectors, all metropolitan and nonmetropolitan areas, and all states and the District of Columbia. The top employment and wage figures are provided above. The complete list is available in the downloadable XLS files.
The percentile wage estimate is the value of a wage below which a certain percent of workers fall. The median wage is the 50th percentile wage estimate--50 percent of workers earn less than the median and 50 percent of workers earn more than the median. More about percentile wages.
(1) Estimates for detailed occupations do not sum to the totals because the totals include occupations not shown separately. Estimates do not include self-employed workers.
(2) Annual wages have been calculated by multiplying the hourly mean wage by a "year-round, full-time" hours figure of 2,080 hours; for those occupations where there is not an hourly wage published, the annual wage has been directly calculated from the reported survey data.
(3) The relative standard error (RSE) is a measure of the reliability of a survey statistic. The smaller the relative standard error, the more precise the estimate.
(8) Estimate not released.
(9) The location quotient is the ratio of the area concentration of occupational employment to the national average concentration. A location quotient greater than one indicates the occupation has a higher share of employment than average, and a location quotient less than one indicates the occupation is less prevalent in the area than average.
Other OES estimates and related information:
May 2019 National Occupational Employment and Wage Estimates
May 2019 State Occupational Employment and Wage Estimates
May 2019 Metropolitan and Nonmetropolitan Area Occupational Employment and Wage Estimates
May 2019 National Industry-Specific Occupational Employment and Wage Estimates
Last Modified Date: July 6, 2020