
An official website of the United States government
An official website of the United States government
The .gov means it's official.
Federal government websites often end in .gov or .mil. Before sharing sensitive information,
make sure you're on a federal government site.
The site is secure.
The
https:// ensures that you are connecting to the official website and that any
information you provide is encrypted and transmitted securely.
This major group comprises the following occupations: First-Line Supervisors of Housekeeping and Janitorial Workers ; First-Line Supervisors of Landscaping, Lawn Service, and Groundskeeping Workers ; Janitors and Cleaners, Except Maids and Housekeeping Cleaners ; Maids and Housekeeping Cleaners ; Building Cleaning Workers, All Other ; Pest Control Workers ; Landscaping and Groundskeeping Workers ; Pesticide Handlers, Sprayers, and Applicators, Vegetation ; Tree Trimmers and Pruners ; Grounds Maintenance Workers, All Other
Employment estimate and mean wage estimates for this major group:
| Employment (1) | Employment RSE (3) |
Mean hourly wage |
Mean annual wage (2) |
Wage RSE (3) |
|---|---|---|---|---|
| 4,429,100 | 0.3 % | $15.03 | $31,250 | 0.2 % |
Percentile wage estimates for this major group:
| Percentile | 10% | 25% | 50% (Median) |
75% | 90% |
|---|---|---|---|---|---|
| Hourly Wage | $9.55 | $11.24 | $13.62 | $17.55 | $22.92 |
| Annual Wage (2) | $19,860 | $23,390 | $28,330 | $36,510 | $47,670 |
Industries with the highest published employment and wages for this occupation are provided. For a list of all industries with employment in this occupation, see the Create Customized Tables function.
Industries with the highest levels of employment in this occupation:
| Industry | Employment (1) | Percent of industry employment | Hourly mean wage | Annual mean wage (2) |
|---|---|---|---|---|
| Services to Buildings and Dwellings | 1,814,090 | 82.77 | $15.15 | $31,510 |
| Traveler Accommodation | 565,820 | 27.56 | $13.47 | $28,010 |
| Elementary and Secondary Schools | 342,270 | 3.98 | $16.51 | $34,350 |
| Local Government, excluding schools and hospitals (OES Designation) | 182,420 | 3.29 | $17.97 | $37,370 |
| General Medical and Surgical Hospitals | 174,730 | 3.13 | $15.08 | $31,370 |
Industries with the highest concentration of employment in this occupation:
| Industry | Employment (1) | Percent of industry employment | Hourly mean wage | Annual mean wage (2) |
|---|---|---|---|---|
| Services to Buildings and Dwellings | 1,814,090 | 82.77 | $15.15 | $31,510 |
| Rooming and Boarding Houses | 3,250 | 27.81 | $14.07 | $29,270 |
| Traveler Accommodation | 565,820 | 27.56 | $13.47 | $28,010 |
| Facilities Support Services | 37,620 | 22.86 | $13.84 | $28,780 |
| RV (Recreational Vehicle) Parks and Recreational Camps | 9,530 | 16.11 | $12.99 | $27,030 |
Top paying industries for this occupation:
| Industry | Employment (1) | Percent of industry employment | Hourly mean wage | Annual mean wage (2) |
|---|---|---|---|---|
| Natural Gas Distribution | 50 | 0.04 | $25.87 | $53,810 |
| Postal Service (federal government) | 14,560 | 2.31 | $24.94 | $51,880 |
| Support Activities for Water Transportation | 170 | 0.18 | $22.50 | $46,810 |
| Monetary Authorities-Central Bank | 50 | 0.26 | $22.38 | $46,550 |
| Highway, Street, and Bridge Construction | 1,870 | 0.53 | $22.18 | $46,140 |
States and areas with the highest published employment, location quotients, and wages for this occupation are provided. For a list of all areas with employment in this occupation, see the Create Customized Tables function.
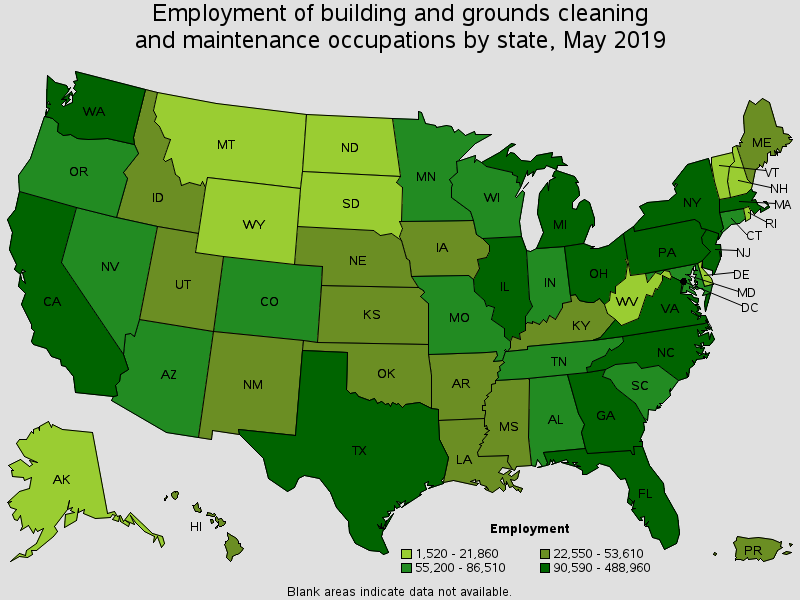
States with the highest employment level in this occupation:
| State | Employment (1) | Employment per thousand jobs | Location quotient (9) | Hourly mean wage | Annual mean wage (2) |
|---|---|---|---|---|---|
| California | 488,960 | 28.13 | 0.93 | $17.46 | $36,320 |
| Texas | 340,670 | 27.40 | 0.91 | $13.10 | $27,250 |
| Florida | 321,970 | 36.61 | 1.21 | $13.61 | $28,300 |
| New York | 311,150 | 32.67 | 1.08 | $18.19 | $37,840 |
| Illinois | 172,840 | 28.68 | 0.95 | $15.35 | $31,920 |
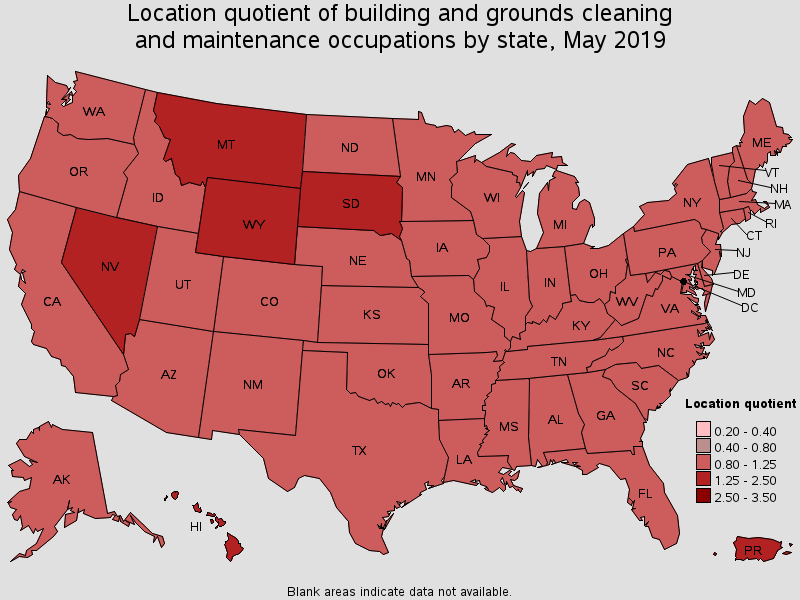
States with the highest concentration of jobs and location quotients in this occupation:
| State | Employment (1) | Employment per thousand jobs | Location quotient (9) | Hourly mean wage | Annual mean wage (2) |
|---|---|---|---|---|---|
| Hawaii | 36,220 | 57.00 | 1.89 | $18.19 | $37,840 |
| Nevada | 70,720 | 50.78 | 1.68 | $15.71 | $32,670 |
| Montana | 19,490 | 41.64 | 1.38 | $14.26 | $29,650 |
| South Dakota | 17,170 | 40.38 | 1.34 | $13.14 | $27,340 |
| Wyoming | 10,950 | 40.05 | 1.33 | $14.93 | $31,050 |
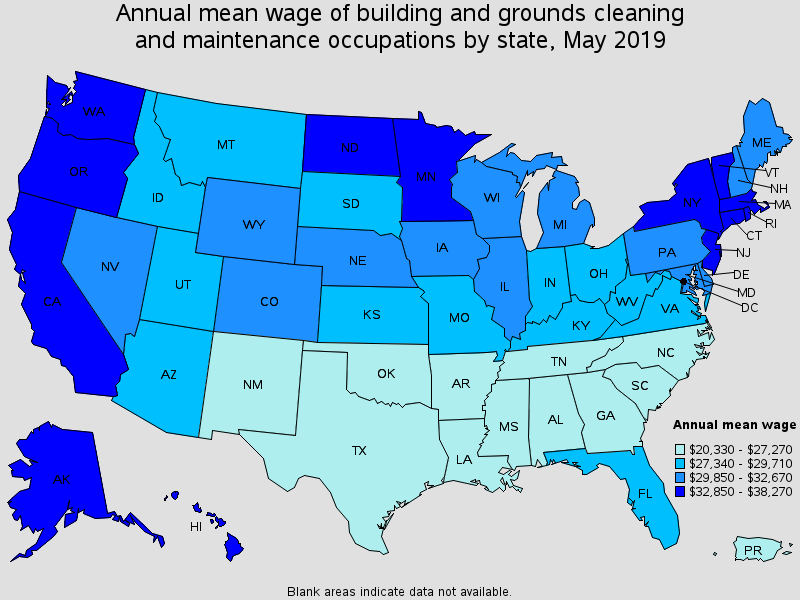
Top paying States for this occupation:
| State | Employment (1) | Employment per thousand jobs | Location quotient (9) | Hourly mean wage | Annual mean wage (2) |
|---|---|---|---|---|---|
| Massachusetts | 107,080 | 29.58 | 0.98 | $18.40 | $38,270 |
| New York | 311,150 | 32.67 | 1.08 | $18.19 | $37,840 |
| Hawaii | 36,220 | 57.00 | 1.89 | $18.19 | $37,840 |
| District of Columbia | 21,490 | 29.71 | 0.99 | $18.04 | $37,530 |
| Connecticut | 55,830 | 33.53 | 1.11 | $17.76 | $36,930 |
Metropolitan areas with the highest employment level in this occupation:
| Metropolitan area | Employment (1) | Employment per thousand jobs | Location quotient (9) | Hourly mean wage | Annual mean wage (2) |
|---|---|---|---|---|---|
| New York-Newark-Jersey City, NY-NJ-PA | 312,060 | 32.32 | 1.07 | $18.48 | $38,440 |
| Los Angeles-Long Beach-Anaheim, CA | 165,810 | 26.57 | 0.88 | $17.16 | $35,690 |
| Chicago-Naperville-Elgin, IL-IN-WI | 133,880 | 28.63 | 0.95 | $15.66 | $32,570 |
| Washington-Arlington-Alexandria, DC-VA-MD-WV | 103,140 | 32.44 | 1.08 | $16.36 | $34,030 |
| Miami-Fort Lauderdale-West Palm Beach, FL | 92,370 | 34.96 | 1.16 | $13.51 | $28,100 |
| Dallas-Fort Worth-Arlington, TX | 91,180 | 24.93 | 0.83 | $14.26 | $29,670 |
| Houston-The Woodlands-Sugar Land, TX | 87,320 | 28.61 | 0.95 | $12.83 | $26,680 |
| Philadelphia-Camden-Wilmington, PA-NJ-DE-MD | 82,120 | 28.55 | 0.95 | $15.91 | $33,090 |
| Boston-Cambridge-Nashua, MA-NH | 80,960 | 28.94 | 0.96 | $18.60 | $38,690 |
| San Francisco-Oakland-Hayward, CA | 66,440 | 26.88 | 0.89 | $20.16 | $41,940 |
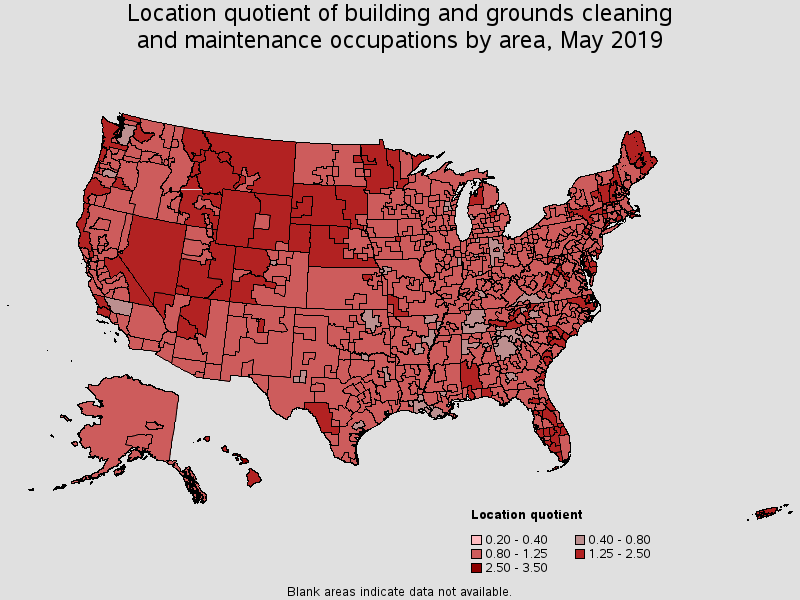
Metropolitan areas with the highest concentration of jobs and location quotients in this occupation:
| Metropolitan area | Employment (1) | Employment per thousand jobs | Location quotient (9) | Hourly mean wage | Annual mean wage (2) |
|---|---|---|---|---|---|
| Kahului-Wailuku-Lahaina, HI | 6,760 | 88.61 | 2.94 | $18.75 | $39,000 |
| Ocean City, NJ | 2,810 | 70.94 | 2.35 | $14.97 | $31,130 |
| Naples-Immokalee-Marco Island, FL | 9,580 | 63.36 | 2.10 | $15.97 | $33,220 |
| Myrtle Beach-Conway-North Myrtle Beach, SC-NC | 10,070 | 60.14 | 1.99 | $12.19 | $25,350 |
| Sebastian-Vero Beach, FL | 3,020 | 57.00 | 1.89 | $14.05 | $29,230 |
| Las Vegas-Henderson-Paradise, NV | 57,370 | 56.25 | 1.87 | $16.03 | $33,350 |
| Hilton Head Island-Bluffton-Beaufort, SC | 4,410 | 56.17 | 1.86 | $15.88 | $33,030 |
| Atlantic City-Hammonton, NJ | 7,110 | 53.87 | 1.79 | $15.12 | $31,450 |
| Barnstable Town, MA | 5,270 | 50.67 | 1.68 | $18.82 | $39,140 |
| Flagstaff, AZ | 3,110 | 50.06 | 1.66 | $13.63 | $28,340 |
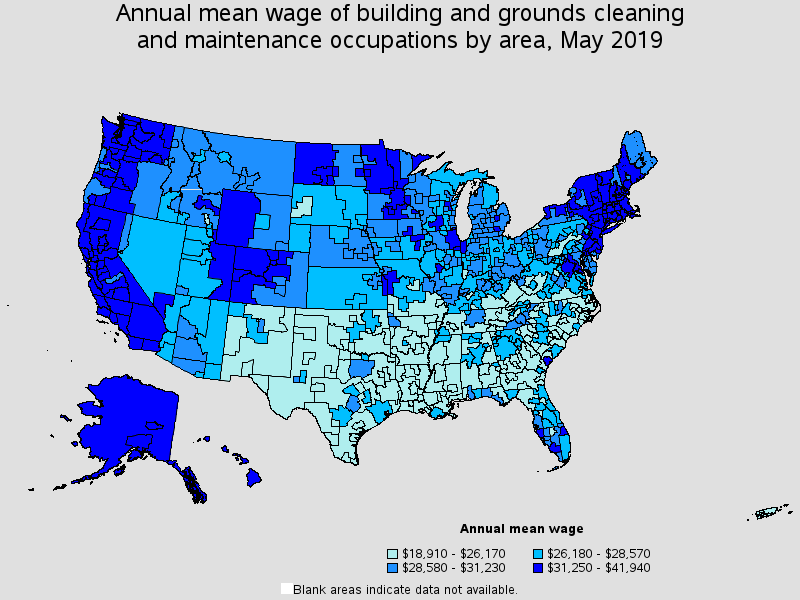
Top paying metropolitan areas for this occupation:
| Metropolitan area | Employment (1) | Employment per thousand jobs | Location quotient (9) | Hourly mean wage | Annual mean wage (2) |
|---|---|---|---|---|---|
| San Francisco-Oakland-Hayward, CA | 66,440 | 26.88 | 0.89 | $20.16 | $41,940 |
| San Jose-Sunnyvale-Santa Clara, CA | 29,900 | 26.21 | 0.87 | $19.12 | $39,770 |
| Barnstable Town, MA | 5,270 | 50.67 | 1.68 | $18.82 | $39,140 |
| Seattle-Tacoma-Bellevue, WA | 48,270 | 23.88 | 0.79 | $18.75 | $39,010 |
| Kahului-Wailuku-Lahaina, HI | 6,760 | 88.61 | 2.94 | $18.75 | $39,000 |
| Boston-Cambridge-Nashua, MA-NH | 80,960 | 28.94 | 0.96 | $18.60 | $38,690 |
| New York-Newark-Jersey City, NY-NJ-PA | 312,060 | 32.32 | 1.07 | $18.48 | $38,440 |
| New Haven, CT | 9,590 | 33.70 | 1.12 | $18.43 | $38,330 |
| Urban Honolulu, HI | 21,960 | 47.98 | 1.59 | $18.16 | $37,780 |
| Santa Rosa, CA | 7,280 | 35.02 | 1.16 | $17.98 | $37,400 |
Nonmetropolitan areas with the highest employment in this occupation:
| Nonmetropolitan area | Employment (1) | Employment per thousand jobs | Location quotient (9) | Hourly mean wage | Annual mean wage (2) |
|---|---|---|---|---|---|
| Kansas nonmetropolitan area | 12,570 | 31.89 | 1.06 | $12.93 | $26,890 |
| North Northeastern Ohio non-metropolitan area (non-contiguous) | 10,340 | 30.94 | 1.03 | $13.41 | $27,900 |
| Piedmont North Carolina nonmetropolitan area | 8,710 | 33.52 | 1.11 | $12.17 | $25,320 |
| Southeast Coastal North Carolina nonmetropolitan area | 8,410 | 33.80 | 1.12 | $12.38 | $25,740 |
| Balance of Lower Peninsula of Michigan nonmetropolitan area | 8,400 | 30.75 | 1.02 | $14.33 | $29,810 |
Nonmetropolitan areas with the highest concentration of jobs and location quotients in this occupation:
| Nonmetropolitan area | Employment (1) | Employment per thousand jobs | Location quotient (9) | Hourly mean wage | Annual mean wage (2) |
|---|---|---|---|---|---|
| Hawaii / Kauai nonmetropolitan area | 7,500 | 73.87 | 2.45 | $17.79 | $37,000 |
| Northwest Colorado nonmetropolitan area | 8,200 | 66.72 | 2.21 | $17.17 | $35,710 |
| Massachusetts nonmetropolitan area | 3,590 | 59.09 | 1.96 | $20.12 | $41,840 |
| South Florida nonmetropolitan area | 4,320 | 55.44 | 1.84 | $14.14 | $29,400 |
| Northeast Minnesota nonmetropolitan area | 2,300 | 52.88 | 1.75 | $15.73 | $32,710 |
Top paying nonmetropolitan areas for this occupation:
| Nonmetropolitan area | Employment (1) | Employment per thousand jobs | Location quotient (9) | Hourly mean wage | Annual mean wage (2) |
|---|---|---|---|---|---|
| Massachusetts nonmetropolitan area | 3,590 | 59.09 | 1.96 | $20.12 | $41,840 |
| Western Washington nonmetropolitan area | 4,840 | 39.38 | 1.31 | $18.17 | $37,780 |
| Connecticut nonmetropolitan area | 1,530 | 46.88 | 1.55 | $18.02 | $37,480 |
| Hawaii / Kauai nonmetropolitan area | 7,500 | 73.87 | 2.45 | $17.79 | $37,000 |
| Northwest Colorado nonmetropolitan area | 8,200 | 66.72 | 2.21 | $17.17 | $35,710 |
These estimates are calculated with data collected from employers in all industry sectors, all metropolitan and nonmetropolitan areas, and all states and the District of Columbia.
The percentile wage estimate is the value of a wage below which a certain percent of workers fall. The median wage is the 50th percentile wage estimate--50 percent of workers earn less than the median and 50 percent of workers earn more than the median. More about percentile wages.
(1) Estimates for detailed occupations do not sum to the totals because the totals include occupations not shown separately. Estimates do not include self-employed workers.
(2) Annual wages have been calculated by multiplying the hourly mean wage by a "year-round, full-time" hours figure of 2,080 hours; for those occupations where there is not an hourly wage published, the annual wage has been directly calculated from the reported survey data.
(3) The relative standard error (RSE) is a measure of the reliability of a survey statistic. The smaller the relative standard error, the more precise the estimate.
(9) The location quotient is the ratio of the area concentration of occupational employment to the national average concentration. A location quotient greater than one indicates the occupation has a higher share of employment than average, and a location quotient less than one indicates the occupation is less prevalent in the area than average.
Other OES estimates and related information:
May 2019 National Occupational Employment and Wage Estimates
May 2019 State Occupational Employment and Wage Estimates
May 2019 Metropolitan and Nonmetropolitan Area Occupational Employment and Wage Estimates
May 2019 National Industry-Specific Occupational Employment and Wage Estimates
Last Modified Date: July 6, 2020