
An official website of the United States government
An official website of the United States government
The .gov means it's official.
Federal government websites often end in .gov or .mil. Before sharing sensitive information,
make sure you're on a federal government site.
The site is secure.
The
https:// ensures that you are connecting to the official website and that any
information you provide is encrypted and transmitted securely.
Perform a variety of attending duties at amusement or recreation facility. May schedule use of recreation facilities, maintain and provide equipment to participants of sporting events or recreational pursuits, or operate amusement concessions and rides.
Employment estimate and mean wage estimates for this occupation:
| Employment (1) | Employment RSE (3) |
Mean hourly wage |
Mean annual wage (2) |
Wage RSE (3) |
|---|---|---|---|---|
| 338,110 | 2.6 % | $11.70 | $24,330 | 0.4 % |
Percentile wage estimates for this occupation:
| Percentile | 10% | 25% | 50% (Median) |
75% | 90% |
|---|---|---|---|---|---|
| Hourly Wage | $8.57 | $9.40 | $11.23 | $12.83 | $15.45 |
| Annual Wage (2) | $17,820 | $19,560 | $23,370 | $26,680 | $32,130 |
Industries with the highest published employment and wages for this occupation are provided. For a list of all industries with employment in this occupation, see the Create Customized Tables function.
Industries with the highest levels of employment in this occupation:
| Industry | Employment (1) | Percent of industry employment | Hourly mean wage | Annual mean wage (2) |
|---|---|---|---|---|
| Other Amusement and Recreation Industries | 168,990 | 12.52 | $11.56 | $24,040 |
| Amusement Parks and Arcades | 52,320 | 24.09 | $11.15 | $23,180 |
| Local Government, excluding schools and hospitals (OES Designation) | 40,760 | 0.74 | $11.90 | $24,740 |
| Traveler Accommodation | 15,520 | 0.76 | $12.51 | $26,010 |
| Spectator Sports | 6,980 | 4.75 | $12.57 | $26,140 |
Industries with the highest concentration of employment in this occupation:
| Industry | Employment (1) | Percent of industry employment | Hourly mean wage | Annual mean wage (2) |
|---|---|---|---|---|
| Amusement Parks and Arcades | 52,320 | 24.09 | $11.15 | $23,180 |
| Other Amusement and Recreation Industries | 168,990 | 12.52 | $11.56 | $24,040 |
| Scenic and Sightseeing Transportation, Other | 160 | 5.41 | $13.27 | $27,610 |
| Spectator Sports | 6,980 | 4.75 | $12.57 | $26,140 |
| Promoters of Performing Arts, Sports, and Similar Events | 5,420 | 3.45 | $11.61 | $24,150 |
Top paying industries for this occupation:
| Industry | Employment (1) | Percent of industry employment | Hourly mean wage | Annual mean wage (2) |
|---|---|---|---|---|
| Other Support Services | 200 | 0.06 | $15.62 | $32,490 |
| Religious Organizations | 40 | 0.02 | $15.27 | $31,770 |
| Grantmaking and Giving Services | 90 | 0.06 | $14.39 | $29,930 |
| Individual and Family Services | 620 | 0.02 | $14.11 | $29,340 |
| Food and Beverage Stores (4451 and 4452 only) | (8) | (8) | $14.02 | $29,160 |
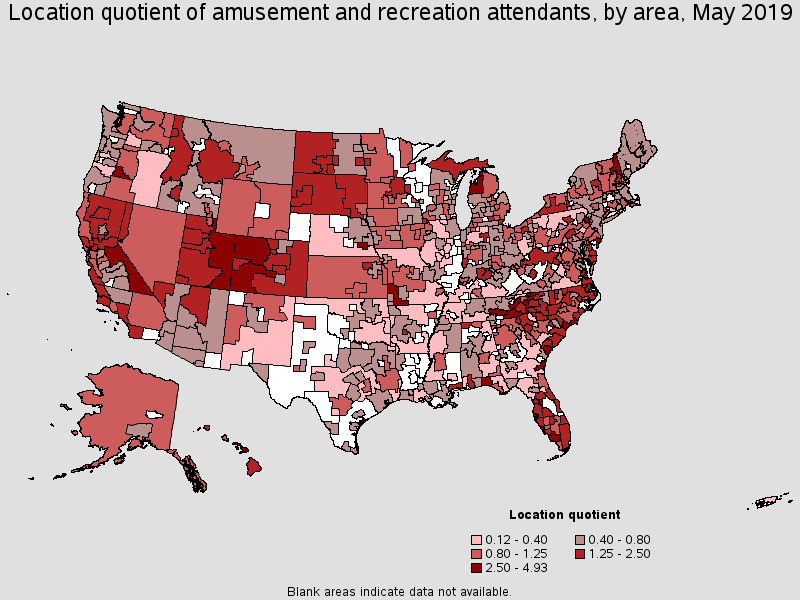
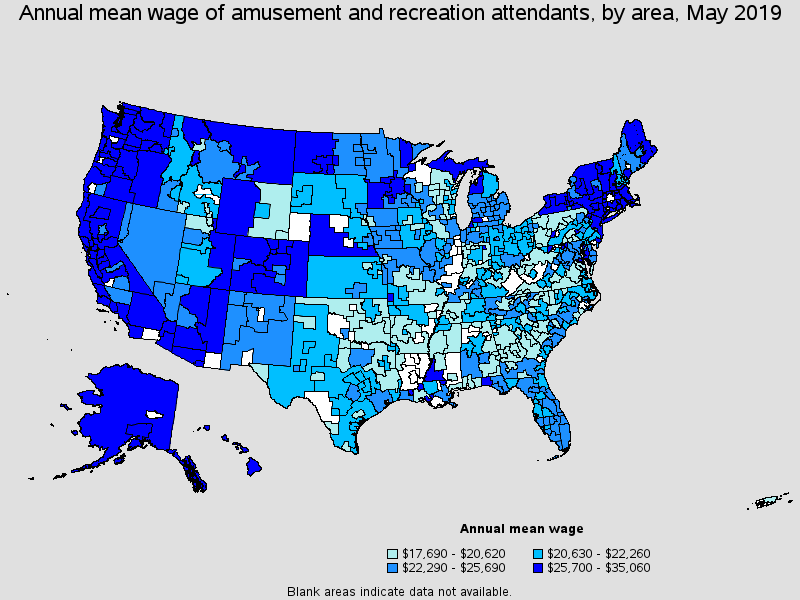
States and areas with the highest published employment, location quotients, and wages for this occupation are provided. For a list of all areas with employment in this occupation, see the Create Customized Tables function.
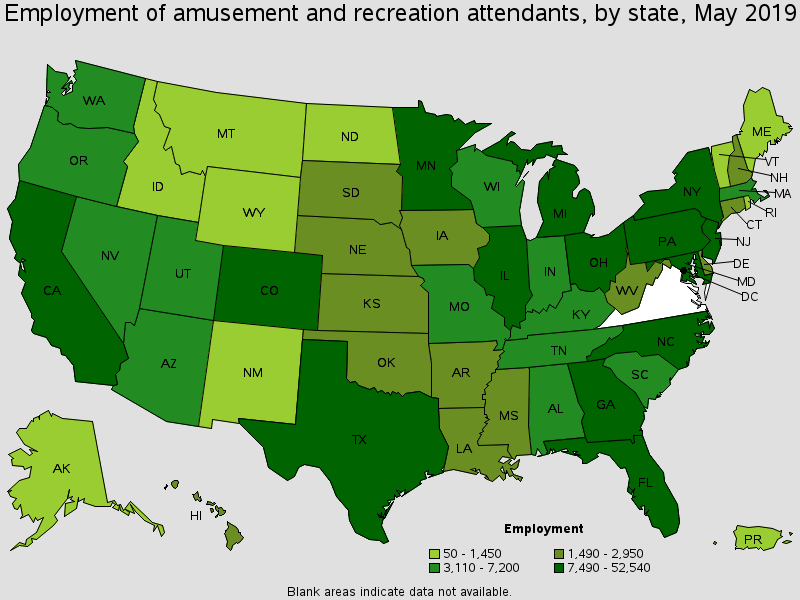
States with the highest employment level in this occupation:
| State | Employment (1) | Employment per thousand jobs | Location quotient (9) | Hourly mean wage | Annual mean wage (2) |
|---|---|---|---|---|---|
| California | 52,540 | 3.02 | 1.31 | $13.51 | $28,100 |
| Florida | 39,010 | 4.44 | 1.93 | $11.23 | $23,360 |
| Texas | 18,570 | 1.49 | 0.65 | $10.76 | $22,380 |
| New York | 18,390 | 1.93 | 0.84 | $13.53 | $28,140 |
| North Carolina | 17,470 | 3.91 | 1.70 | $10.11 | $21,040 |
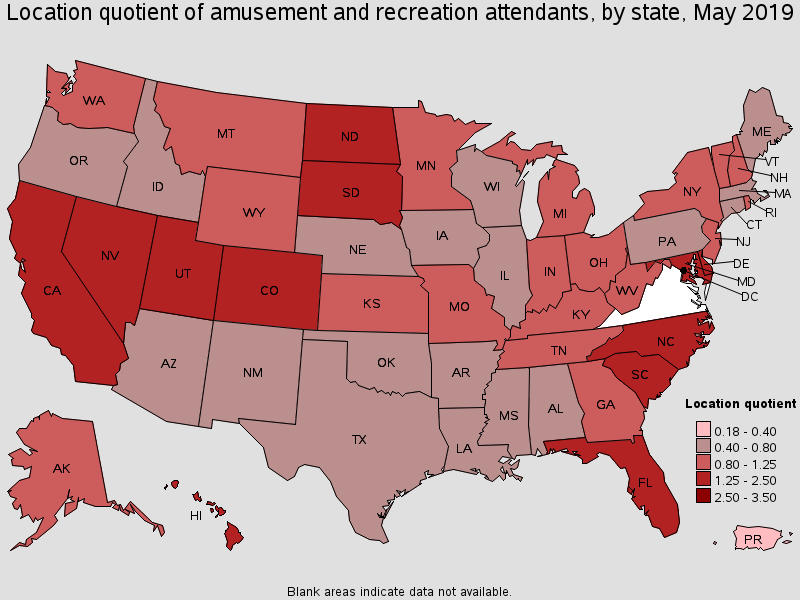
States with the highest concentration of jobs and location quotients in this occupation:
| State | Employment (1) | Employment per thousand jobs | Location quotient (9) | Hourly mean wage | Annual mean wage (2) |
|---|---|---|---|---|---|
| Utah | 6,720 | 4.47 | 1.94 | $11.06 | $23,000 |
| Florida | 39,010 | 4.44 | 1.93 | $11.23 | $23,360 |
| Colorado | 10,690 | 3.99 | 1.73 | $12.93 | $26,890 |
| North Carolina | 17,470 | 3.91 | 1.70 | $10.11 | $21,040 |
| South Dakota | 1,570 | 3.70 | 1.61 | $10.60 | $22,050 |
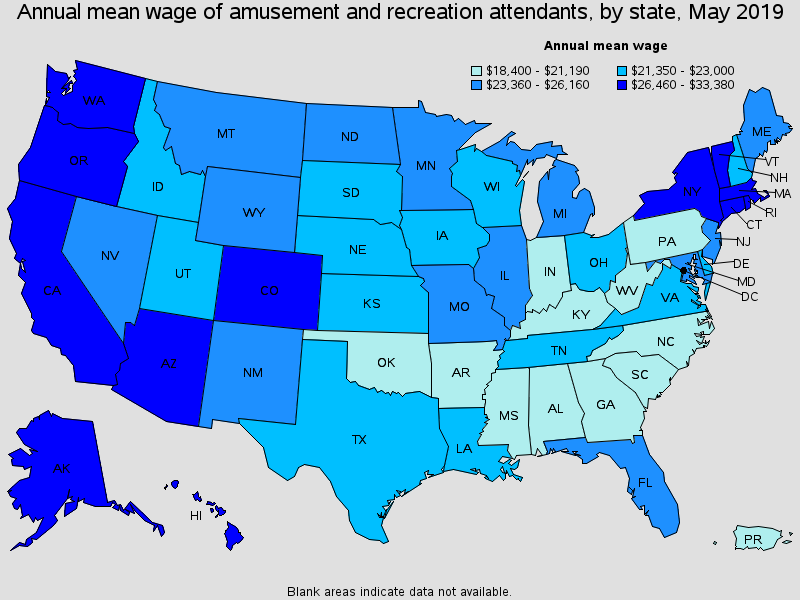
Top paying States for this occupation:
| State | Employment (1) | Employment per thousand jobs | Location quotient (9) | Hourly mean wage | Annual mean wage (2) |
|---|---|---|---|---|---|
| District of Columbia | 300 | 0.42 | 0.18 | $16.05 | $33,380 |
| Washington | 6,560 | 1.98 | 0.86 | $14.78 | $30,730 |
| Hawaii | 2,190 | 3.44 | 1.50 | $14.70 | $30,580 |
| Massachusetts | 5,030 | 1.39 | 0.60 | $14.09 | $29,310 |
| New York | 18,390 | 1.93 | 0.84 | $13.53 | $28,140 |
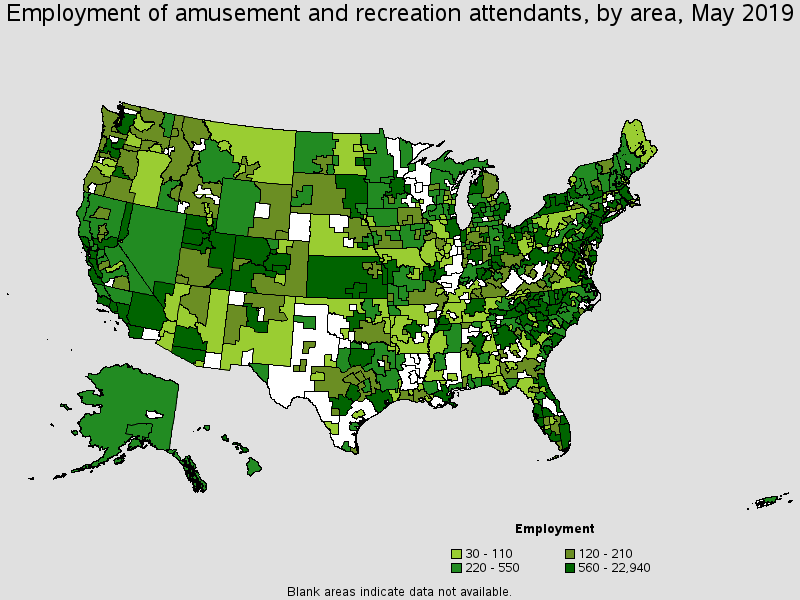
Metropolitan areas with the highest employment level in this occupation:
| Metropolitan area | Employment (1) | Employment per thousand jobs | Location quotient (9) | Hourly mean wage | Annual mean wage (2) |
|---|---|---|---|---|---|
| Los Angeles-Long Beach-Anaheim, CA | 22,940 | 3.68 | 1.60 | $13.57 | $28,230 |
| New York-Newark-Jersey City, NY-NJ-PA | 17,090 | 1.77 | 0.77 | $13.08 | $27,210 |
| Miami-Fort Lauderdale-West Palm Beach, FL | 9,720 | 3.68 | 1.60 | $11.37 | $23,650 |
| Washington-Arlington-Alexandria, DC-VA-MD-WV | 8,110 | 2.55 | 1.11 | $11.46 | $23,830 |
| Chicago-Naperville-Elgin, IL-IN-WI | 7,090 | 1.52 | 0.66 | $11.84 | $24,630 |
| Dallas-Fort Worth-Arlington, TX | 6,550 | 1.79 | 0.78 | $11.13 | $23,150 |
| San Francisco-Oakland-Hayward, CA | 6,340 | 2.57 | 1.11 | $14.26 | $29,650 |
| Denver-Aurora-Lakewood, CO | 6,300 | 4.16 | 1.81 | $12.57 | $26,150 |
| Atlanta-Sandy Springs-Roswell, GA | 6,200 | 2.26 | 0.98 | $9.84 | $20,480 |
| Minneapolis-St. Paul-Bloomington, MN-WI | 5,760 | 2.92 | 1.27 | $12.53 | $26,060 |
Metropolitan areas with the highest concentration of jobs and location quotients in this occupation:
| Metropolitan area | Employment (1) | Employment per thousand jobs | Location quotient (9) | Hourly mean wage | Annual mean wage (2) |
|---|---|---|---|---|---|
| Hilton Head Island-Bluffton-Beaufort, SC | 720 | 9.17 | 3.98 | $10.60 | $22,040 |
| Myrtle Beach-Conway-North Myrtle Beach, SC-NC | 1,500 | 8.96 | 3.89 | $10.02 | $20,850 |
| Atlantic City-Hammonton, NJ | 1,130 | 8.53 | 3.71 | $16.29 | $33,880 |
| Kahului-Wailuku-Lahaina, HI | 640 | 8.44 | 3.67 | $16.86 | $35,060 |
| The Villages, FL | 220 | 7.35 | 3.19 | $10.74 | $22,330 |
| Bend-Redmond, OR | 560 | 6.68 | 2.90 | $12.56 | $26,110 |
| East Stroudsburg, PA | 370 | 6.59 | 2.86 | $11.06 | $23,000 |
| Naples-Immokalee-Marco Island, FL | 950 | 6.27 | 2.72 | $11.91 | $24,760 |
| Crestview-Fort Walton Beach-Destin, FL | 700 | 6.18 | 2.69 | $12.36 | $25,700 |
| Lincoln, NE | 1,090 | 6.01 | 2.61 | $10.54 | $21,910 |
Top paying metropolitan areas for this occupation:
| Metropolitan area | Employment (1) | Employment per thousand jobs | Location quotient (9) | Hourly mean wage | Annual mean wage (2) |
|---|---|---|---|---|---|
| Kahului-Wailuku-Lahaina, HI | 640 | 8.44 | 3.67 | $16.86 | $35,060 |
| Barnstable Town, MA | 110 | 1.09 | 0.47 | $16.68 | $34,690 |
| Atlantic City-Hammonton, NJ | 1,130 | 8.53 | 3.71 | $16.29 | $33,880 |
| Muncie, IN | 60 | 1.32 | 0.57 | $15.10 | $31,410 |
| Seattle-Tacoma-Bellevue, WA | 4,610 | 2.28 | 0.99 | $15.01 | $31,220 |
| Duluth, MN-WI | 340 | 2.61 | 1.13 | $14.97 | $31,140 |
| Wenatchee, WA | 70 | 1.39 | 0.61 | $14.74 | $30,670 |
| New Haven, CT | 210 | 0.74 | 0.32 | $14.73 | $30,640 |
| Spokane-Spokane Valley, WA | 470 | 1.94 | 0.84 | $14.59 | $30,350 |
| Leominster-Gardner, MA | 70 | 1.24 | 0.54 | $14.43 | $30,020 |
Nonmetropolitan areas with the highest employment in this occupation:
| Nonmetropolitan area | Employment (1) | Employment per thousand jobs | Location quotient (9) | Hourly mean wage | Annual mean wage (2) |
|---|---|---|---|---|---|
| East Tennessee nonmetropolitan area | 1,530 | 11.35 | 4.93 | $11.32 | $23,540 |
| Piedmont North Carolina nonmetropolitan area | 1,390 | 5.36 | 2.33 | $9.63 | $20,040 |
| Northwest Colorado nonmetropolitan area | 1,260 | 10.22 | 4.44 | $15.44 | $32,110 |
| Kansas nonmetropolitan area | 1,010 | 2.56 | 1.11 | $10.13 | $21,080 |
| Mountain North Carolina nonmetropolitan area | 1,000 | 7.77 | 3.38 | $10.82 | $22,510 |
Nonmetropolitan areas with the highest concentration of jobs and location quotients in this occupation:
| Nonmetropolitan area | Employment (1) | Employment per thousand jobs | Location quotient (9) | Hourly mean wage | Annual mean wage (2) |
|---|---|---|---|---|---|
| East Tennessee nonmetropolitan area | 1,530 | 11.35 | 4.93 | $11.32 | $23,540 |
| Northwest Colorado nonmetropolitan area | 1,260 | 10.22 | 4.44 | $15.44 | $32,110 |
| Eastern Utah nonmetropolitan area | 750 | 9.44 | 4.10 | $13.62 | $28,330 |
| Mountain North Carolina nonmetropolitan area | 1,000 | 7.77 | 3.38 | $10.82 | $22,510 |
| Southwest Missouri nonmetropolitan area | 500 | 6.67 | 2.90 | $10.40 | $21,620 |
Top paying nonmetropolitan areas for this occupation:
| Nonmetropolitan area | Employment (1) | Employment per thousand jobs | Location quotient (9) | Hourly mean wage | Annual mean wage (2) |
|---|---|---|---|---|---|
| Northwest Colorado nonmetropolitan area | 1,260 | 10.22 | 4.44 | $15.44 | $32,110 |
| Western Washington nonmetropolitan area | 140 | 1.10 | 0.48 | $15.19 | $31,600 |
| Southwest Louisiana nonmetropolitan area | 70 | 1.03 | 0.45 | $14.54 | $30,230 |
| Eastern Oregon nonmetropolitan area | 40 | 0.63 | 0.27 | $14.34 | $29,830 |
| North Coast Region of California nonmetropolitan area | 270 | 2.54 | 1.11 | $14.18 | $29,490 |
These estimates are calculated with data collected from employers in all industry sectors, all metropolitan and nonmetropolitan areas, and all states and the District of Columbia. The top employment and wage figures are provided above. The complete list is available in the downloadable XLS files.
The percentile wage estimate is the value of a wage below which a certain percent of workers fall. The median wage is the 50th percentile wage estimate--50 percent of workers earn less than the median and 50 percent of workers earn more than the median. More about percentile wages.
(1) Estimates for detailed occupations do not sum to the totals because the totals include occupations not shown separately. Estimates do not include self-employed workers.
(2) Annual wages have been calculated by multiplying the hourly mean wage by a "year-round, full-time" hours figure of 2,080 hours; for those occupations where there is not an hourly wage published, the annual wage has been directly calculated from the reported survey data.
(3) The relative standard error (RSE) is a measure of the reliability of a survey statistic. The smaller the relative standard error, the more precise the estimate.
(8) Estimate not released.
(9) The location quotient is the ratio of the area concentration of occupational employment to the national average concentration. A location quotient greater than one indicates the occupation has a higher share of employment than average, and a location quotient less than one indicates the occupation is less prevalent in the area than average.
Other OES estimates and related information:
May 2019 National Occupational Employment and Wage Estimates
May 2019 State Occupational Employment and Wage Estimates
May 2019 Metropolitan and Nonmetropolitan Area Occupational Employment and Wage Estimates
May 2019 National Industry-Specific Occupational Employment and Wage Estimates
Last Modified Date: July 6, 2020