
An official website of the United States government
An official website of the United States government
The .gov means it's official.
Federal government websites often end in .gov or .mil. Before sharing sensitive information,
make sure you're on a federal government site.
The site is secure.
The
https:// ensures that you are connecting to the official website and that any
information you provide is encrypted and transmitted securely.
This occupation includes the 2018 SOC occupations 39-4012 Crematory Operators and 39-9099 Personal Care and Service Workers, All Other and the 2010 SOC occupation 39-9099 Personal Care and Service Workers, All Other.
Employment estimate and mean wage estimates for this occupation:
| Employment (1) | Employment RSE (3) |
Mean hourly wage |
Mean annual wage (2) |
Wage RSE (3) |
|---|---|---|---|---|
| 61,510 | 3.5 % | $14.03 | $29,190 | 1.3 % |
Percentile wage estimates for this occupation:
| Percentile | 10% | 25% | 50% (Median) |
75% | 90% |
|---|---|---|---|---|---|
| Hourly Wage | $9.22 | $10.98 | $13.04 | $16.13 | $18.90 |
| Annual Wage (2) | $19,180 | $22,840 | $27,130 | $33,540 | $39,310 |
Industries with the highest published employment and wages for this occupation are provided. For a list of all industries with employment in this occupation, see the Create Customized Tables function.
Industries with the highest levels of employment in this occupation:
| Industry | Employment (1) | Percent of industry employment | Hourly mean wage | Annual mean wage (2) |
|---|---|---|---|---|
| Individual and Family Services | 21,030 | 0.83 | $14.27 | $29,690 |
| Personal Care Services | 8,260 | 1.13 | $13.63 | $28,360 |
| Traveler Accommodation | 4,880 | 0.24 | $15.73 | $32,720 |
| Local Government, excluding schools and hospitals (OES Designation) | 3,030 | 0.05 | $13.52 | $28,130 |
| Other Personal Services | 2,080 | 0.58 | $16.01 | $33,310 |
Industries with the highest concentration of employment in this occupation:
| Industry | Employment (1) | Percent of industry employment | Hourly mean wage | Annual mean wage (2) |
|---|---|---|---|---|
| Death Care Services | 1,890 | 1.38 | $17.87 | $37,160 |
| Personal Care Services | 8,260 | 1.13 | $13.63 | $28,360 |
| Individual and Family Services | 21,030 | 0.83 | $14.27 | $29,690 |
| Other Residential Care Facilities | 1,070 | 0.66 | $12.37 | $25,720 |
| Other Personal Services | 2,080 | 0.58 | $16.01 | $33,310 |
Top paying industries for this occupation:
| Industry | Employment (1) | Percent of industry employment | Hourly mean wage | Annual mean wage (2) |
|---|---|---|---|---|
| Performing Arts Companies | 50 | 0.04 | $25.87 | $53,800 |
| Legal Services | (8) | (8) | $20.38 | $42,390 |
| Death Care Services | 1,890 | 1.38 | $17.87 | $37,160 |
| Museums, Historical Sites, and Similar Institutions | (8) | (8) | $17.01 | $35,380 |
| Independent Artists, Writers, and Performers | (8) | (8) | $16.94 | $35,240 |
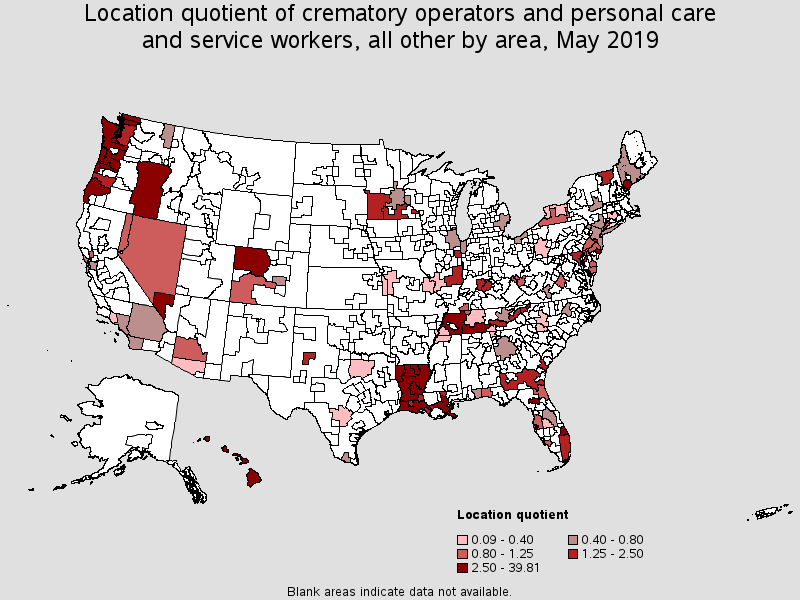
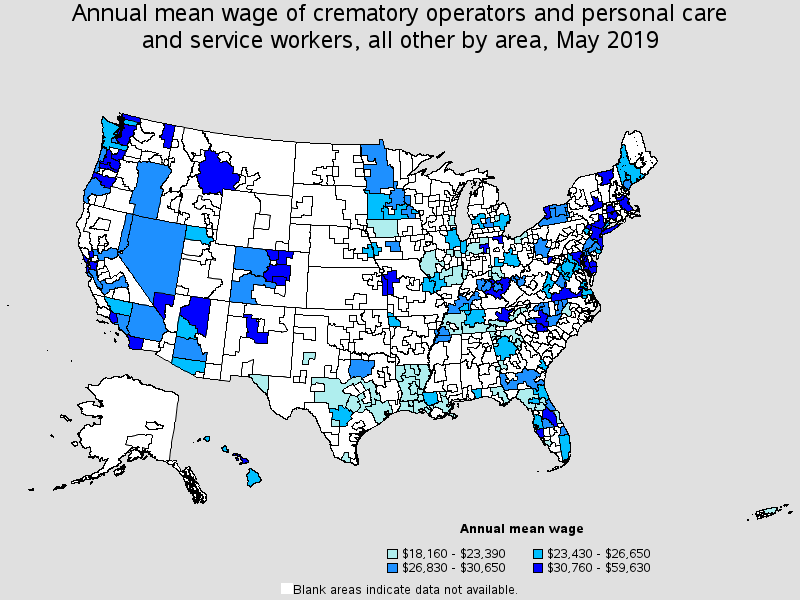
States and areas with the highest published employment, location quotients, and wages for this occupation are provided. For a list of all areas with employment in this occupation, see the Create Customized Tables function.
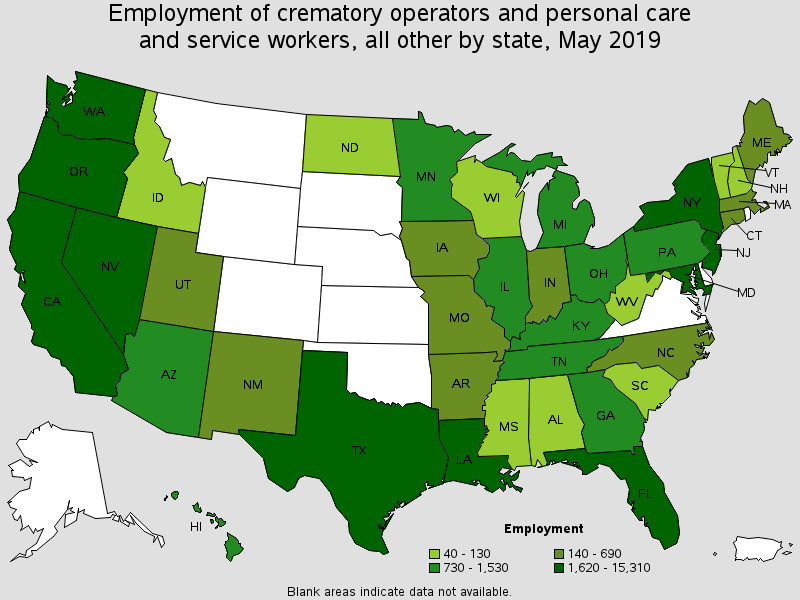
States with the highest employment level in this occupation:
| State | Employment (1) | Employment per thousand jobs | Location quotient (9) | Hourly mean wage | Annual mean wage (2) |
|---|---|---|---|---|---|
| Oregon | 15,310 | 8.03 | 19.18 | $14.96 | $31,120 |
| California | 4,620 | 0.27 | 0.64 | $14.86 | $30,910 |
| Florida | 4,110 | 0.47 | 1.12 | $12.98 | $27,000 |
| Washington | 3,370 | 1.01 | 2.42 | $14.39 | $29,930 |
| Louisiana | 3,120 | 1.62 | 3.87 | $10.10 | $21,000 |
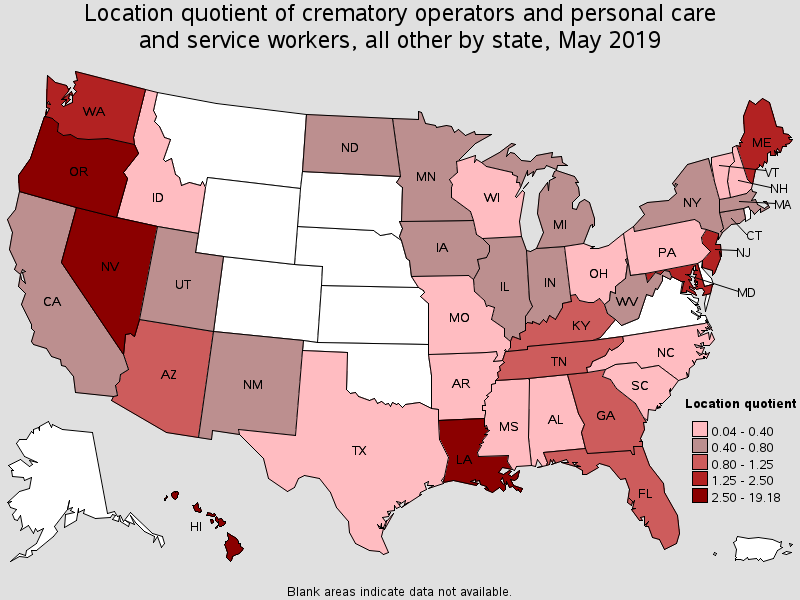
States with the highest concentration of jobs and location quotients in this occupation:
| State | Employment (1) | Employment per thousand jobs | Location quotient (9) | Hourly mean wage | Annual mean wage (2) |
|---|---|---|---|---|---|
| Oregon | 15,310 | 8.03 | 19.18 | $14.96 | $31,120 |
| Nevada | 2,760 | 1.98 | 4.73 | $17.18 | $35,740 |
| Louisiana | 3,120 | 1.62 | 3.87 | $10.10 | $21,000 |
| Hawaii | 930 | 1.47 | 3.50 | $13.07 | $27,180 |
| Washington | 3,370 | 1.01 | 2.42 | $14.39 | $29,930 |
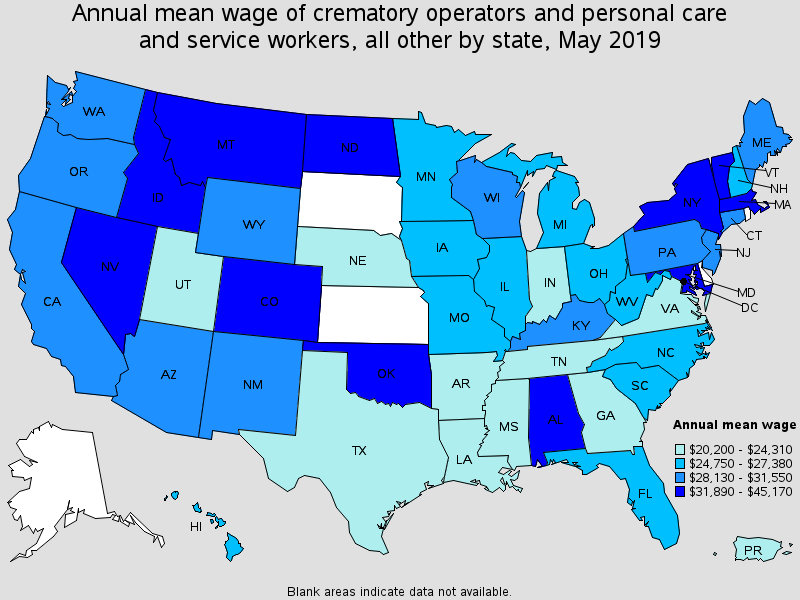
Top paying States for this occupation:
| State | Employment (1) | Employment per thousand jobs | Location quotient (9) | Hourly mean wage | Annual mean wage (2) |
|---|---|---|---|---|---|
| Idaho | 40 | 0.05 | 0.12 | $21.71 | $45,170 |
| New York | 1,880 | 0.20 | 0.47 | $17.71 | $36,830 |
| Nevada | 2,760 | 1.98 | 4.73 | $17.18 | $35,740 |
| Montana | (8) | (8) | (8) | $16.80 | $34,930 |
| Oklahoma | (8) | (8) | (8) | $16.26 | $33,820 |
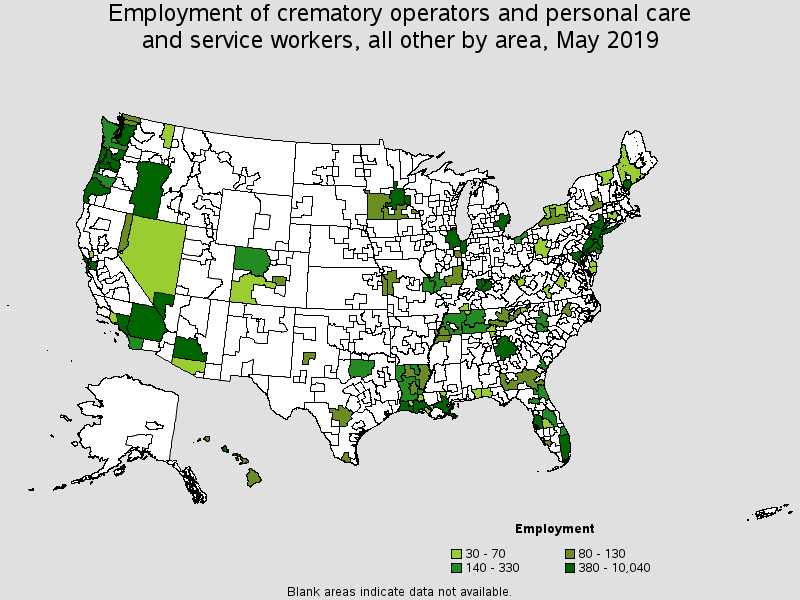
Metropolitan areas with the highest employment level in this occupation:
| Metropolitan area | Employment (1) | Employment per thousand jobs | Location quotient (9) | Hourly mean wage | Annual mean wage (2) |
|---|---|---|---|---|---|
| Portland-Vancouver-Hillsboro, OR-WA | 10,040 | 8.30 | 19.83 | $15.26 | $31,750 |
| New York-Newark-Jersey City, NY-NJ-PA | 3,100 | 0.32 | 0.77 | $16.75 | $34,830 |
| Las Vegas-Henderson-Paradise, NV | 2,590 | 2.54 | 6.06 | $17.42 | $36,230 |
| Salem, OR | 2,050 | 11.82 | 28.23 | $15.10 | $31,400 |
| Seattle-Tacoma-Bellevue, WA | 1,590 | 0.79 | 1.88 | $15.44 | $32,110 |
| Miami-Fort Lauderdale-West Palm Beach, FL | 1,500 | 0.57 | 1.36 | $12.58 | $26,160 |
| Baltimore-Columbia-Towson, MD | 1,350 | 0.98 | 2.34 | $16.10 | $33,480 |
| Los Angeles-Long Beach-Anaheim, CA | 1,340 | 0.21 | 0.51 | $14.39 | $29,940 |
| New Orleans-Metairie, LA | 1,020 | 1.83 | 4.37 | $10.05 | $20,900 |
| Philadelphia-Camden-Wilmington, PA-NJ-DE-MD | 970 | 0.34 | 0.80 | $14.11 | $29,350 |
Metropolitan areas with the highest concentration of jobs and location quotients in this occupation:
| Metropolitan area | Employment (1) | Employment per thousand jobs | Location quotient (9) | Hourly mean wage | Annual mean wage (2) |
|---|---|---|---|---|---|
| Salem, OR | 2,050 | 11.82 | 28.23 | $15.10 | $31,400 |
| Portland-Vancouver-Hillsboro, OR-WA | 10,040 | 8.30 | 19.83 | $15.26 | $31,750 |
| Lake Charles, LA | 440 | 3.83 | 9.15 | $9.37 | $19,490 |
| Las Vegas-Henderson-Paradise, NV | 2,590 | 2.54 | 6.06 | $17.42 | $36,230 |
| Atlantic City-Hammonton, NJ | 320 | 2.44 | 5.83 | $11.39 | $23,680 |
| Port St. Lucie, FL | 330 | 2.21 | 5.29 | $13.80 | $28,700 |
| Mount Vernon-Anacortes, WA | 100 | 2.01 | 4.80 | $12.42 | $25,840 |
| Portland-South Portland, ME | 410 | 1.96 | 4.69 | $14.40 | $29,950 |
| Alexandria, LA | 120 | 1.94 | 4.64 | $10.02 | $20,840 |
| Lafayette, LA | 380 | 1.93 | 4.61 | $9.68 | $20,130 |
Top paying metropolitan areas for this occupation:
| Metropolitan area | Employment (1) | Employment per thousand jobs | Location quotient (9) | Hourly mean wage | Annual mean wage (2) |
|---|---|---|---|---|---|
| Kahului-Wailuku-Lahaina, HI | 120 | 1.59 | 3.81 | $20.20 | $42,020 |
| Las Vegas-Henderson-Paradise, NV | 2,590 | 2.54 | 6.06 | $17.42 | $36,230 |
| Greeley, CO | (8) | (8) | (8) | $17.30 | $35,990 |
| Hartford-West Hartford-East Hartford, CT | 60 | 0.10 | 0.24 | $17.26 | $35,910 |
| San Francisco-Oakland-Hayward, CA | 530 | 0.22 | 0.52 | $16.86 | $35,060 |
| New York-Newark-Jersey City, NY-NJ-PA | 3,100 | 0.32 | 0.77 | $16.75 | $34,830 |
| Napa, CA | 40 | 0.46 | 1.10 | $16.68 | $34,690 |
| North Port-Sarasota-Bradenton, FL | (8) | (8) | (8) | $16.51 | $34,350 |
| Knoxville, TN | 130 | 0.33 | 0.79 | $16.40 | $34,120 |
| Kansas City, MO-KS | 100 | 0.09 | 0.22 | $16.33 | $33,970 |
Nonmetropolitan areas with the highest employment in this occupation:
| Nonmetropolitan area | Employment (1) | Employment per thousand jobs | Location quotient (9) | Hourly mean wage | Annual mean wage (2) |
|---|---|---|---|---|---|
| Coast Oregon nonmetropolitan area | 1,890 | 16.67 | 39.81 | $13.86 | $28,830 |
| Eastern Oregon nonmetropolitan area | 970 | 13.80 | 32.96 | $13.85 | $28,800 |
| West Tennessee nonmetropolitan area | 260 | 2.02 | 4.83 | $9.53 | $19,830 |
| Central Louisiana nonmetropolitan area | 250 | 3.15 | 7.53 | $10.15 | $21,110 |
| Western Washington nonmetropolitan area | 210 | 1.69 | 4.03 | $12.51 | $26,020 |
Nonmetropolitan areas with the highest concentration of jobs and location quotients in this occupation:
| Nonmetropolitan area | Employment (1) | Employment per thousand jobs | Location quotient (9) | Hourly mean wage | Annual mean wage (2) |
|---|---|---|---|---|---|
| Coast Oregon nonmetropolitan area | 1,890 | 16.67 | 39.81 | $13.86 | $28,830 |
| Eastern Oregon nonmetropolitan area | 970 | 13.80 | 32.96 | $13.85 | $28,800 |
| Central Louisiana nonmetropolitan area | 250 | 3.15 | 7.53 | $10.15 | $21,110 |
| West Tennessee nonmetropolitan area | 260 | 2.02 | 4.83 | $9.53 | $19,830 |
| South Central Tennessee nonmetropolitan area | 200 | 1.84 | 4.39 | $10.81 | $22,480 |
Top paying nonmetropolitan areas for this occupation:
| Nonmetropolitan area | Employment (1) | Employment per thousand jobs | Location quotient (9) | Hourly mean wage | Annual mean wage (2) |
|---|---|---|---|---|---|
| Central Kentucky nonmetropolitan area | (8) | (8) | (8) | $28.67 | $59,630 |
| Southwest Montana nonmetropolitan area | (8) | (8) | (8) | $17.80 | $37,020 |
| Southside Virginia nonmetropolitan area | (8) | (8) | (8) | $17.52 | $36,430 |
| Northern Vermont nonmetropolitan area | 40 | 0.56 | 1.34 | $16.45 | $34,210 |
| Maryland nonmetropolitan area | (8) | (8) | (8) | $15.47 | $32,170 |
These estimates are calculated with data collected from employers in all industry sectors, all metropolitan and nonmetropolitan areas, and all states and the District of Columbia. The top employment and wage figures are provided above. The complete list is available in the downloadable XLS files.
The percentile wage estimate is the value of a wage below which a certain percent of workers fall. The median wage is the 50th percentile wage estimate--50 percent of workers earn less than the median and 50 percent of workers earn more than the median. More about percentile wages.
(1) Estimates for detailed occupations do not sum to the totals because the totals include occupations not shown separately. Estimates do not include self-employed workers.
(2) Annual wages have been calculated by multiplying the hourly mean wage by a "year-round, full-time" hours figure of 2,080 hours; for those occupations where there is not an hourly wage published, the annual wage has been directly calculated from the reported survey data.
(3) The relative standard error (RSE) is a measure of the reliability of a survey statistic. The smaller the relative standard error, the more precise the estimate.
(8) Estimate not released.
(9) The location quotient is the ratio of the area concentration of occupational employment to the national average concentration. A location quotient greater than one indicates the occupation has a higher share of employment than average, and a location quotient less than one indicates the occupation is less prevalent in the area than average.
Other OES estimates and related information:
May 2019 National Occupational Employment and Wage Estimates
May 2019 State Occupational Employment and Wage Estimates
May 2019 Metropolitan and Nonmetropolitan Area Occupational Employment and Wage Estimates
May 2019 National Industry-Specific Occupational Employment and Wage Estimates
Last Modified Date: July 6, 2020