
An official website of the United States government
An official website of the United States government
The .gov means it's official.
Federal government websites often end in .gov or .mil. Before sharing sensitive information,
make sure you're on a federal government site.
The site is secure.
The
https:// ensures that you are connecting to the official website and that any
information you provide is encrypted and transmitted securely.
Locate and notify customers of delinquent accounts by mail, telephone, or personal visit to solicit payment. Duties include receiving payment and posting amount to customer�s account, preparing statements to credit department if customer fails to respond, initiating repossession proceedings or service disconnection, and keeping records of collection and status of accounts.
Employment estimate and mean wage estimates for this occupation:
| Employment (1) | Employment RSE (3) |
Mean hourly wage |
Mean annual wage (2) |
Wage RSE (3) |
|---|---|---|---|---|
| 235,870 | 1.6 % | $18.90 | $39,300 | 0.4 % |
Percentile wage estimates for this occupation:
| Percentile | 10% | 25% | 50% (Median) |
75% | 90% |
|---|---|---|---|---|---|
| Hourly Wage | $12.40 | $14.78 | $17.79 | $22.04 | $27.34 |
| Annual Wage (2) | $25,800 | $30,740 | $37,000 | $45,840 | $56,860 |
Industries with the highest published employment and wages for this occupation are provided. For a list of all industries with employment in this occupation, see the Create Customized Tables function.
Industries with the highest levels of employment in this occupation:
| Industry | Employment (1) | Percent of industry employment | Hourly mean wage | Annual mean wage (2) |
|---|---|---|---|---|
| Business Support Services | 76,890 | 8.62 | $17.30 | $35,990 |
| Credit Intermediation and Related Activities (5221 And 5223 only) | 24,020 | 1.17 | $19.16 | $39,850 |
| Nondepository Credit Intermediation | 23,330 | 4.10 | $18.55 | $38,580 |
| Management of Companies and Enterprises | 14,630 | 0.59 | $20.35 | $42,330 |
| General Medical and Surgical Hospitals | 8,760 | 0.16 | $19.21 | $39,970 |
Industries with the highest concentration of employment in this occupation:
| Industry | Employment (1) | Percent of industry employment | Hourly mean wage | Annual mean wage (2) |
|---|---|---|---|---|
| Business Support Services | 76,890 | 8.62 | $17.30 | $35,990 |
| Nondepository Credit Intermediation | 23,330 | 4.10 | $18.55 | $38,580 |
| Credit Intermediation and Related Activities (5221 And 5223 only) | 24,020 | 1.17 | $19.16 | $39,850 |
| Office Administrative Services | 4,010 | 0.80 | $19.68 | $40,930 |
| Accounting, Tax Preparation, Bookkeeping, and Payroll Services | 6,270 | 0.64 | $19.37 | $40,280 |
Top paying industries for this occupation:
| Industry | Employment (1) | Percent of industry employment | Hourly mean wage | Annual mean wage (2) |
|---|---|---|---|---|
| Food and Beverage Stores (4451 and 4452 only) | (8) | (8) | $29.72 | $61,820 |
| Natural Gas Distribution | 420 | 0.39 | $29.58 | $61,520 |
| Electric Power Generation, Transmission and Distribution | 990 | 0.26 | $26.65 | $55,440 |
| Support Activities for Air Transportation | 40 | 0.02 | $26.33 | $54,770 |
| Apparel, Piece Goods, and Notions Merchant Wholesalers | 240 | 0.16 | $25.56 | $53,150 |
States and areas with the highest published employment, location quotients, and wages for this occupation are provided. For a list of all areas with employment in this occupation, see the Create Customized Tables function.
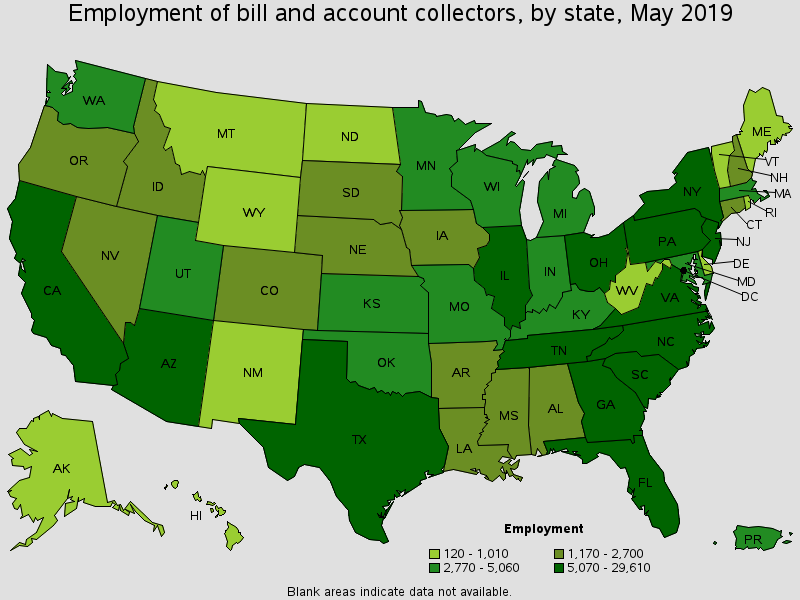
States with the highest employment level in this occupation:
| State | Employment (1) | Employment per thousand jobs | Location quotient (9) | Hourly mean wage | Annual mean wage (2) |
|---|---|---|---|---|---|
| Texas | 29,610 | 2.38 | 1.48 | $17.31 | $36,010 |
| California | 20,350 | 1.17 | 0.73 | $22.05 | $45,850 |
| Florida | 17,650 | 2.01 | 1.25 | $18.14 | $37,730 |
| New York | 14,570 | 1.53 | 0.95 | $20.65 | $42,960 |
| Ohio | 9,890 | 1.82 | 1.13 | $17.77 | $36,960 |
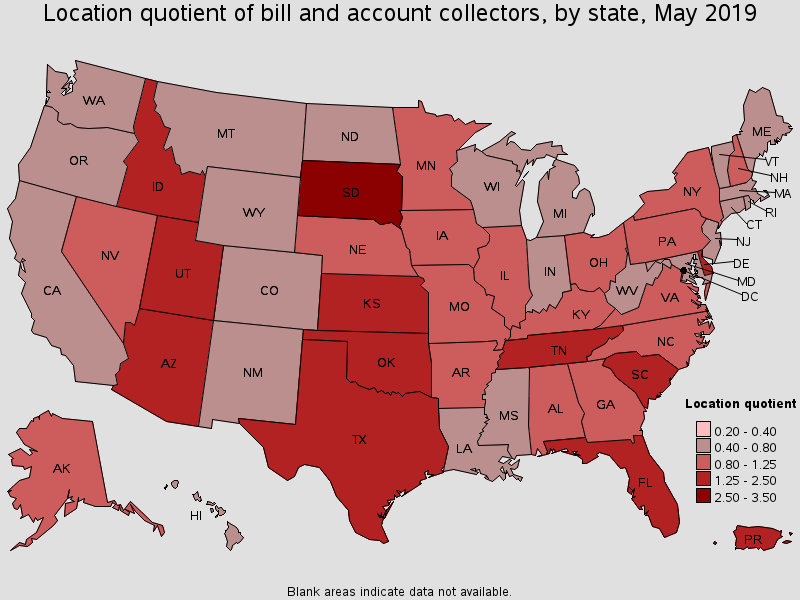
States with the highest concentration of jobs and location quotients in this occupation:
| State | Employment (1) | Employment per thousand jobs | Location quotient (9) | Hourly mean wage | Annual mean wage (2) |
|---|---|---|---|---|---|
| South Dakota | 2,310 | 5.44 | 3.39 | $16.09 | $33,470 |
| South Carolina | 6,530 | 3.10 | 1.93 | $16.85 | $35,040 |
| Arizona | 8,630 | 3.01 | 1.87 | $17.46 | $36,310 |
| Utah | 4,310 | 2.87 | 1.78 | $16.93 | $35,210 |
| Kansas | 3,590 | 2.58 | 1.61 | $16.62 | $34,570 |
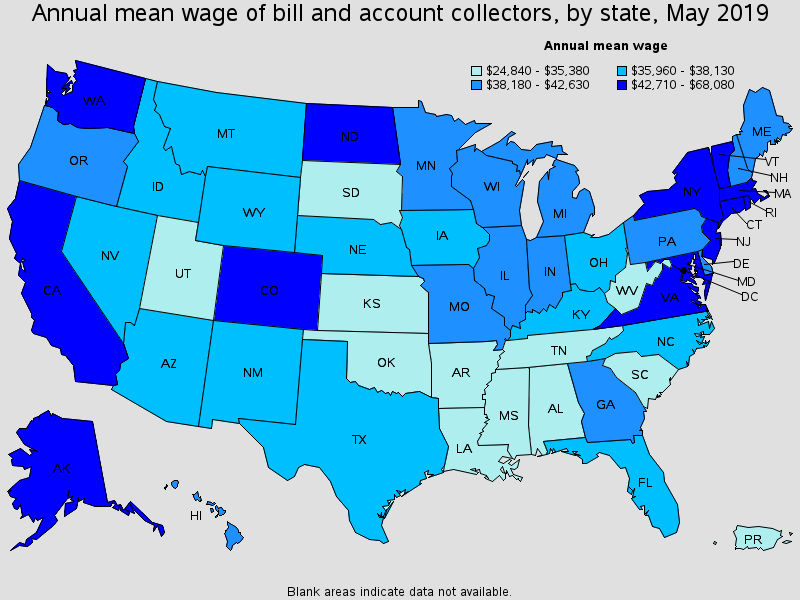
Top paying States for this occupation:
| State | Employment (1) | Employment per thousand jobs | Location quotient (9) | Hourly mean wage | Annual mean wage (2) |
|---|---|---|---|---|---|
| District of Columbia | 280 | 0.39 | 0.24 | $32.73 | $68,080 |
| Alaska | 480 | 1.53 | 0.95 | $25.75 | $53,560 |
| Connecticut | 1,790 | 1.08 | 0.67 | $24.00 | $49,920 |
| Massachusetts | 4,280 | 1.18 | 0.74 | $23.26 | $48,380 |
| California | 20,350 | 1.17 | 0.73 | $22.05 | $45,850 |
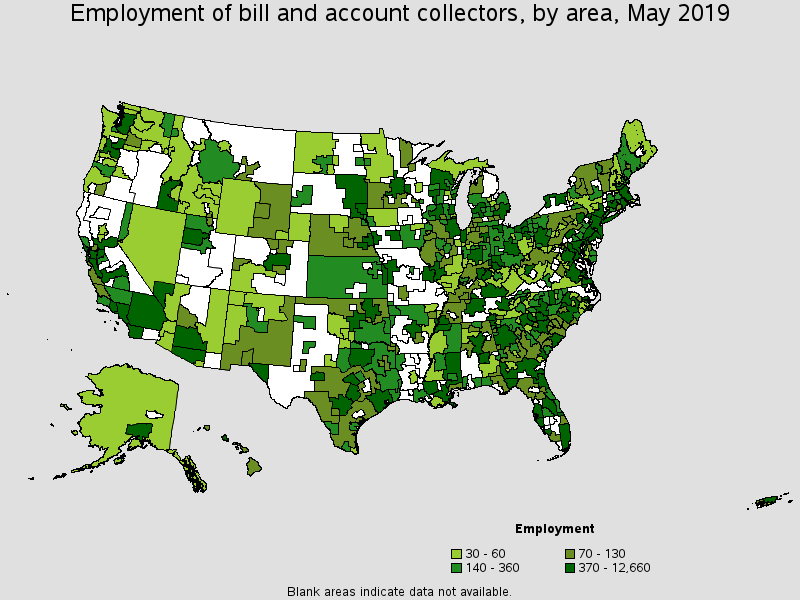
Metropolitan areas with the highest employment level in this occupation:
| Metropolitan area | Employment (1) | Employment per thousand jobs | Location quotient (9) | Hourly mean wage | Annual mean wage (2) |
|---|---|---|---|---|---|
| Dallas-Fort Worth-Arlington, TX | 12,660 | 3.46 | 2.16 | $17.48 | $36,360 |
| New York-Newark-Jersey City, NY-NJ-PA | 11,610 | 1.20 | 0.75 | $22.99 | $47,820 |
| Los Angeles-Long Beach-Anaheim, CA | 8,490 | 1.36 | 0.85 | $22.04 | $45,840 |
| Phoenix-Mesa-Scottsdale, AZ | 7,680 | 3.62 | 2.25 | $17.44 | $36,260 |
| Chicago-Naperville-Elgin, IL-IN-WI | 7,330 | 1.57 | 0.98 | $19.92 | $41,430 |
| Atlanta-Sandy Springs-Roswell, GA | 6,180 | 2.25 | 1.40 | $19.66 | $40,900 |
| Houston-The Woodlands-Sugar Land, TX | 5,920 | 1.94 | 1.21 | $17.54 | $36,480 |
| Philadelphia-Camden-Wilmington, PA-NJ-DE-MD | 5,440 | 1.89 | 1.18 | $19.85 | $41,280 |
| Miami-Fort Lauderdale-West Palm Beach, FL | 5,030 | 1.90 | 1.19 | $19.81 | $41,210 |
| Boston-Cambridge-Nashua, MA-NH | 3,820 | 1.37 | 0.85 | $22.83 | $47,490 |
Metropolitan areas with the highest concentration of jobs and location quotients in this occupation:
| Metropolitan area | Employment (1) | Employment per thousand jobs | Location quotient (9) | Hourly mean wage | Annual mean wage (2) |
|---|---|---|---|---|---|
| Johnson City, TN | 810 | 10.43 | 6.49 | $9.37 | $19,480 |
| Sioux Falls, SD | 1,380 | 8.78 | 5.47 | $16.14 | $33,560 |
| San Angelo, TX | 400 | 8.46 | 5.27 | $16.49 | $34,290 |
| Sebastian-Vero Beach, FL | 380 | 7.13 | 4.44 | $12.81 | $26,650 |
| Buffalo-Cheektowaga-Niagara Falls, NY | 3,460 | 6.29 | 3.92 | $16.03 | $33,340 |
| Rapid City, SD | 320 | 4.93 | 3.07 | (8) | (8) |
| Salt Lake City, UT | 3,570 | 4.85 | 3.02 | $16.77 | $34,890 |
| Jacksonville, FL | 3,160 | 4.49 | 2.79 | $16.47 | $34,260 |
| Carson City, NV | 130 | 4.46 | 2.78 | $16.77 | $34,880 |
| Des Moines-West Des Moines, IA | 1,640 | 4.42 | 2.75 | $18.04 | $37,520 |
Top paying metropolitan areas for this occupation:
| Metropolitan area | Employment (1) | Employment per thousand jobs | Location quotient (9) | Hourly mean wage | Annual mean wage (2) |
|---|---|---|---|---|---|
| Bridgeport-Stamford-Norwalk, CT | 310 | 0.75 | 0.47 | $26.94 | $56,030 |
| San Francisco-Oakland-Hayward, CA | 2,310 | 0.93 | 0.58 | $26.84 | $55,830 |
| Washington-Arlington-Alexandria, DC-VA-MD-WV | 3,290 | 1.03 | 0.64 | $26.40 | $54,910 |
| New Haven, CT | 270 | 0.94 | 0.59 | $25.93 | $53,920 |
| San Jose-Sunnyvale-Santa Clara, CA | 710 | 0.62 | 0.39 | $25.75 | $53,570 |
| Anchorage, AK | 420 | 2.40 | 1.49 | $25.71 | $53,470 |
| Danbury, CT | (8) | (8) | (8) | $25.27 | $52,550 |
| Reno, NV | 190 | 0.77 | 0.48 | $25.00 | $52,000 |
| San Luis Obispo-Paso Robles-Arroyo Grande, CA | 90 | 0.73 | 0.45 | $24.83 | $51,640 |
| Midland, MI | 30 | 0.94 | 0.59 | $24.13 | $50,190 |
Nonmetropolitan areas with the highest employment in this occupation:
| Nonmetropolitan area | Employment (1) | Employment per thousand jobs | Location quotient (9) | Hourly mean wage | Annual mean wage (2) |
|---|---|---|---|---|---|
| South Central Kentucky nonmetropolitan area | 670 | 3.96 | 2.46 | $15.19 | $31,600 |
| Southeast Coastal North Carolina nonmetropolitan area | 620 | 2.48 | 1.54 | $15.90 | $33,070 |
| East South Dakota nonmetropolitan area | 530 | 3.99 | 2.48 | $16.03 | $33,340 |
| South Georgia nonmetropolitan area | 450 | 2.38 | 1.48 | $13.29 | $27,640 |
| Northeastern Wisconsin nonmetropolitan area | 430 | 2.14 | 1.33 | $17.16 | $35,690 |
Nonmetropolitan areas with the highest concentration of jobs and location quotients in this occupation:
| Nonmetropolitan area | Employment (1) | Employment per thousand jobs | Location quotient (9) | Hourly mean wage | Annual mean wage (2) |
|---|---|---|---|---|---|
| East South Dakota nonmetropolitan area | 530 | 3.99 | 2.48 | $16.03 | $33,340 |
| South Central Kentucky nonmetropolitan area | 670 | 3.96 | 2.46 | $15.19 | $31,600 |
| Southeast Coastal North Carolina nonmetropolitan area | 620 | 2.48 | 1.54 | $15.90 | $33,070 |
| Southeast Mississippi nonmetropolitan area | 370 | 2.47 | 1.54 | $17.12 | $35,600 |
| South Georgia nonmetropolitan area | 450 | 2.38 | 1.48 | $13.29 | $27,640 |
Top paying nonmetropolitan areas for this occupation:
| Nonmetropolitan area | Employment (1) | Employment per thousand jobs | Location quotient (9) | Hourly mean wage | Annual mean wage (2) |
|---|---|---|---|---|---|
| Alaska nonmetropolitan area | 50 | 0.45 | 0.28 | $25.64 | $53,330 |
| Eastern Washington nonmetropolitan area | 30 | 0.34 | 0.21 | $23.47 | $48,810 |
| Hawaii / Kauai nonmetropolitan area | 90 | 0.90 | 0.56 | $22.67 | $47,150 |
| Western Washington nonmetropolitan area | 50 | 0.40 | 0.25 | $22.56 | $46,930 |
| East Tennessee nonmetropolitan area | 60 | 0.47 | 0.29 | $21.93 | $45,610 |
These estimates are calculated with data collected from employers in all industry sectors, all metropolitan and nonmetropolitan areas, and all states and the District of Columbia. The top employment and wage figures are provided above. The complete list is available in the downloadable XLS files.
The percentile wage estimate is the value of a wage below which a certain percent of workers fall. The median wage is the 50th percentile wage estimate--50 percent of workers earn less than the median and 50 percent of workers earn more than the median. More about percentile wages.
(1) Estimates for detailed occupations do not sum to the totals because the totals include occupations not shown separately. Estimates do not include self-employed workers.
(2) Annual wages have been calculated by multiplying the hourly mean wage by a "year-round, full-time" hours figure of 2,080 hours; for those occupations where there is not an hourly wage published, the annual wage has been directly calculated from the reported survey data.
(3) The relative standard error (RSE) is a measure of the reliability of a survey statistic. The smaller the relative standard error, the more precise the estimate.
(8) Estimate not released.
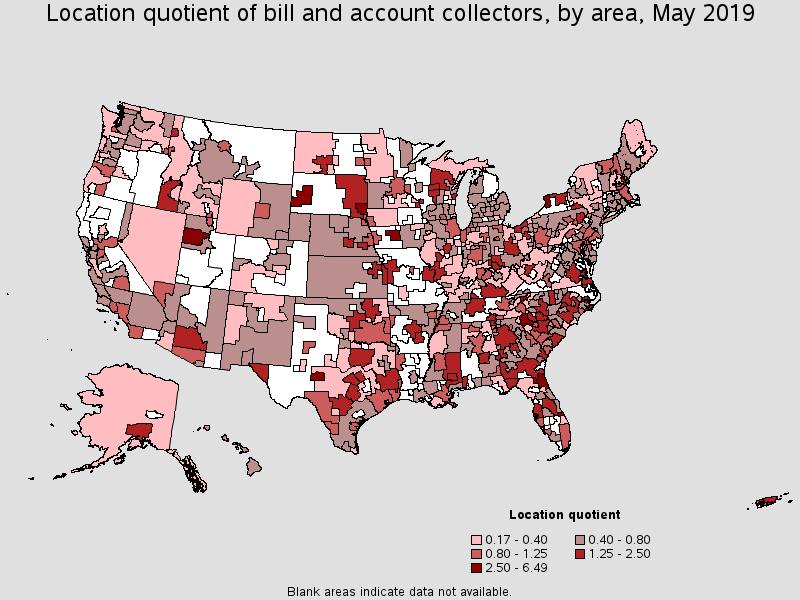
(9) The location quotient is the ratio of the area concentration of occupational employment to the national average concentration. A location quotient greater than one indicates the occupation has a higher share of employment than average, and a location quotient less than one indicates the occupation is less prevalent in the area than average.
Other OES estimates and related information:
May 2019 National Occupational Employment and Wage Estimates
May 2019 State Occupational Employment and Wage Estimates
May 2019 Metropolitan and Nonmetropolitan Area Occupational Employment and Wage Estimates
May 2019 National Industry-Specific Occupational Employment and Wage Estimates
Last Modified Date: July 6, 2020