
An official website of the United States government
An official website of the United States government
The .gov means it's official.
Federal government websites often end in .gov or .mil. Before sharing sensitive information,
make sure you're on a federal government site.
The site is secure.
The
https:// ensures that you are connecting to the official website and that any
information you provide is encrypted and transmitted securely.
Compile and keep personnel records. Record data for each employee, such as address, weekly earnings, absences, amount of sales or production, supervisory reports, and date of and reason for termination. May prepare reports for employment records, file employment records, or search employee files and furnish information to authorized persons.
Employment estimate and mean wage estimates for this occupation:
| Employment (1) | Employment RSE (3) |
Mean hourly wage |
Mean annual wage (2) |
Wage RSE (3) |
|---|---|---|---|---|
| 117,340 | 1.2 % | $20.49 | $42,620 | 0.3 % |
Percentile wage estimates for this occupation:
| Percentile | 10% | 25% | 50% (Median) |
75% | 90% |
|---|---|---|---|---|---|
| Hourly Wage | $13.83 | $16.57 | $19.92 | $23.86 | $28.52 |
| Annual Wage (2) | $28,760 | $34,470 | $41,430 | $49,640 | $59,320 |
Industries with the highest published employment and wages for this occupation are provided. For a list of all industries with employment in this occupation, see the Create Customized Tables function.
Industries with the highest levels of employment in this occupation:
| Industry | Employment (1) | Percent of industry employment | Hourly mean wage | Annual mean wage (2) |
|---|---|---|---|---|
| Management of Companies and Enterprises | 10,320 | 0.42 | $20.89 | $43,450 |
| Federal Executive Branch (OES Designation) | 9,410 | 0.47 | $22.10 | $45,970 |
| Employment Services | 8,550 | 0.23 | $19.45 | $40,460 |
| Local Government, excluding schools and hospitals (OES Designation) | 5,190 | 0.09 | $23.43 | $48,730 |
| General Medical and Surgical Hospitals | 4,570 | 0.08 | $20.41 | $42,460 |
Industries with the highest concentration of employment in this occupation:
| Industry | Employment (1) | Percent of industry employment | Hourly mean wage | Annual mean wage (2) |
|---|---|---|---|---|
| Federal Executive Branch (OES Designation) | 9,410 | 0.47 | $22.10 | $45,970 |
| Lessors of Nonfinancial Intangible Assets (except Copyrighted Works) | 100 | 0.45 | $23.84 | $49,590 |
| Management of Companies and Enterprises | 10,320 | 0.42 | $20.89 | $43,450 |
| Office Administrative Services | 1,670 | 0.33 | $19.80 | $41,190 |
| Employment Services | 8,550 | 0.23 | $19.45 | $40,460 |
Top paying industries for this occupation:
| Industry | Employment (1) | Percent of industry employment | Hourly mean wage | Annual mean wage (2) |
|---|---|---|---|---|
| Postal Service (federal government) | 270 | 0.04 | $29.19 | $60,720 |
| Motor Vehicle Manufacturing | 40 | 0.02 | $26.13 | $54,340 |
| Natural Gas Distribution | 50 | 0.04 | $25.98 | $54,040 |
| Aerospace Product and Parts Manufacturing | 370 | 0.07 | $24.92 | $51,830 |
| Computer and Peripheral Equipment Manufacturing | 80 | 0.05 | $24.22 | $50,380 |
States and areas with the highest published employment, location quotients, and wages for this occupation are provided. For a list of all areas with employment in this occupation, see the Create Customized Tables function.
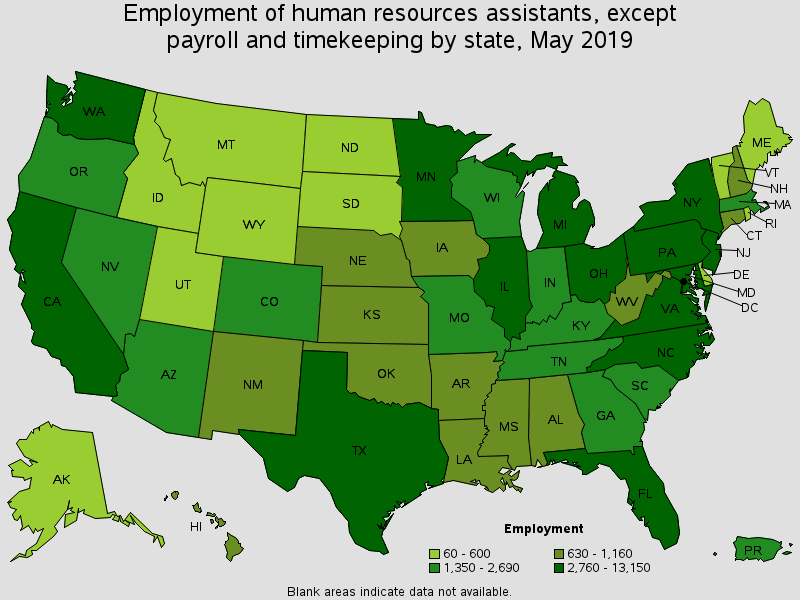
States with the highest employment level in this occupation:
| State | Employment (1) | Employment per thousand jobs | Location quotient (9) | Hourly mean wage | Annual mean wage (2) |
|---|---|---|---|---|---|
| California | 13,150 | 0.76 | 0.95 | $21.89 | $45,530 |
| Texas | 11,590 | 0.93 | 1.17 | $19.77 | $41,110 |
| New York | 9,580 | 1.01 | 1.26 | $22.81 | $47,440 |
| Florida | 6,200 | 0.71 | 0.88 | $18.99 | $39,510 |
| New Jersey | 5,430 | 1.33 | 1.66 | $21.52 | $44,770 |
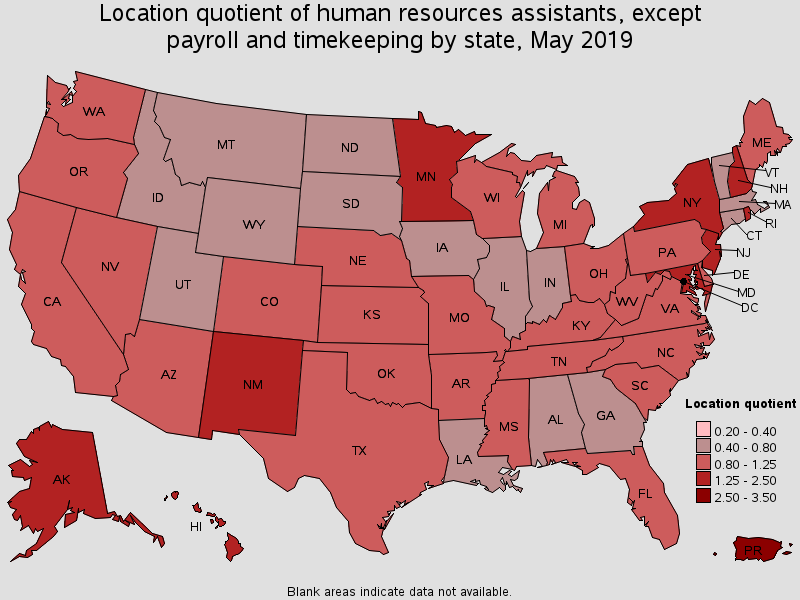
States with the highest concentration of jobs and location quotients in this occupation:
| State | Employment (1) | Employment per thousand jobs | Location quotient (9) | Hourly mean wage | Annual mean wage (2) |
|---|---|---|---|---|---|
| Maryland | 3,700 | 1.37 | 1.71 | $22.09 | $45,940 |
| Alaska | 420 | 1.34 | 1.68 | $23.15 | $48,160 |
| New Jersey | 5,430 | 1.33 | 1.66 | $21.52 | $44,770 |
| Hawaii | 740 | 1.17 | 1.46 | $20.32 | $42,250 |
| Rhode Island | 550 | 1.14 | 1.43 | $20.94 | $43,560 |
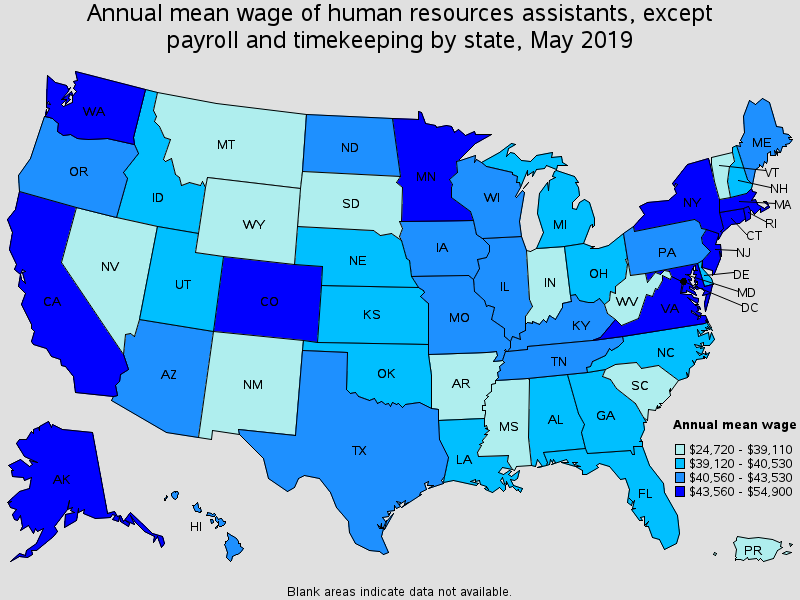
Top paying States for this occupation:
| State | Employment (1) | Employment per thousand jobs | Location quotient (9) | Hourly mean wage | Annual mean wage (2) |
|---|---|---|---|---|---|
| District of Columbia | 640 | 0.89 | 1.11 | $26.39 | $54,900 |
| Connecticut | 1,050 | 0.63 | 0.79 | $23.60 | $49,080 |
| Alaska | 420 | 1.34 | 1.68 | $23.15 | $48,160 |
| New York | 9,580 | 1.01 | 1.26 | $22.81 | $47,440 |
| Massachusetts | 2,130 | 0.59 | 0.74 | $22.68 | $47,180 |
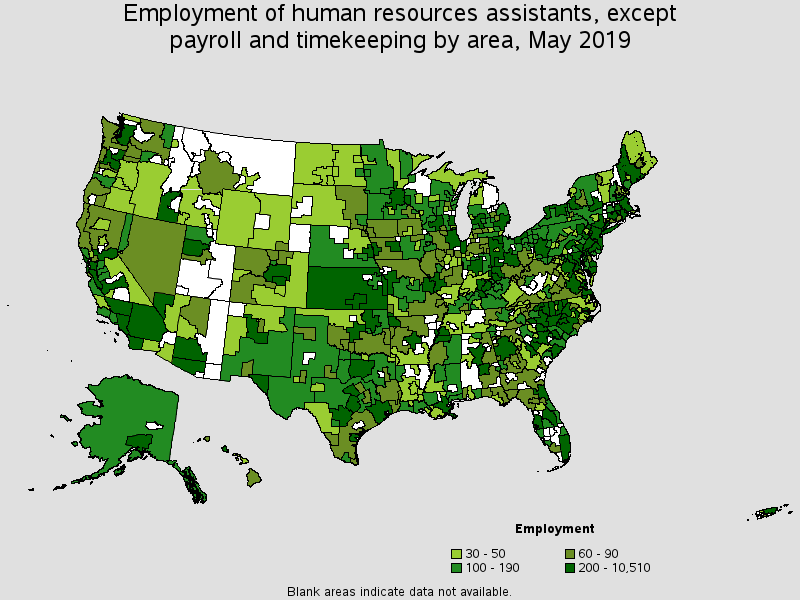
Metropolitan areas with the highest employment level in this occupation:
| Metropolitan area | Employment (1) | Employment per thousand jobs | Location quotient (9) | Hourly mean wage | Annual mean wage (2) |
|---|---|---|---|---|---|
| New York-Newark-Jersey City, NY-NJ-PA | 10,510 | 1.09 | 1.36 | $23.06 | $47,960 |
| Los Angeles-Long Beach-Anaheim, CA | 4,620 | 0.74 | 0.93 | $21.01 | $43,690 |
| Dallas-Fort Worth-Arlington, TX | 3,490 | 0.95 | 1.20 | $20.96 | $43,590 |
| Washington-Arlington-Alexandria, DC-VA-MD-WV | 3,110 | 0.98 | 1.22 | $24.09 | $50,120 |
| Philadelphia-Camden-Wilmington, PA-NJ-DE-MD | 2,790 | 0.97 | 1.21 | $20.58 | $42,810 |
| Houston-The Woodlands-Sugar Land, TX | 2,550 | 0.84 | 1.05 | $20.41 | $42,450 |
| Chicago-Naperville-Elgin, IL-IN-WI | 2,370 | 0.51 | 0.63 | $20.12 | $41,840 |
| Minneapolis-St. Paul-Bloomington, MN-WI | 2,250 | 1.14 | 1.43 | $21.86 | $45,480 |
| Baltimore-Columbia-Towson, MD | 1,910 | 1.39 | 1.73 | $22.50 | $46,800 |
| Miami-Fort Lauderdale-West Palm Beach, FL | 1,790 | 0.68 | 0.85 | $19.92 | $41,430 |
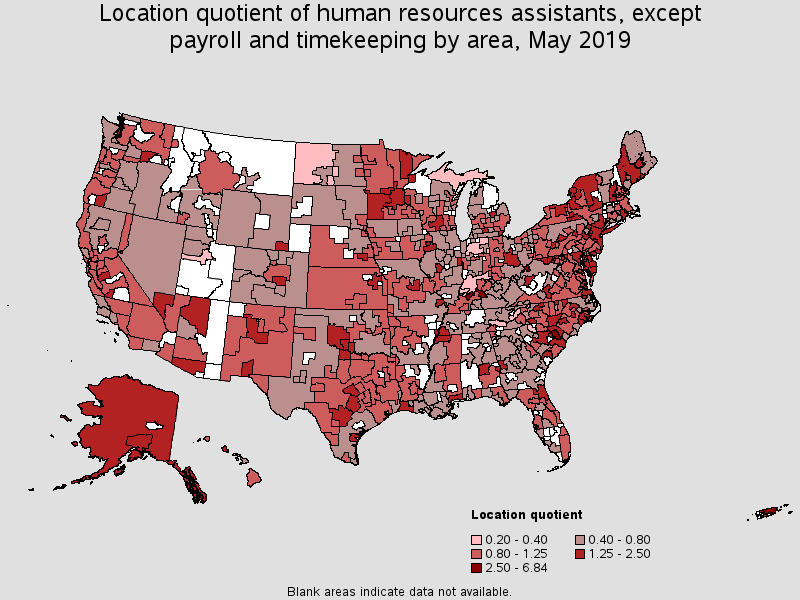
Metropolitan areas with the highest concentration of jobs and location quotients in this occupation:
| Metropolitan area | Employment (1) | Employment per thousand jobs | Location quotient (9) | Hourly mean wage | Annual mean wage (2) |
|---|---|---|---|---|---|
| Elizabethtown-Fort Knox, KY | 300 | 5.47 | 6.84 | $22.69 | $47,190 |
| Florence, SC | 250 | 2.87 | 3.60 | $16.79 | $34,930 |
| Parkersburg-Vienna, WV | 90 | 2.43 | 3.04 | $20.64 | $42,920 |
| Owensboro, KY | 110 | 2.11 | 2.65 | $17.57 | $36,540 |
| Lawton, OK | 80 | 1.91 | 2.38 | $19.90 | $41,390 |
| Killeen-Temple, TX | 260 | 1.86 | 2.33 | $18.87 | $39,240 |
| Bremerton-Silverdale, WA | 160 | 1.81 | 2.27 | $21.32 | $44,340 |
| Cumberland, MD-WV | 70 | 1.78 | 2.23 | $18.71 | $38,910 |
| Vineland-Bridgeton, NJ | 110 | 1.74 | 2.18 | $21.58 | $44,890 |
| Morgantown, WV | 110 | 1.73 | 2.17 | $18.21 | $37,870 |
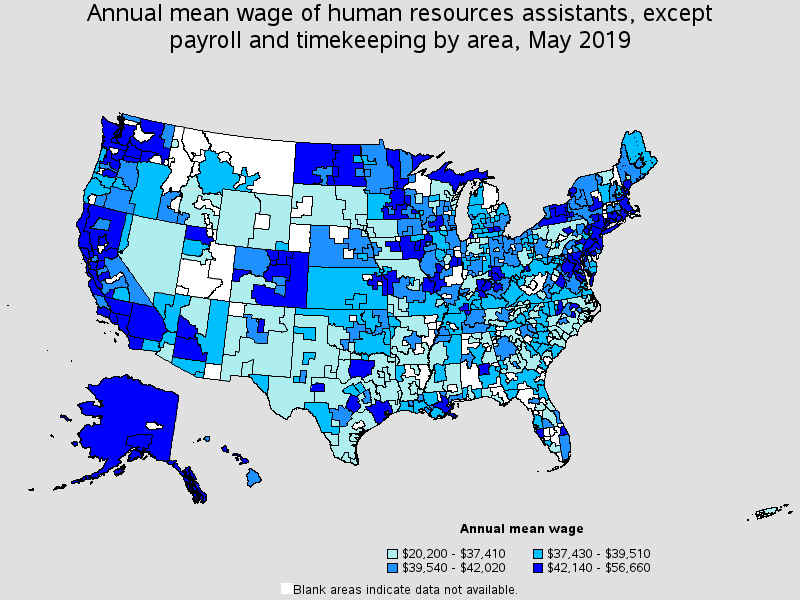
Top paying metropolitan areas for this occupation:
| Metropolitan area | Employment (1) | Employment per thousand jobs | Location quotient (9) | Hourly mean wage | Annual mean wage (2) |
|---|---|---|---|---|---|
| Ithaca, NY | 70 | 1.50 | 1.87 | $27.24 | $56,660 |
| San Francisco-Oakland-Hayward, CA | 1,790 | 0.72 | 0.90 | $25.66 | $53,370 |
| Danbury, CT | 60 | 0.78 | 0.98 | $25.01 | $52,010 |
| Hartford-West Hartford-East Hartford, CT | 450 | 0.77 | 0.96 | $24.67 | $51,310 |
| Bridgeport-Stamford-Norwalk, CT | 260 | 0.63 | 0.78 | $24.60 | $51,160 |
| Washington-Arlington-Alexandria, DC-VA-MD-WV | 3,110 | 0.98 | 1.22 | $24.09 | $50,120 |
| San Jose-Sunnyvale-Santa Clara, CA | 990 | 0.87 | 1.09 | $23.79 | $49,480 |
| Barnstable Town, MA | 60 | 0.54 | 0.67 | $23.19 | $48,230 |
| Boulder, CO | 120 | 0.64 | 0.80 | $23.08 | $48,000 |
| New York-Newark-Jersey City, NY-NJ-PA | 10,510 | 1.09 | 1.36 | $23.06 | $47,960 |
Nonmetropolitan areas with the highest employment in this occupation:
| Nonmetropolitan area | Employment (1) | Employment per thousand jobs | Location quotient (9) | Hourly mean wage | Annual mean wage (2) |
|---|---|---|---|---|---|
| Kansas nonmetropolitan area | 320 | 0.80 | 1.00 | $18.08 | $37,600 |
| Piedmont North Carolina nonmetropolitan area | 260 | 1.00 | 1.25 | $17.13 | $35,630 |
| West Northwestern Ohio nonmetropolitan area | 210 | 0.80 | 1.00 | $19.10 | $39,730 |
| Southwest Maine nonmetropolitan area | 200 | 1.02 | 1.27 | $19.92 | $41,430 |
| Southeast Coastal North Carolina nonmetropolitan area | 200 | 0.79 | 0.99 | $17.90 | $37,230 |
Nonmetropolitan areas with the highest concentration of jobs and location quotients in this occupation:
| Nonmetropolitan area | Employment (1) | Employment per thousand jobs | Location quotient (9) | Hourly mean wage | Annual mean wage (2) |
|---|---|---|---|---|---|
| Maryland nonmetropolitan area | 100 | 1.59 | 1.99 | $19.52 | $40,610 |
| Alaska nonmetropolitan area | 170 | 1.56 | 1.95 | $24.25 | $50,440 |
| Southwest Oklahoma nonmetropolitan area | 90 | 1.34 | 1.68 | $16.81 | $34,970 |
| Northeast South Carolina nonmetropolitan area | 120 | 1.25 | 1.57 | $16.53 | $34,380 |
| West Central-Southwest New Hampshire nonmetropolitan area | 120 | 1.16 | 1.46 | $19.87 | $41,330 |
Top paying nonmetropolitan areas for this occupation:
| Nonmetropolitan area | Employment (1) | Employment per thousand jobs | Location quotient (9) | Hourly mean wage | Annual mean wage (2) |
|---|---|---|---|---|---|
| Alaska nonmetropolitan area | 170 | 1.56 | 1.95 | $24.25 | $50,440 |
| North Valley-Northern Mountains Region of California nonmetropolitan area | 60 | 0.56 | 0.70 | $22.85 | $47,520 |
| West North Dakota nonmetropolitan area | 40 | 0.29 | 0.37 | $22.06 | $45,890 |
| Southwest New York nonmetropolitan area | 160 | 0.88 | 1.10 | $21.88 | $45,510 |
| Western Washington nonmetropolitan area | 70 | 0.60 | 0.75 | $21.46 | $44,640 |
These estimates are calculated with data collected from employers in all industry sectors, all metropolitan and nonmetropolitan areas, and all states and the District of Columbia. The top employment and wage figures are provided above. The complete list is available in the downloadable XLS files.
The percentile wage estimate is the value of a wage below which a certain percent of workers fall. The median wage is the 50th percentile wage estimate--50 percent of workers earn less than the median and 50 percent of workers earn more than the median. More about percentile wages.
(1) Estimates for detailed occupations do not sum to the totals because the totals include occupations not shown separately. Estimates do not include self-employed workers.
(2) Annual wages have been calculated by multiplying the hourly mean wage by a "year-round, full-time" hours figure of 2,080 hours; for those occupations where there is not an hourly wage published, the annual wage has been directly calculated from the reported survey data.
(3) The relative standard error (RSE) is a measure of the reliability of a survey statistic. The smaller the relative standard error, the more precise the estimate.
(9) The location quotient is the ratio of the area concentration of occupational employment to the national average concentration. A location quotient greater than one indicates the occupation has a higher share of employment than average, and a location quotient less than one indicates the occupation is less prevalent in the area than average.
Other OES estimates and related information:
May 2019 National Occupational Employment and Wage Estimates
May 2019 State Occupational Employment and Wage Estimates
May 2019 Metropolitan and Nonmetropolitan Area Occupational Employment and Wage Estimates
May 2019 National Industry-Specific Occupational Employment and Wage Estimates
Last Modified Date: July 6, 2020