
An official website of the United States government
An official website of the United States government
The .gov means it's official.
Federal government websites often end in .gov or .mil. Before sharing sensitive information,
make sure you're on a federal government site.
The site is secure.
The
https:// ensures that you are connecting to the official website and that any
information you provide is encrypted and transmitted securely.
This occupation includes the 2018 SOC occupations 47-5023 Earth Drillers, Except Oil and Gas; and 47-5032 Explosives Workers, Ordnance Handling Experts, and Blasters; and the 2010 SOC occupations 47-5021 Earth Drillers, Except Oil and Gas and 47-5031 Explosives Workers, Ordnance Handling Experts, and Blasters.
Employment estimate and mean wage estimates for this occupation:
| Employment (1) | Employment RSE (3) |
Mean hourly wage |
Mean annual wage (2) |
Wage RSE (3) |
|---|---|---|---|---|
| 24,940 | 3.7 % | $23.50 | $48,890 | 0.9 % |
Percentile wage estimates for this occupation:
| Percentile | 10% | 25% | 50% (Median) |
75% | 90% |
|---|---|---|---|---|---|
| Hourly Wage | $15.40 | $18.06 | $22.24 | $27.79 | $34.48 |
| Annual Wage (2) | $32,020 | $37,560 | $46,250 | $57,810 | $71,730 |
Industries with the highest published employment and wages for this occupation are provided. For a list of all industries with employment in this occupation, see the Create Customized Tables function.
Industries with the highest levels of employment in this occupation:
| Industry | Employment (1) | Percent of industry employment | Hourly mean wage | Annual mean wage (2) |
|---|---|---|---|---|
| Utility System Construction | 8,810 | 1.54 | $22.46 | $46,710 |
| Support Activities for Mining | 3,110 | 0.89 | $23.82 | $49,550 |
| Other Specialty Trade Contractors | 2,920 | 0.41 | $23.70 | $49,290 |
| Federal Executive Branch (OES Designation) | 1,580 | 0.08 | $22.67 | $47,150 |
| Architectural, Engineering, and Related Services | 1,330 | 0.09 | $22.20 | $46,180 |
Industries with the highest concentration of employment in this occupation:
| Industry | Employment (1) | Percent of industry employment | Hourly mean wage | Annual mean wage (2) |
|---|---|---|---|---|
| Metal Ore Mining | 1,190 | 2.83 | $24.87 | $51,740 |
| Utility System Construction | 8,810 | 1.54 | $22.46 | $46,710 |
| Support Activities for Mining | 3,110 | 0.89 | $23.82 | $49,550 |
| Nonmetallic Mineral Mining and Quarrying | 730 | 0.73 | $24.63 | $51,230 |
| Coal Mining | 360 | 0.70 | $27.44 | $57,080 |
Top paying industries for this occupation:
| Industry | Employment (1) | Percent of industry employment | Hourly mean wage | Annual mean wage (2) |
|---|---|---|---|---|
| Scientific Research and Development Services | 80 | 0.01 | $31.52 | $65,550 |
| Highway, Street, and Bridge Construction | (8) | (8) | $30.79 | $64,040 |
| Foundation, Structure, and Building Exterior Contractors | 40 | (7) | $29.88 | $62,160 |
| Other Heavy and Civil Engineering Construction | 300 | 0.24 | $28.21 | $58,670 |
| Commercial and Industrial Machinery and Equipment (except Automotive and Electronic) Repair and Maintenance | (8) | (8) | $28.15 | $58,560 |
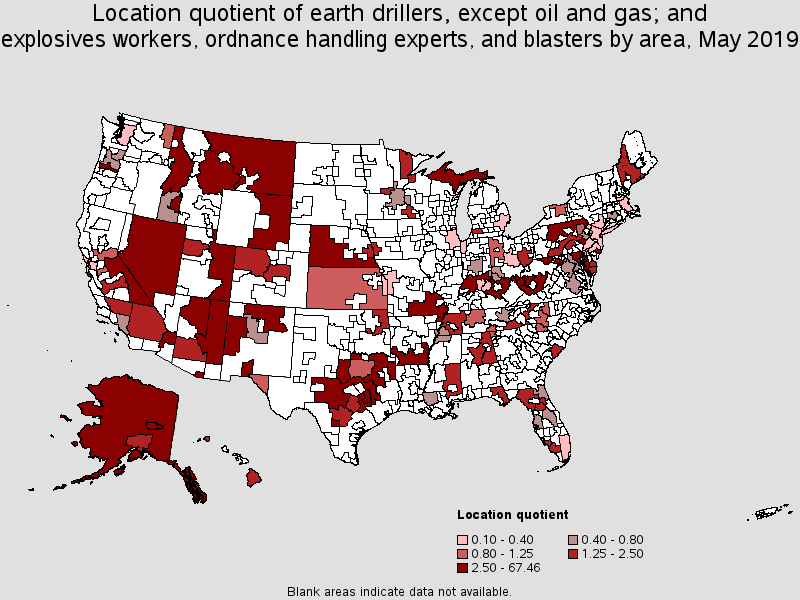
States and areas with the highest published employment, location quotients, and wages for this occupation are provided. For a list of all areas with employment in this occupation, see the Create Customized Tables function.
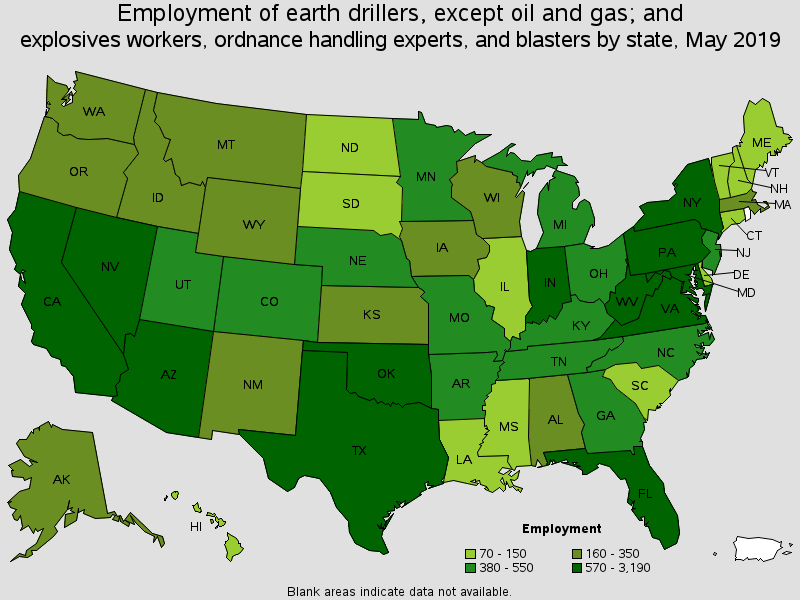
States with the highest employment level in this occupation:
| State | Employment (1) | Employment per thousand jobs | Location quotient (9) | Hourly mean wage | Annual mean wage (2) |
|---|---|---|---|---|---|
| Texas | 3,190 | 0.26 | 1.51 | $20.16 | $41,930 |
| California | 2,430 | 0.14 | 0.82 | $25.82 | $53,710 |
| Nevada | 1,320 | 0.95 | 5.58 | $24.38 | $50,710 |
| Florida | 1,220 | 0.14 | 0.82 | $19.75 | $41,070 |
| Oklahoma | 980 | 0.61 | 3.58 | $20.92 | $43,510 |
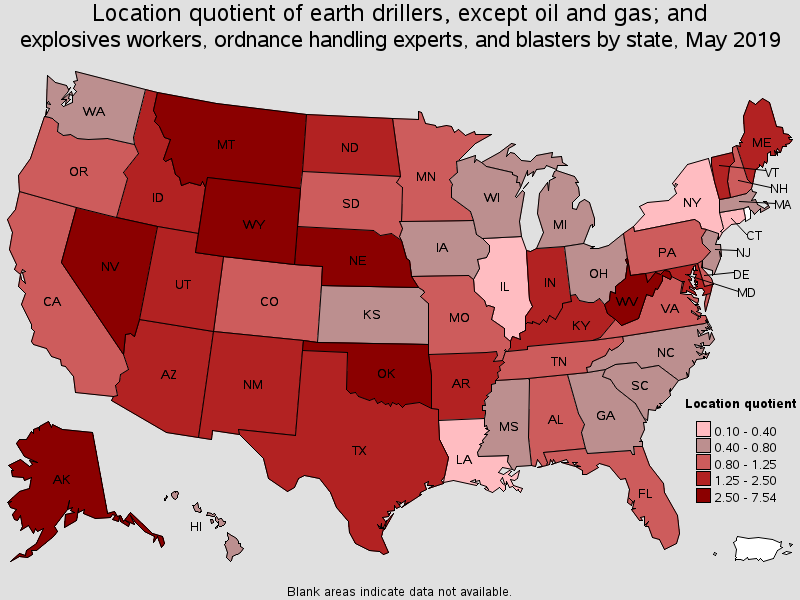
States with the highest concentration of jobs and location quotients in this occupation:
| State | Employment (1) | Employment per thousand jobs | Location quotient (9) | Hourly mean wage | Annual mean wage (2) |
|---|---|---|---|---|---|
| Wyoming | 350 | 1.28 | 7.54 | $28.39 | $59,060 |
| Alaska | 350 | 1.11 | 6.56 | $29.12 | $60,560 |
| Nevada | 1,320 | 0.95 | 5.58 | $24.38 | $50,710 |
| West Virginia | 620 | 0.88 | 5.16 | $20.64 | $42,920 |
| Oklahoma | 980 | 0.61 | 3.58 | $20.92 | $43,510 |
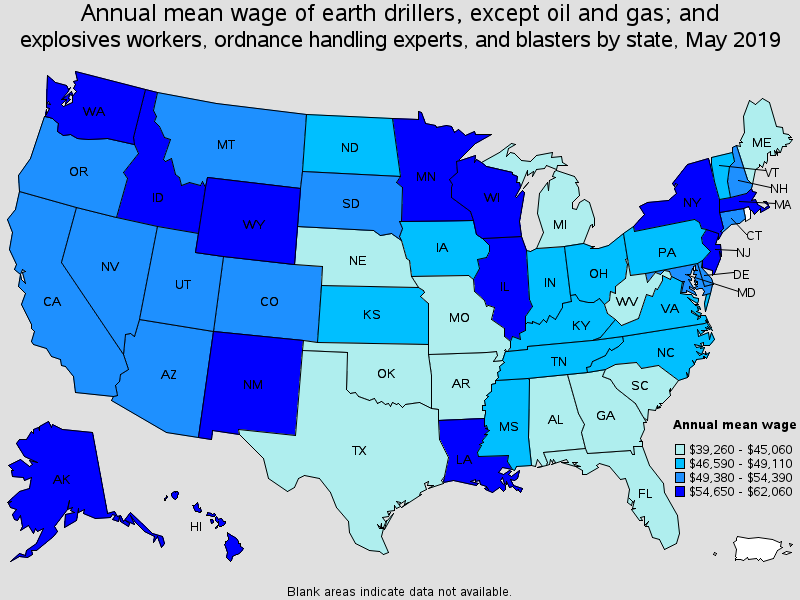
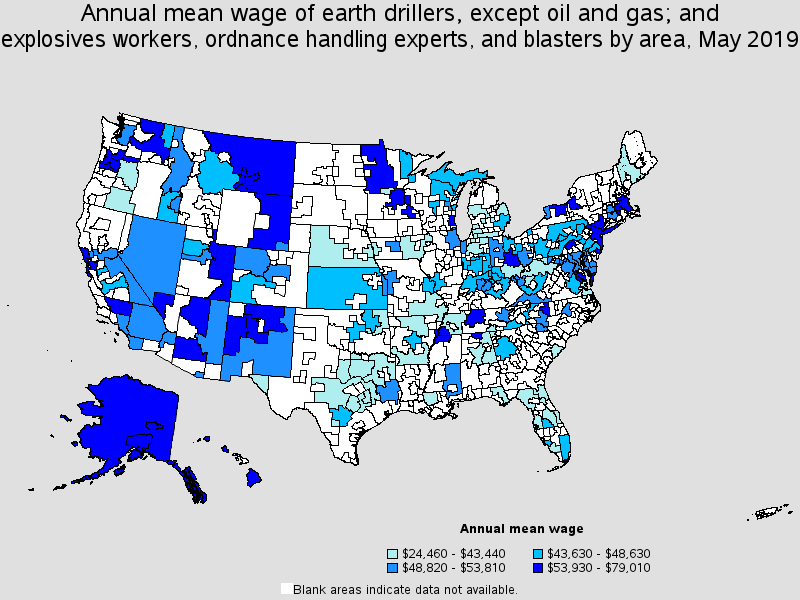
Top paying States for this occupation:
| State | Employment (1) | Employment per thousand jobs | Location quotient (9) | Hourly mean wage | Annual mean wage (2) |
|---|---|---|---|---|---|
| Hawaii | 80 | 0.13 | 0.78 | $29.84 | $62,060 |
| New Jersey | 500 | 0.12 | 0.72 | $29.70 | $61,770 |
| New York | 570 | 0.06 | 0.35 | $29.29 | $60,920 |
| Alaska | 350 | 1.11 | 6.56 | $29.12 | $60,560 |
| Louisiana | 90 | 0.05 | 0.27 | $28.90 | $60,110 |
Metropolitan areas with the highest employment level in this occupation:
| Metropolitan area | Employment (1) | Employment per thousand jobs | Location quotient (9) | Hourly mean wage | Annual mean wage (2) |
|---|---|---|---|---|---|
| Los Angeles-Long Beach-Anaheim, CA | 810 | 0.13 | 0.76 | $25.81 | $53,690 |
| Dallas-Fort Worth-Arlington, TX | 710 | 0.19 | 1.14 | $20.74 | $43,140 |
| Baltimore-Columbia-Towson, MD | 610 | 0.44 | 2.61 | $23.98 | $49,870 |
| Phoenix-Mesa-Scottsdale, AZ | 590 | 0.28 | 1.65 | $26.08 | $54,250 |
| New York-Newark-Jersey City, NY-NJ-PA | 520 | 0.05 | 0.32 | $31.52 | $65,570 |
| San Antonio-New Braunfels, TX | 400 | 0.39 | 2.29 | $21.12 | $43,930 |
| Riverside-San Bernardino-Ontario, CA | 380 | 0.25 | 1.45 | $24.04 | $50,010 |
| Denver-Aurora-Lakewood, CO | 350 | 0.23 | 1.36 | $24.56 | $51,090 |
| Austin-Round Rock, TX | 250 | 0.23 | 1.35 | $19.39 | $40,320 |
| Washington-Arlington-Alexandria, DC-VA-MD-WV | 230 | 0.07 | 0.43 | $24.15 | $50,230 |
Metropolitan areas with the highest concentration of jobs and location quotients in this occupation:
| Metropolitan area | Employment (1) | Employment per thousand jobs | Location quotient (9) | Hourly mean wage | Annual mean wage (2) |
|---|---|---|---|---|---|
| Fairbanks, AK | 40 | 1.10 | 6.45 | $31.85 | $66,250 |
| Winchester, VA-WV | 60 | 0.92 | 5.44 | $25.79 | $53,630 |
| Morgantown, WV | 60 | 0.87 | 5.12 | $16.95 | $35,250 |
| Atlantic City-Hammonton, NJ | 110 | 0.82 | 4.85 | $37.99 | $79,010 |
| Huntington-Ashland, WV-KY-OH | 100 | 0.74 | 4.35 | $24.51 | $50,990 |
| Flagstaff, AZ | 40 | 0.72 | 4.21 | $26.23 | $54,550 |
| Salem, OR | 110 | 0.63 | 3.71 | $27.31 | $56,800 |
| Charleston, WV | 60 | 0.58 | 3.44 | $20.45 | $42,530 |
| Santa Cruz-Watsonville, CA | 50 | 0.51 | 2.97 | $31.07 | $64,620 |
| College Station-Bryan, TX | 60 | 0.51 | 2.97 | $18.48 | $38,440 |
Top paying metropolitan areas for this occupation:
| Metropolitan area | Employment (1) | Employment per thousand jobs | Location quotient (9) | Hourly mean wage | Annual mean wage (2) |
|---|---|---|---|---|---|
| Atlantic City-Hammonton, NJ | 110 | 0.82 | 4.85 | $37.99 | $79,010 |
| Fairbanks, AK | 40 | 1.10 | 6.45 | $31.85 | $66,250 |
| New York-Newark-Jersey City, NY-NJ-PA | 520 | 0.05 | 0.32 | $31.52 | $65,570 |
| Santa Cruz-Watsonville, CA | 50 | 0.51 | 2.97 | $31.07 | $64,620 |
| San Francisco-Oakland-Hayward, CA | 140 | 0.06 | 0.32 | $30.83 | $64,130 |
| Urban Honolulu, HI | (8) | (8) | (8) | $30.41 | $63,240 |
| Columbus, OH | 60 | 0.06 | 0.35 | $30.40 | $63,230 |
| Minneapolis-St. Paul-Bloomington, MN-WI | 150 | 0.07 | 0.44 | $29.79 | $61,970 |
| Memphis, TN-MS-AR | 50 | 0.09 | 0.51 | $29.44 | $61,240 |
| Winston-Salem, NC | 40 | 0.16 | 0.93 | $29.36 | $61,080 |
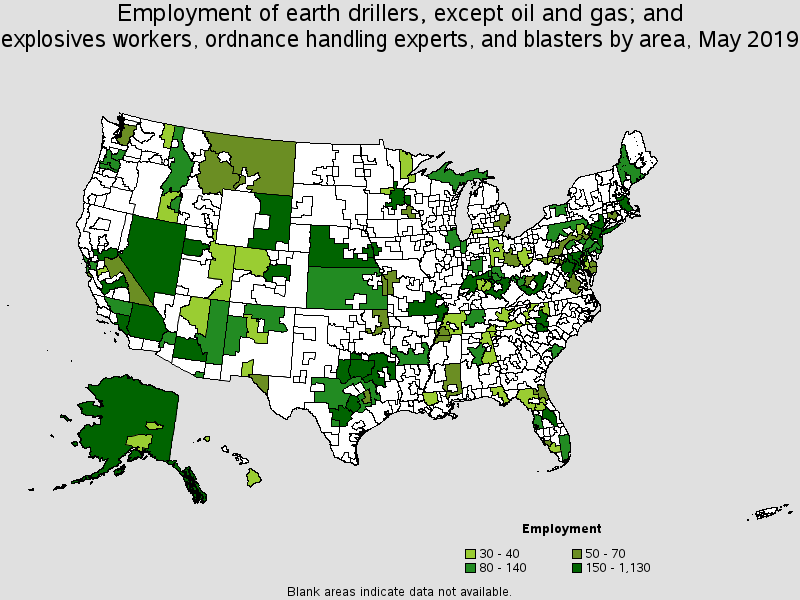
Nonmetropolitan areas with the highest employment in this occupation:
| Nonmetropolitan area | Employment (1) | Employment per thousand jobs | Location quotient (9) | Hourly mean wage | Annual mean wage (2) |
|---|---|---|---|---|---|
| Nevada nonmetropolitan area | 1,130 | 11.46 | 67.46 | $23.79 | $49,480 |
| Southern Indiana nonmetropolitan area | 350 | 1.86 | 10.95 | $22.68 | $47,170 |
| Eastern Wyoming nonmetropolitan area | 280 | 3.26 | 19.21 | $28.53 | $59,350 |
| Alaska nonmetropolitan area | 280 | 2.54 | 14.97 | $29.03 | $60,390 |
| South Nebraska nonmetropolitan area | 260 | 1.75 | 10.30 | $20.34 | $42,310 |
Nonmetropolitan areas with the highest concentration of jobs and location quotients in this occupation:
| Nonmetropolitan area | Employment (1) | Employment per thousand jobs | Location quotient (9) | Hourly mean wage | Annual mean wage (2) |
|---|---|---|---|---|---|
| Nevada nonmetropolitan area | 1,130 | 11.46 | 67.46 | $23.79 | $49,480 |
| Eastern Wyoming nonmetropolitan area | 280 | 3.26 | 19.21 | $28.53 | $59,350 |
| Alaska nonmetropolitan area | 280 | 2.54 | 14.97 | $29.03 | $60,390 |
| Southern West Virginia nonmetropolitan area | 170 | 2.24 | 13.21 | $21.46 | $44,640 |
| Southern Indiana nonmetropolitan area | 350 | 1.86 | 10.95 | $22.68 | $47,170 |
Top paying nonmetropolitan areas for this occupation:
| Nonmetropolitan area | Employment (1) | Employment per thousand jobs | Location quotient (9) | Hourly mean wage | Annual mean wage (2) |
|---|---|---|---|---|---|
| East-Central Montana nonmetropolitan area | 70 | 1.02 | 6.03 | $31.45 | $65,430 |
| Northern New Mexico nonmetropolitan area | 90 | 1.10 | 6.46 | $30.44 | $63,320 |
| Eastern Utah nonmetropolitan area | 40 | 0.53 | 3.13 | $29.74 | $61,860 |
| Alaska nonmetropolitan area | 280 | 2.54 | 14.97 | $29.03 | $60,390 |
| Hawaii / Kauai nonmetropolitan area | 30 | 0.32 | 1.87 | $28.94 | $60,190 |
These estimates are calculated with data collected from employers in all industry sectors, all metropolitan and nonmetropolitan areas, and all states and the District of Columbia. The top employment and wage figures are provided above. The complete list is available in the downloadable XLS files.
The percentile wage estimate is the value of a wage below which a certain percent of workers fall. The median wage is the 50th percentile wage estimate--50 percent of workers earn less than the median and 50 percent of workers earn more than the median. More about percentile wages.
(1) Estimates for detailed occupations do not sum to the totals because the totals include occupations not shown separately. Estimates do not include self-employed workers.
(2) Annual wages have been calculated by multiplying the hourly mean wage by a "year-round, full-time" hours figure of 2,080 hours; for those occupations where there is not an hourly wage published, the annual wage has been directly calculated from the reported survey data.
(3) The relative standard error (RSE) is a measure of the reliability of a survey statistic. The smaller the relative standard error, the more precise the estimate.
(7) The value is less than .005 percent of industry employment.
(8) Estimate not released.
(9) The location quotient is the ratio of the area concentration of occupational employment to the national average concentration. A location quotient greater than one indicates the occupation has a higher share of employment than average, and a location quotient less than one indicates the occupation is less prevalent in the area than average.
Other OES estimates and related information:
May 2019 National Occupational Employment and Wage Estimates
May 2019 State Occupational Employment and Wage Estimates
May 2019 Metropolitan and Nonmetropolitan Area Occupational Employment and Wage Estimates
May 2019 National Industry-Specific Occupational Employment and Wage Estimates
Last Modified Date: July 6, 2020