
An official website of the United States government
An official website of the United States government
The .gov means it's official.
Federal government websites often end in .gov or .mil. Before sharing sensitive information,
make sure you're on a federal government site.
The site is secure.
The
https:// ensures that you are connecting to the official website and that any
information you provide is encrypted and transmitted securely.
Install, set up, rearrange, or remove switching, distribution, routing, and dialing equipment used in central offices or headends. Service or repair telephone, cable television, Internet, and other communications equipment on customers� property. May install communications equipment or communications wiring in buildings. Excludes �Telecommunications Line Installers and Repairers� (49-9052).
Employment estimate and mean wage estimates for this occupation:
| Employment (1) | Employment RSE (3) |
Mean hourly wage |
Mean annual wage (2) |
Wage RSE (3) |
|---|---|---|---|---|
| 208,480 | 1.9 % | $28.15 | $58,560 | 0.6 % |
Percentile wage estimates for this occupation:
| Percentile | 10% | 25% | 50% (Median) |
75% | 90% |
|---|---|---|---|---|---|
| Hourly Wage | $15.91 | $20.95 | $27.84 | $35.33 | $41.17 |
| Annual Wage (2) | $33,090 | $43,570 | $57,910 | $73,480 | $85,620 |
Industries with the highest published employment and wages for this occupation are provided. For a list of all industries with employment in this occupation, see the Create Customized Tables function.
Industries with the highest levels of employment in this occupation:
| Industry | Employment (1) | Percent of industry employment | Hourly mean wage | Annual mean wage (2) |
|---|---|---|---|---|
| Telecommunications | 138,980 | 19.35 | $29.35 | $61,050 |
| Building Equipment Contractors | 28,400 | 1.28 | $24.22 | $50,370 |
| Merchant Wholesalers, Durable Goods (4232, 4233, 4235, 4236, 4237, and 4239 only) | 5,690 | 0.40 | $25.28 | $52,590 |
| Cable and Other Subscription Programming | 5,350 | 10.05 | $28.47 | $59,210 |
| Electronic and Precision Equipment Repair and Maintenance | 4,430 | 4.29 | $21.82 | $45,380 |
Industries with the highest concentration of employment in this occupation:
| Industry | Employment (1) | Percent of industry employment | Hourly mean wage | Annual mean wage (2) |
|---|---|---|---|---|
| Telecommunications | 138,980 | 19.35 | $29.35 | $61,050 |
| Cable and Other Subscription Programming | 5,350 | 10.05 | $28.47 | $59,210 |
| Electronic and Precision Equipment Repair and Maintenance | 4,430 | 4.29 | $21.82 | $45,380 |
| Building Equipment Contractors | 28,400 | 1.28 | $24.22 | $50,370 |
| Merchant Wholesalers, Durable Goods (4232, 4233, 4235, 4236, 4237, and 4239 only) | 5,690 | 0.40 | $25.28 | $52,590 |
Top paying industries for this occupation:
| Industry | Employment (1) | Percent of industry employment | Hourly mean wage | Annual mean wage (2) |
|---|---|---|---|---|
| Other Specialty Trade Contractors | (8) | (8) | $36.62 | $76,160 |
| Electric Power Generation, Transmission and Distribution | 370 | 0.10 | $34.60 | $71,970 |
| Scientific Research and Development Services | 160 | 0.02 | $33.88 | $70,480 |
| Local Government, excluding schools and hospitals (OES Designation) | 2,500 | 0.05 | $31.46 | $65,440 |
| Oil and Gas Extraction | (8) | (8) | $31.15 | $64,800 |
States and areas with the highest published employment, location quotients, and wages for this occupation are provided. For a list of all areas with employment in this occupation, see the Create Customized Tables function.
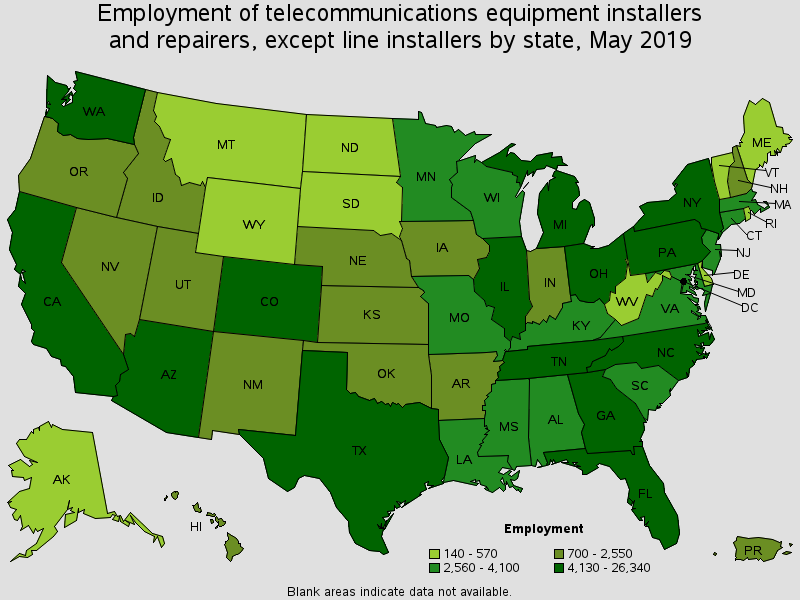
States with the highest employment level in this occupation:
| State | Employment (1) | Employment per thousand jobs | Location quotient (9) | Hourly mean wage | Annual mean wage (2) |
|---|---|---|---|---|---|
| California | 26,340 | 1.52 | 1.07 | $30.06 | $62,530 |
| Texas | 20,450 | 1.65 | 1.16 | $26.45 | $55,010 |
| Florida | 19,780 | 2.25 | 1.58 | $26.07 | $54,230 |
| Georgia | 9,850 | 2.20 | 1.55 | $25.80 | $53,660 |
| New York | 9,690 | 1.02 | 0.72 | $34.32 | $71,390 |
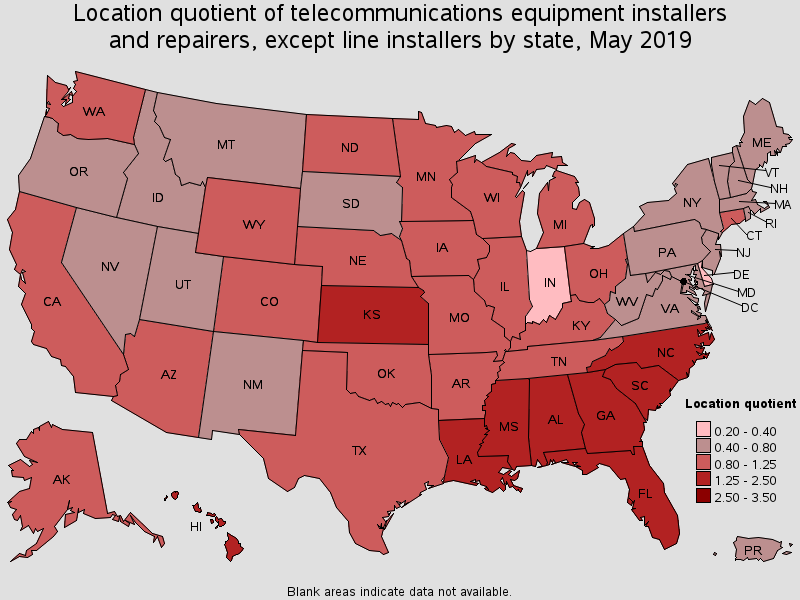
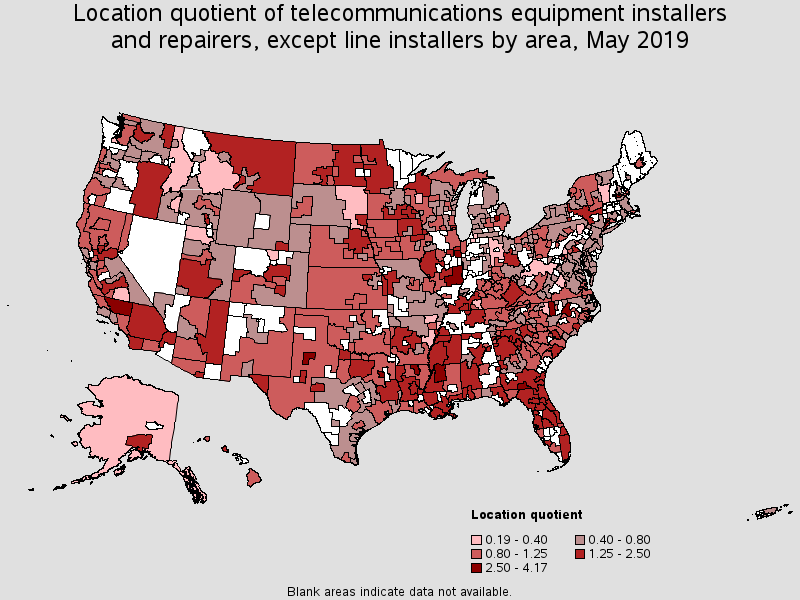
States with the highest concentration of jobs and location quotients in this occupation:
| State | Employment (1) | Employment per thousand jobs | Location quotient (9) | Hourly mean wage | Annual mean wage (2) |
|---|---|---|---|---|---|
| Mississippi | 2,950 | 2.62 | 1.84 | $24.60 | $51,160 |
| Florida | 19,780 | 2.25 | 1.58 | $26.07 | $54,230 |
| Georgia | 9,850 | 2.20 | 1.55 | $25.80 | $53,660 |
| Hawaii | 1,320 | 2.07 | 1.46 | $31.10 | $64,700 |
| Louisiana | 3,790 | 1.97 | 1.39 | $28.13 | $58,500 |
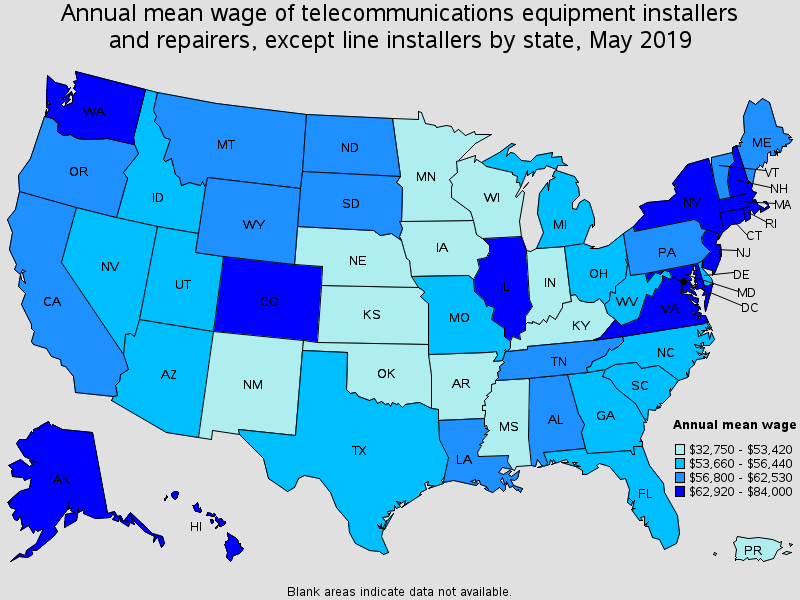
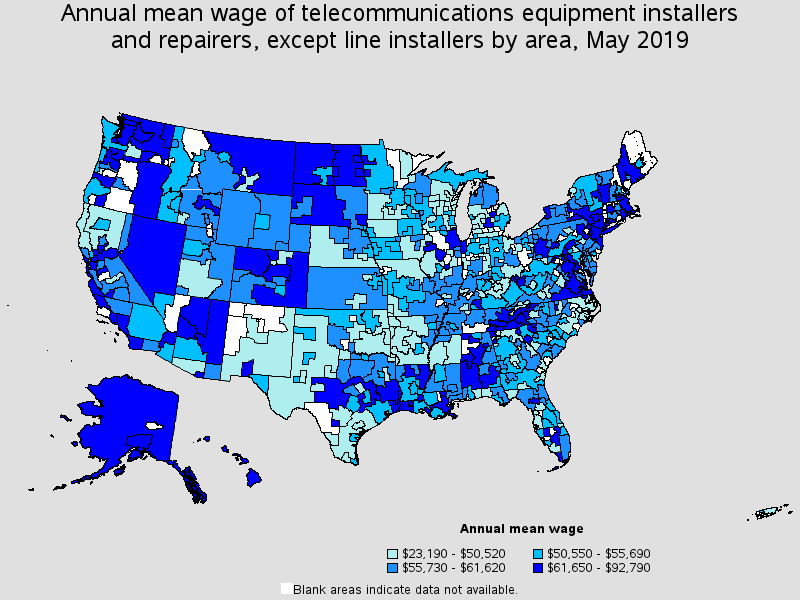
Top paying States for this occupation:
| State | Employment (1) | Employment per thousand jobs | Location quotient (9) | Hourly mean wage | Annual mean wage (2) |
|---|---|---|---|---|---|
| District of Columbia | 500 | 0.69 | 0.49 | $40.38 | $84,000 |
| Massachusetts | 2,670 | 0.74 | 0.52 | $36.87 | $76,690 |
| Alaska | 550 | 1.72 | 1.21 | $34.37 | $71,500 |
| New York | 9,690 | 1.02 | 0.72 | $34.32 | $71,390 |
| New Hampshire | 730 | 1.10 | 0.78 | $33.04 | $68,720 |
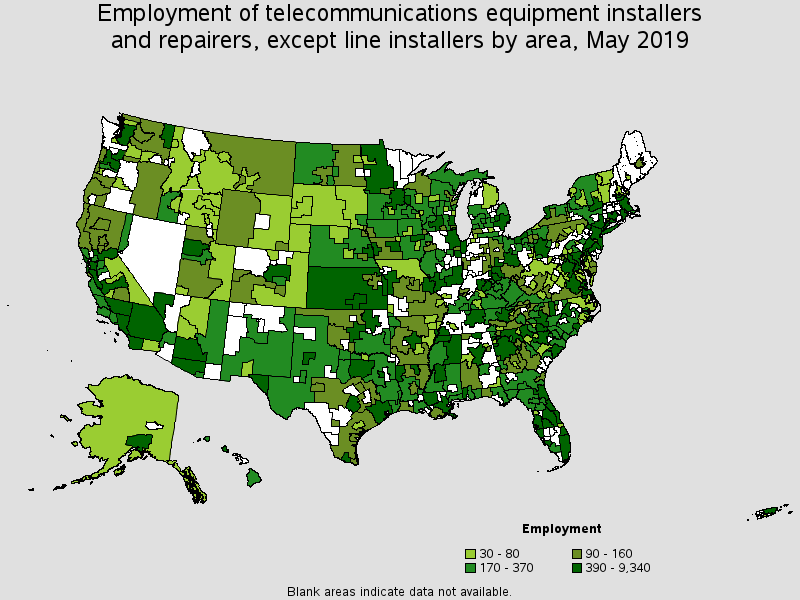
Metropolitan areas with the highest employment level in this occupation:
| Metropolitan area | Employment (1) | Employment per thousand jobs | Location quotient (9) | Hourly mean wage | Annual mean wage (2) |
|---|---|---|---|---|---|
| New York-Newark-Jersey City, NY-NJ-PA | 9,340 | 0.97 | 0.68 | $34.64 | $72,050 |
| Los Angeles-Long Beach-Anaheim, CA | 8,350 | 1.34 | 0.94 | $30.41 | $63,260 |
| Dallas-Fort Worth-Arlington, TX | 8,020 | 2.19 | 1.55 | $28.09 | $58,430 |
| Atlanta-Sandy Springs-Roswell, GA | 6,710 | 2.45 | 1.72 | $26.45 | $55,030 |
| Chicago-Naperville-Elgin, IL-IN-WI | 5,580 | 1.19 | 0.84 | $30.88 | $64,230 |
| Miami-Fort Lauderdale-West Palm Beach, FL | 5,130 | 1.94 | 1.37 | $28.37 | $59,010 |
| Houston-The Woodlands-Sugar Land, TX | 4,060 | 1.33 | 0.94 | $26.54 | $55,200 |
| Tampa-St. Petersburg-Clearwater, FL | 3,510 | 2.63 | 1.85 | $23.79 | $49,480 |
| Orlando-Kissimmee-Sanford, FL | 3,440 | 2.66 | 1.87 | $24.82 | $51,630 |
| San Diego-Carlsbad, CA | 3,150 | 2.11 | 1.49 | $31.29 | $65,090 |
Metropolitan areas with the highest concentration of jobs and location quotients in this occupation:
| Metropolitan area | Employment (1) | Employment per thousand jobs | Location quotient (9) | Hourly mean wage | Annual mean wage (2) |
|---|---|---|---|---|---|
| Lubbock, TX | 860 | 5.92 | 4.17 | $26.28 | $54,650 |
| Flint, MI | 720 | 5.29 | 3.73 | $24.48 | $50,910 |
| Monroe, LA | 400 | 5.19 | 3.66 | $29.08 | $60,490 |
| Bakersfield, CA | 1,470 | 4.64 | 3.27 | $29.51 | $61,370 |
| Valdosta, GA | 210 | 4.06 | 2.86 | $20.93 | $43,530 |
| Raleigh, NC | 2,590 | 3.98 | 2.80 | $27.34 | $56,870 |
| Tyler, TX | 400 | 3.87 | 2.73 | $25.36 | $52,750 |
| Jackson, MS | 980 | 3.70 | 2.61 | $25.23 | $52,470 |
| Greensboro-High Point, NC | 1,340 | 3.66 | 2.58 | $27.59 | $57,380 |
| Manchester, NH | 420 | 3.62 | 2.55 | $38.00 | $79,040 |
Top paying metropolitan areas for this occupation:
| Metropolitan area | Employment (1) | Employment per thousand jobs | Location quotient (9) | Hourly mean wage | Annual mean wage (2) |
|---|---|---|---|---|---|
| New Bedford, MA | (8) | (8) | (8) | $44.61 | $92,790 |
| Kahului-Wailuku-Lahaina, HI | (8) | (8) | (8) | $43.27 | $90,010 |
| Springfield, MA-CT | (8) | (8) | (8) | $41.29 | $85,890 |
| Buffalo-Cheektowaga-Niagara Falls, NY | 390 | 0.71 | 0.50 | $40.70 | $84,660 |
| Hanford-Corcoran, CA | 50 | 1.16 | 0.82 | $40.28 | $83,780 |
| Kingston, NY | (8) | (8) | (8) | $39.96 | $83,110 |
| Barnstable Town, MA | 170 | 1.66 | 1.17 | $39.44 | $82,030 |
| Manchester, NH | 420 | 3.62 | 2.55 | $38.00 | $79,040 |
| Longview, WA | (8) | (8) | (8) | $37.45 | $77,890 |
| Bridgeport-Stamford-Norwalk, CT | 1,090 | 2.64 | 1.86 | $37.26 | $77,490 |
Nonmetropolitan areas with the highest employment in this occupation:
| Nonmetropolitan area | Employment (1) | Employment per thousand jobs | Location quotient (9) | Hourly mean wage | Annual mean wage (2) |
|---|---|---|---|---|---|
| Northeast Mississippi nonmetropolitan area | 730 | 3.10 | 2.18 | $18.18 | $37,820 |
| East Central Illinois nonmetropolitan area | 570 | 4.79 | 3.37 | $28.56 | $59,410 |
| Kansas nonmetropolitan area | 490 | 1.23 | 0.87 | $27.10 | $56,360 |
| Northwest Minnesota nonmetropolitan area | 460 | 2.39 | 1.69 | $26.59 | $55,310 |
| North Georgia nonmetropolitan area | 410 | 2.39 | 1.69 | $23.09 | $48,020 |
Nonmetropolitan areas with the highest concentration of jobs and location quotients in this occupation:
| Nonmetropolitan area | Employment (1) | Employment per thousand jobs | Location quotient (9) | Hourly mean wage | Annual mean wage (2) |
|---|---|---|---|---|---|
| East Central Illinois nonmetropolitan area | 570 | 4.79 | 3.37 | $28.56 | $59,410 |
| East Kentucky nonmetropolitan area | 340 | 3.39 | 2.39 | $24.84 | $51,670 |
| Northeast Mississippi nonmetropolitan area | 730 | 3.10 | 2.18 | $18.18 | $37,820 |
| Southwest Mississippi nonmetropolitan area | 200 | 2.75 | 1.93 | $28.95 | $60,220 |
| Northwest Mississippi nonmetropolitan area | 250 | 2.63 | 1.85 | $23.63 | $49,150 |
Top paying nonmetropolitan areas for this occupation:
| Nonmetropolitan area | Employment (1) | Employment per thousand jobs | Location quotient (9) | Hourly mean wage | Annual mean wage (2) |
|---|---|---|---|---|---|
| Arizona nonmetropolitan area | 200 | 2.22 | 1.57 | $34.40 | $71,560 |
| Upper Savannah South Carolina nonmetropolitan area | 50 | 0.56 | 0.40 | $34.37 | $71,490 |
| Central East New York nonmetropolitan area | 320 | 1.97 | 1.39 | $34.09 | $70,900 |
| Northeast Louisiana nonmetropolitan area | 100 | 1.50 | 1.06 | $33.53 | $69,750 |
| South Florida nonmetropolitan area | (8) | (8) | (8) | $32.69 | $68,000 |
These estimates are calculated with data collected from employers in all industry sectors, all metropolitan and nonmetropolitan areas, and all states and the District of Columbia. The top employment and wage figures are provided above. The complete list is available in the downloadable XLS files.
The percentile wage estimate is the value of a wage below which a certain percent of workers fall. The median wage is the 50th percentile wage estimate--50 percent of workers earn less than the median and 50 percent of workers earn more than the median. More about percentile wages.
(1) Estimates for detailed occupations do not sum to the totals because the totals include occupations not shown separately. Estimates do not include self-employed workers.
(2) Annual wages have been calculated by multiplying the hourly mean wage by a "year-round, full-time" hours figure of 2,080 hours; for those occupations where there is not an hourly wage published, the annual wage has been directly calculated from the reported survey data.
(3) The relative standard error (RSE) is a measure of the reliability of a survey statistic. The smaller the relative standard error, the more precise the estimate.
(8) Estimate not released.
(9) The location quotient is the ratio of the area concentration of occupational employment to the national average concentration. A location quotient greater than one indicates the occupation has a higher share of employment than average, and a location quotient less than one indicates the occupation is less prevalent in the area than average.
Other OES estimates and related information:
May 2019 National Occupational Employment and Wage Estimates
May 2019 State Occupational Employment and Wage Estimates
May 2019 Metropolitan and Nonmetropolitan Area Occupational Employment and Wage Estimates
May 2019 National Industry-Specific Occupational Employment and Wage Estimates
Last Modified Date: July 6, 2020