
An official website of the United States government
An official website of the United States government
The .gov means it's official.
Federal government websites often end in .gov or .mil. Before sharing sensitive information,
make sure you're on a federal government site.
The site is secure.
The
https:// ensures that you are connecting to the official website and that any
information you provide is encrypted and transmitted securely.
This occupation includes the 2018 SOC occupations 53-3051 Bus Drivers, School; 53-3053 Shuttle Drivers and Chauffeurs; and 53-3054 Taxi Drivers; and the 2010 SOC occupations 53-3022 Bus Drivers, School or Special Client; and 53-3041 Taxi Drivers and Chauffeurs.
Employment estimate and mean wage estimates for this occupation:
| Employment (1) | Employment RSE (3) |
Mean hourly wage |
Mean annual wage (2) |
Wage RSE (3) |
|---|---|---|---|---|
| 700,030 | 1.2 % | $15.97 | $33,210 | 0.5 % |
Percentile wage estimates for this occupation:
| Percentile | 10% | 25% | 50% (Median) |
75% | 90% |
|---|---|---|---|---|---|
| Hourly Wage | $9.29 | $11.66 | $15.07 | $19.20 | $23.80 |
| Annual Wage (2) | $19,320 | $24,250 | $31,340 | $39,950 | $49,500 |
Industries with the highest published employment and wages for this occupation are provided. For a list of all industries with employment in this occupation, see the Create Customized Tables function.
Industries with the highest levels of employment in this occupation:
| Industry | Employment (1) | Percent of industry employment | Hourly mean wage | Annual mean wage (2) |
|---|---|---|---|---|
| Elementary and Secondary Schools | 209,290 | 2.43 | $15.92 | $33,100 |
| School and Employee Bus Transportation | 157,430 | 71.93 | $17.95 | $37,330 |
| Other Transit and Ground Passenger Transportation | 66,330 | 58.82 | $15.16 | $31,540 |
| Local Government, excluding schools and hospitals (OES Designation) | 60,590 | 1.09 | $17.21 | $35,790 |
| Taxi and Limousine Service | 50,250 | 66.67 | $15.14 | $31,490 |
Industries with the highest concentration of employment in this occupation:
| Industry | Employment (1) | Percent of industry employment | Hourly mean wage | Annual mean wage (2) |
|---|---|---|---|---|
| School and Employee Bus Transportation | 157,430 | 71.93 | $17.95 | $37,330 |
| Taxi and Limousine Service | 50,250 | 66.67 | $15.14 | $31,490 |
| Other Transit and Ground Passenger Transportation | 66,330 | 58.82 | $15.16 | $31,540 |
| Charter Bus Industry | 2,720 | 9.43 | $16.37 | $34,040 |
| Scenic and Sightseeing Transportation, Land | 1,160 | 8.22 | $14.90 | $30,980 |
Top paying industries for this occupation:
| Industry | Employment (1) | Percent of industry employment | Hourly mean wage | Annual mean wage (2) |
|---|---|---|---|---|
| Performing Arts Companies | 140 | 0.10 | $33.99 | $70,710 |
| Computer Systems Design and Related Services | 80 | (7) | $20.85 | $43,360 |
| Plastics Product Manufacturing | 30 | 0.01 | $20.33 | $42,280 |
| Architectural, Engineering, and Related Services | 140 | 0.01 | $19.04 | $39,600 |
| Scientific Research and Development Services | 110 | 0.02 | $18.64 | $38,770 |
States and areas with the highest published employment, location quotients, and wages for this occupation are provided. For a list of all areas with employment in this occupation, see the Create Customized Tables function.
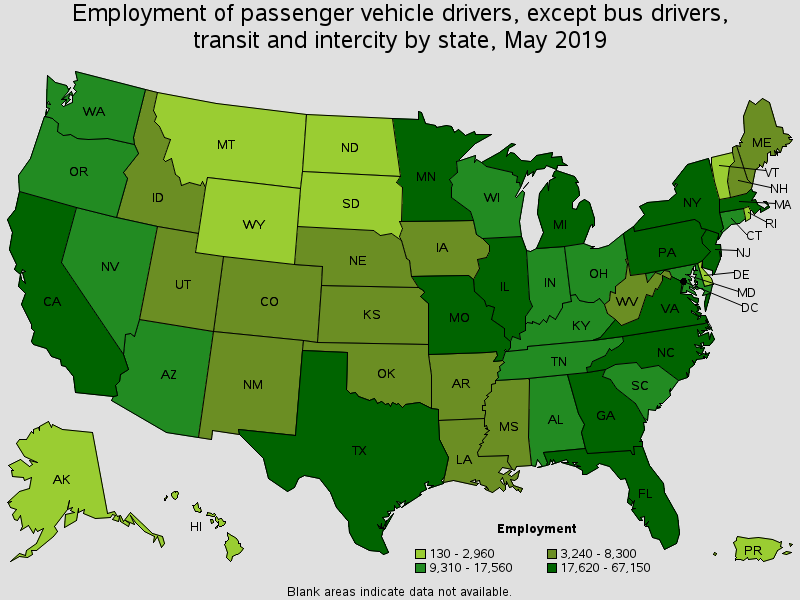
States with the highest employment level in this occupation:
| State | Employment (1) | Employment per thousand jobs | Location quotient (9) | Hourly mean wage | Annual mean wage (2) |
|---|---|---|---|---|---|
| New York | 67,150 | 7.05 | 1.48 | $20.00 | $41,600 |
| California | 56,120 | 3.23 | 0.68 | $18.01 | $37,460 |
| Texas | 46,180 | 3.71 | 0.78 | $13.25 | $27,570 |
| Pennsylvania | 38,190 | 6.47 | 1.36 | $14.77 | $30,720 |
| Florida | 29,820 | 3.39 | 0.71 | $13.56 | $28,210 |
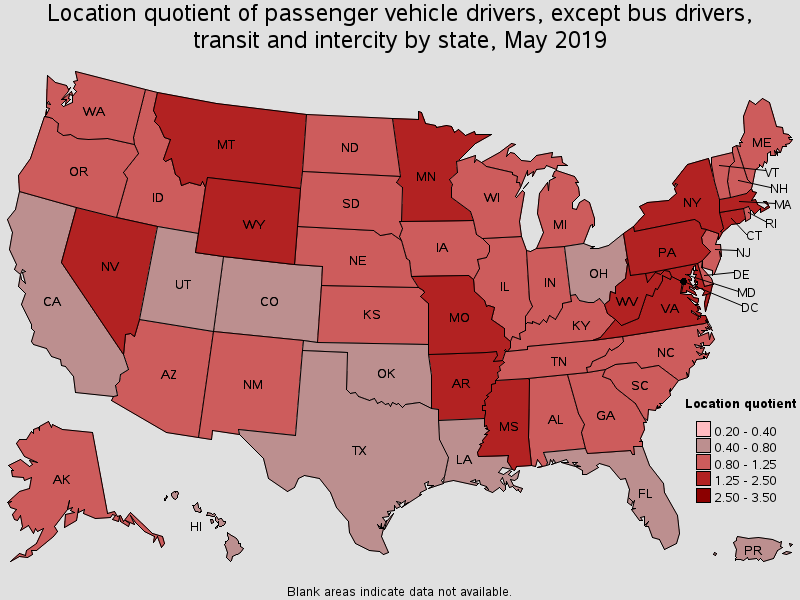
States with the highest concentration of jobs and location quotients in this occupation:
| State | Employment (1) | Employment per thousand jobs | Location quotient (9) | Hourly mean wage | Annual mean wage (2) |
|---|---|---|---|---|---|
| Connecticut | 13,720 | 8.24 | 1.73 | $18.09 | $37,620 |
| Nevada | 10,370 | 7.45 | 1.56 | $13.64 | $28,380 |
| New York | 67,150 | 7.05 | 1.48 | $20.00 | $41,600 |
| Wyoming | 1,910 | 6.97 | 1.46 | $17.02 | $35,410 |
| Mississippi | 7,640 | 6.77 | 1.42 | $10.70 | $22,250 |
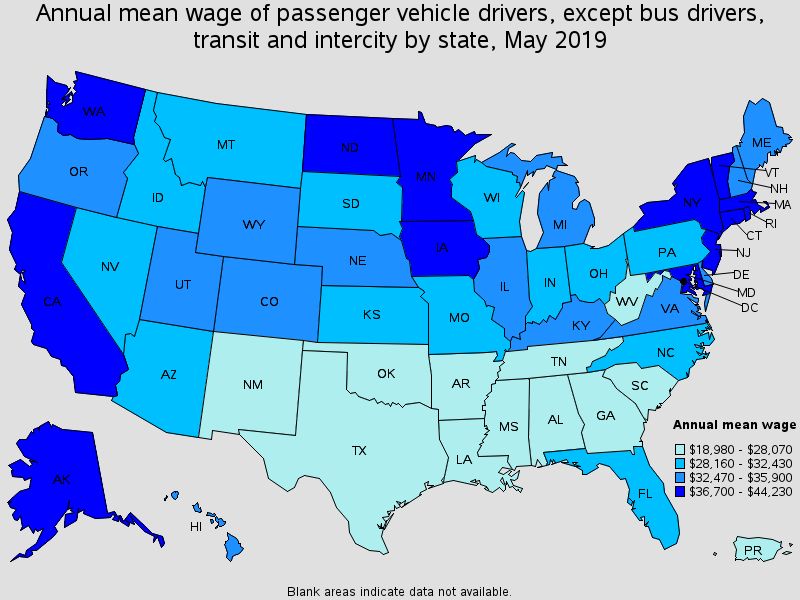
Top paying States for this occupation:
| State | Employment (1) | Employment per thousand jobs | Location quotient (9) | Hourly mean wage | Annual mean wage (2) |
|---|---|---|---|---|---|
| Alaska | 1,590 | 5.01 | 1.05 | $21.27 | $44,230 |
| New York | 67,150 | 7.05 | 1.48 | $20.00 | $41,600 |
| Washington | 16,760 | 5.05 | 1.06 | $19.99 | $41,590 |
| Massachusetts | 23,340 | 6.45 | 1.35 | $19.73 | $41,030 |
| District of Columbia | 800 | 1.11 | 0.23 | $18.74 | $38,990 |
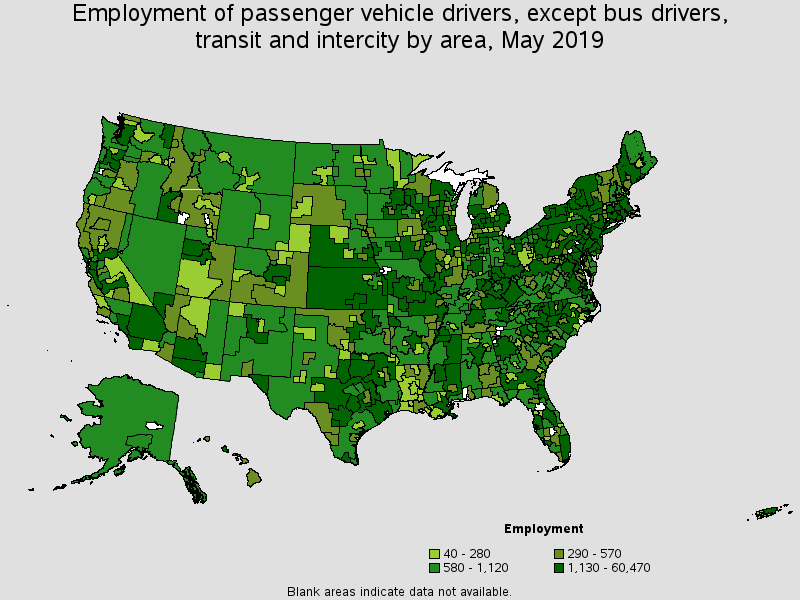
Metropolitan areas with the highest employment level in this occupation:
| Metropolitan area | Employment (1) | Employment per thousand jobs | Location quotient (9) | Hourly mean wage | Annual mean wage (2) |
|---|---|---|---|---|---|
| New York-Newark-Jersey City, NY-NJ-PA | 60,470 | 6.26 | 1.31 | $20.21 | $42,040 |
| Chicago-Naperville-Elgin, IL-IN-WI | 21,680 | 4.64 | 0.97 | $17.06 | $35,480 |
| Los Angeles-Long Beach-Anaheim, CA | 17,770 | 2.85 | 0.60 | $17.49 | $36,380 |
| Philadelphia-Camden-Wilmington, PA-NJ-DE-MD | 16,750 | 5.82 | 1.22 | $16.14 | $33,570 |
| Washington-Arlington-Alexandria, DC-VA-MD-WV | 16,400 | 5.16 | 1.08 | $19.13 | $39,790 |
| Boston-Cambridge-Nashua, MA-NH | 16,160 | 5.78 | 1.21 | $20.33 | $42,280 |
| San Francisco-Oakland-Hayward, CA | 13,450 | 5.44 | 1.14 | $19.52 | $40,610 |
| Houston-The Woodlands-Sugar Land, TX | 12,590 | 4.13 | 0.87 | $13.42 | $27,910 |
| Atlanta-Sandy Springs-Roswell, GA | 12,450 | 4.54 | 0.95 | $14.45 | $30,060 |
| Minneapolis-St. Paul-Bloomington, MN-WI | 11,710 | 5.94 | 1.25 | $17.33 | $36,050 |
Metropolitan areas with the highest concentration of jobs and location quotients in this occupation:
| Metropolitan area | Employment (1) | Employment per thousand jobs | Location quotient (9) | Hourly mean wage | Annual mean wage (2) |
|---|---|---|---|---|---|
| Vineland-Bridgeton, NJ | 800 | 13.18 | 2.76 | $17.66 | $36,740 |
| Dover, DE | 740 | 11.46 | 2.40 | $16.01 | $33,300 |
| Norwich-New London-Westerly, CT-RI | 1,480 | 11.44 | 2.40 | $15.84 | $32,940 |
| Lansing-East Lansing, MI | 2,380 | 11.00 | 2.31 | $16.89 | $35,140 |
| Leominster-Gardner, MA | 550 | 10.43 | 2.19 | $18.21 | $37,870 |
| Bloomsburg-Berwick, PA | 400 | 10.04 | 2.11 | $14.90 | $30,990 |
| Auburn-Opelika, AL | 580 | 9.89 | 2.08 | $8.82 | $18,350 |
| Springfield, MA-CT | 3,250 | 9.71 | 2.04 | $16.29 | $33,890 |
| Dothan, AL | 550 | 9.60 | 2.01 | $9.03 | $18,780 |
| Utica-Rome, NY | 1,220 | 9.48 | 1.99 | $18.47 | $38,430 |
Top paying metropolitan areas for this occupation:
| Metropolitan area | Employment (1) | Employment per thousand jobs | Location quotient (9) | Hourly mean wage | Annual mean wage (2) |
|---|---|---|---|---|---|
| Barnstable Town, MA | 580 | 5.56 | 1.17 | $24.55 | $51,050 |
| Fairbanks, AK | (8) | (8) | (8) | $22.18 | $46,130 |
| Seattle-Tacoma-Bellevue, WA | 9,250 | 4.58 | 0.96 | $20.85 | $43,380 |
| Anchorage, AK | 770 | 4.39 | 0.92 | $20.61 | $42,860 |
| Danbury, CT | 600 | 7.71 | 1.62 | $20.53 | $42,700 |
| Ames, IA | 110 | 2.53 | 0.53 | $20.42 | $42,480 |
| Boston-Cambridge-Nashua, MA-NH | 16,160 | 5.78 | 1.21 | $20.33 | $42,280 |
| Peoria, IL | 520 | 3.04 | 0.64 | $20.23 | $42,070 |
| New York-Newark-Jersey City, NY-NJ-PA | 60,470 | 6.26 | 1.31 | $20.21 | $42,040 |
| Columbus, OH | 3,250 | 3.07 | 0.64 | $20.18 | $41,970 |
Nonmetropolitan areas with the highest employment in this occupation:
| Nonmetropolitan area | Employment (1) | Employment per thousand jobs | Location quotient (9) | Hourly mean wage | Annual mean wage (2) |
|---|---|---|---|---|---|
| Kansas nonmetropolitan area | 2,740 | 6.96 | 1.46 | $13.66 | $28,420 |
| Western Wisconsin nonmetropolitan area | 1,970 | 13.93 | 2.92 | $15.14 | $31,490 |
| Southern Pennsylvania nonmetropolitan area | 1,750 | 9.08 | 1.90 | $12.71 | $26,430 |
| Central East New York nonmetropolitan area | 1,740 | 10.85 | 2.28 | $19.12 | $39,770 |
| Western Pennsylvania nonmetropolitan area | 1,720 | 11.23 | 2.36 | $14.20 | $29,540 |
Nonmetropolitan areas with the highest concentration of jobs and location quotients in this occupation:
| Nonmetropolitan area | Employment (1) | Employment per thousand jobs | Location quotient (9) | Hourly mean wage | Annual mean wage (2) |
|---|---|---|---|---|---|
| Western Wisconsin nonmetropolitan area | 1,970 | 13.93 | 2.92 | $15.14 | $31,490 |
| Northeast Maine nonmetropolitan area | 870 | 12.31 | 2.58 | $15.72 | $32,690 |
| Northern New Hampshire nonmetropolitan area | 430 | 11.83 | 2.48 | $15.74 | $32,730 |
| East Kentucky nonmetropolitan area | 1,190 | 11.81 | 2.48 | $15.47 | $32,170 |
| Northwest Virginia nonmetropolitan area | 750 | 11.71 | 2.46 | $13.43 | $27,940 |
Top paying nonmetropolitan areas for this occupation:
| Nonmetropolitan area | Employment (1) | Employment per thousand jobs | Location quotient (9) | Hourly mean wage | Annual mean wage (2) |
|---|---|---|---|---|---|
| Alaska nonmetropolitan area | 580 | 5.36 | 1.13 | $21.76 | $45,260 |
| Northwest Minnesota nonmetropolitan area | 1,120 | 5.85 | 1.23 | $21.63 | $44,990 |
| Northeast Nebraska nonmetropolitan area | 740 | 7.86 | 1.65 | $21.39 | $44,500 |
| Northwest Iowa nonmetropolitan area | 670 | 4.93 | 1.03 | $21.32 | $44,350 |
| Southern Ohio non-metropolitan area | 1,140 | 7.21 | 1.51 | $21.31 | $44,320 |
These estimates are calculated with data collected from employers in all industry sectors, all metropolitan and nonmetropolitan areas, and all states and the District of Columbia. The top employment and wage figures are provided above. The complete list is available in the downloadable XLS files.
The percentile wage estimate is the value of a wage below which a certain percent of workers fall. The median wage is the 50th percentile wage estimate--50 percent of workers earn less than the median and 50 percent of workers earn more than the median. More about percentile wages.
(1) Estimates for detailed occupations do not sum to the totals because the totals include occupations not shown separately. Estimates do not include self-employed workers.
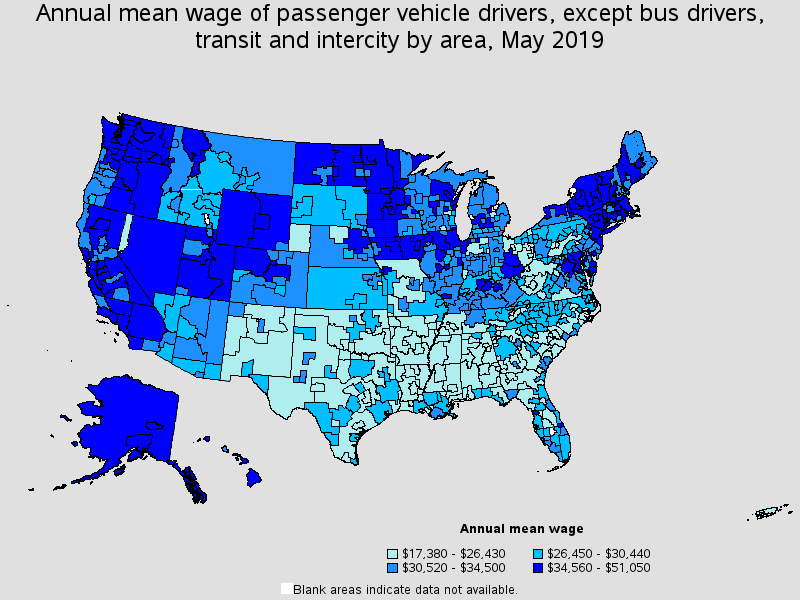
(2) Annual wages have been calculated by multiplying the hourly mean wage by a "year-round, full-time" hours figure of 2,080 hours; for those occupations where there is not an hourly wage published, the annual wage has been directly calculated from the reported survey data.
(3) The relative standard error (RSE) is a measure of the reliability of a survey statistic. The smaller the relative standard error, the more precise the estimate.
(7) The value is less than .005 percent of industry employment.
(8) Estimate not released.
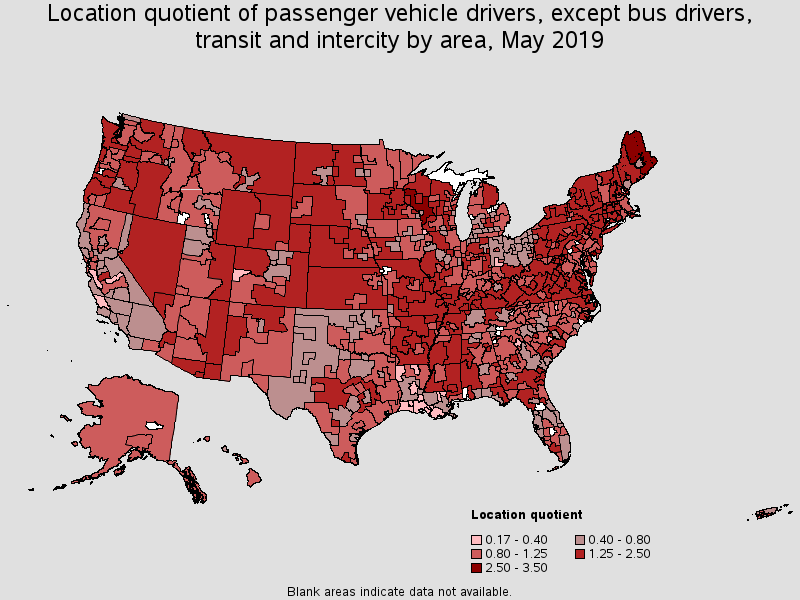
(9) The location quotient is the ratio of the area concentration of occupational employment to the national average concentration. A location quotient greater than one indicates the occupation has a higher share of employment than average, and a location quotient less than one indicates the occupation is less prevalent in the area than average.
Other OES estimates and related information:
May 2019 National Occupational Employment and Wage Estimates
May 2019 State Occupational Employment and Wage Estimates
May 2019 Metropolitan and Nonmetropolitan Area Occupational Employment and Wage Estimates
May 2019 National Industry-Specific Occupational Employment and Wage Estimates
Last Modified Date: July 6, 2020