
An official website of the United States government
An official website of the United States government
The .gov means it's official.
Federal government websites often end in .gov or .mil. Before sharing sensitive information,
make sure you're on a federal government site.
The site is secure.
The
https:// ensures that you are connecting to the official website and that any
information you provide is encrypted and transmitted securely.
Examine, analyze, and interpret accounting records to prepare financial statements, give advice, or audit and evaluate statements prepared by others. Install or advise on systems of recording costs or other financial and budgetary data. Excludes "Tax Examiners and Collectors, and Revenue Agents" (13-2081).
Employment estimate and mean wage estimates for Accountants and Auditors:
| Employment (1) | Employment RSE (3) |
Mean hourly wage |
Mean annual wage (2) |
Wage RSE (3) |
|---|---|---|---|---|
| 1,274,620 | 0.5 % | $ 39.26 | $ 81,660 | 0.3 % |
Percentile wage estimates for Accountants and Auditors:
| Percentile | 10% | 25% | 50% (Median) |
75% | 90% |
|---|---|---|---|---|---|
| Hourly Wage | $ 21.74 | $ 27.46 | $ 35.37 | $ 46.89 | $ 61.87 |
| Annual Wage (2) | $ 45,220 | $ 57,110 | $ 73,560 | $ 97,530 | $ 128,680 |
Industries with the highest published employment and wages for Accountants and Auditors are provided. For a list of all industries with employment in Accountants and Auditors, see the Create Customized Tables function.
Industries with the highest levels of employment in Accountants and Auditors:
| Industry | Employment (1) | Percent of industry employment | Hourly mean wage | Annual mean wage (2) |
|---|---|---|---|---|
| Accounting, Tax Preparation, Bookkeeping, and Payroll Services | 339,020 | 34.58 | $ 40.89 | $ 85,050 |
| Management of Companies and Enterprises | 97,250 | 4.02 | $ 39.79 | $ 82,770 |
| Local Government, excluding schools and hospitals (OEWS Designation) | 46,060 | 0.85 | $ 34.33 | $ 71,420 |
| State Government, excluding schools and hospitals (OEWS Designation) | 41,780 | 1.90 | $ 32.91 | $ 68,460 |
| Real Estate | 36,180 | 2.19 | $ 37.68 | $ 78,370 |
Industries with the highest concentration of employment in Accountants and Auditors:
| Industry | Employment (1) | Percent of industry employment | Hourly mean wage | Annual mean wage (2) |
|---|---|---|---|---|
| Accounting, Tax Preparation, Bookkeeping, and Payroll Services | 339,020 | 34.58 | $ 40.89 | $ 85,050 |
| Oil and Gas Extraction | 8,170 | 6.56 | $ 44.49 | $ 92,530 |
| Other Investment Pools and Funds | 560 | 5.23 | $ 41.29 | $ 85,880 |
| Insurance and Employee Benefit Funds | 310 | 4.39 | $ 40.83 | $ 84,930 |
| Office Administrative Services | 20,340 | 4.08 | $ 38.05 | $ 79,140 |
Top paying industries for Accountants and Auditors:
| Industry | Employment (1) | Percent of industry employment | Hourly mean wage | Annual mean wage (2) |
|---|---|---|---|---|
| Computer and Peripheral Equipment Manufacturing | 3,910 | 2.44 | $ 54.17 | $ 112,680 |
| Federal Executive Branch (OEWS Designation) | 22,160 | 1.06 | $ 50.95 | $ 105,980 |
| School and Employee Bus Transportation | 120 | 0.07 | $ 50.51 | $ 105,060 |
| Securities, Commodity Contracts, and Other Financial Investments and Related Activities | 31,450 | 3.34 | $ 49.05 | $ 102,020 |
| Other Information Services | 4,660 | 1.34 | $ 47.99 | $ 99,810 |
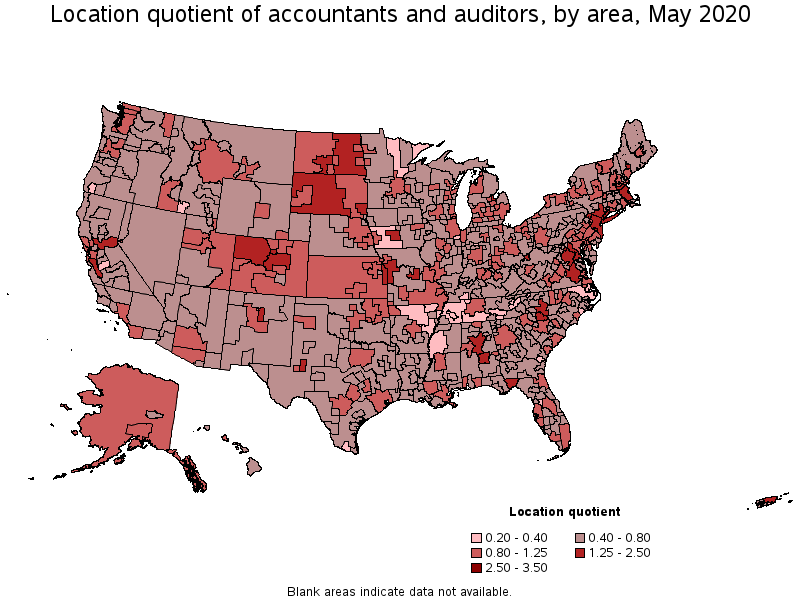
States and areas with the highest published employment, location quotients, and wages for Accountants and Auditors are provided. For a list of all areas with employment in Accountants and Auditors, see the Create Customized Tables function.
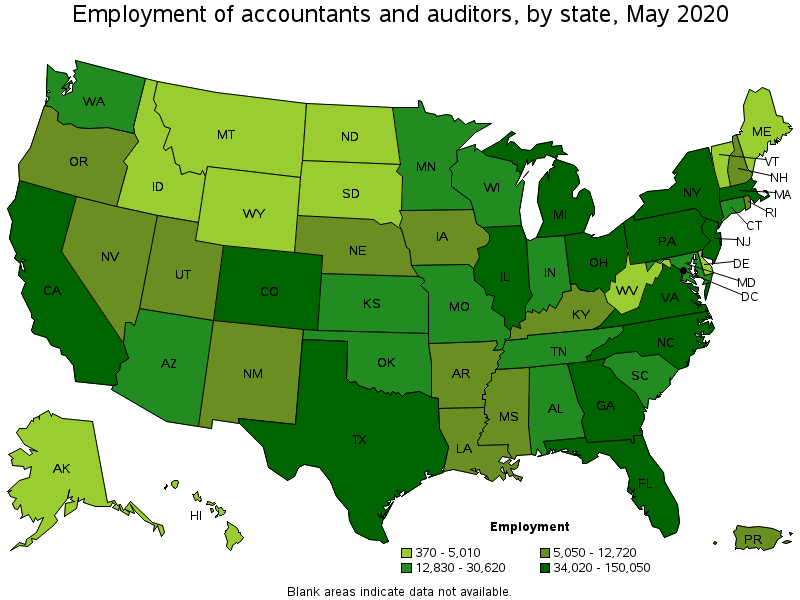
States with the highest employment level in Accountants and Auditors:
| State | Employment (1) | Employment per thousand jobs | Location quotient (9) | Hourly mean wage | Annual mean wage (2) |
|---|---|---|---|---|---|
| California | 150,050 | 9.13 | 1.00 | $ 42.37 | $ 88,130 |
| New York | 112,360 | 12.93 | 1.41 | $ 48.77 | $ 101,440 |
| Texas | 109,470 | 9.05 | 0.99 | $ 38.54 | $ 80,170 |
| Florida | 73,690 | 8.73 | 0.95 | $ 36.04 | $ 74,960 |
| Pennsylvania | 50,240 | 9.11 | 0.99 | $ 37.41 | $ 77,810 |
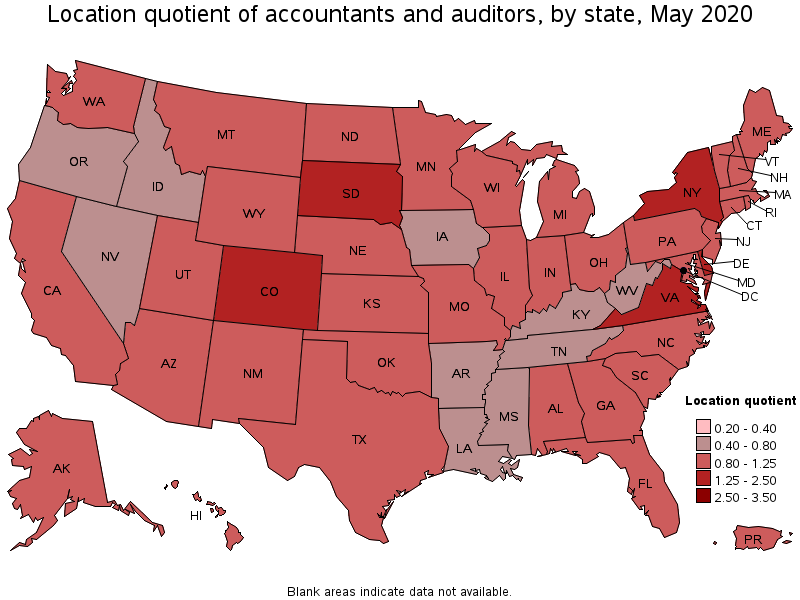
States with the highest concentration of jobs and location quotients in Accountants and Auditors:
| State | Employment (1) | Employment per thousand jobs | Location quotient (9) | Hourly mean wage | Annual mean wage (2) |
|---|---|---|---|---|---|
| District of Columbia | 10,050 | 14.62 | 1.60 | $ 52.95 | $ 110,140 |
| Colorado | 36,470 | 14.15 | 1.54 | $ 40.93 | $ 85,120 |
| New York | 112,360 | 12.93 | 1.41 | $ 48.77 | $ 101,440 |
| South Dakota | 4,940 | 12.01 | 1.31 | $ 33.26 | $ 69,170 |
| Virginia | 43,550 | 11.77 | 1.28 | $ 42.01 | $ 87,380 |
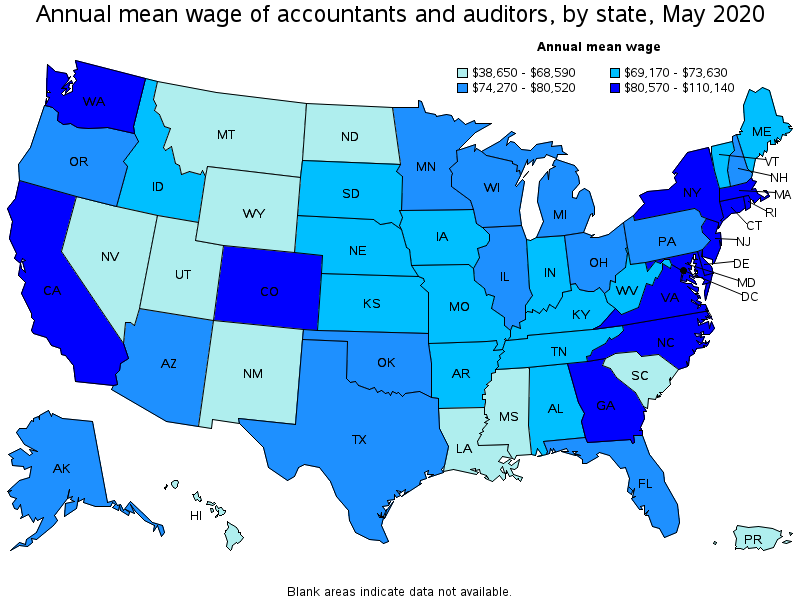
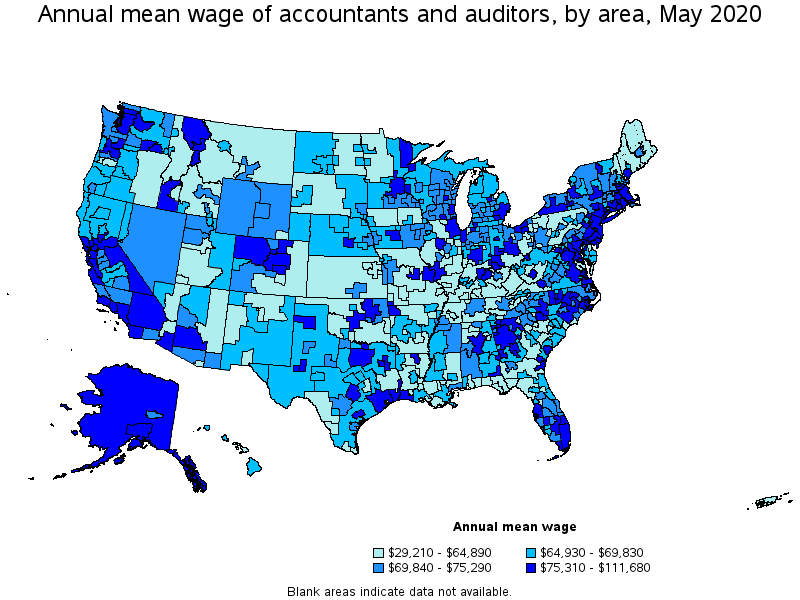
Top paying states for Accountants and Auditors:
| State | Employment (1) | Employment per thousand jobs | Location quotient (9) | Hourly mean wage | Annual mean wage (2) |
|---|---|---|---|---|---|
| District of Columbia | 10,050 | 14.62 | 1.60 | $ 52.95 | $ 110,140 |
| New York | 112,360 | 12.93 | 1.41 | $ 48.77 | $ 101,440 |
| New Jersey | 39,060 | 10.33 | 1.13 | $ 46.28 | $ 96,260 |
| Massachusetts | 34,710 | 10.36 | 1.13 | $ 42.71 | $ 88,830 |
| California | 150,050 | 9.13 | 1.00 | $ 42.37 | $ 88,130 |
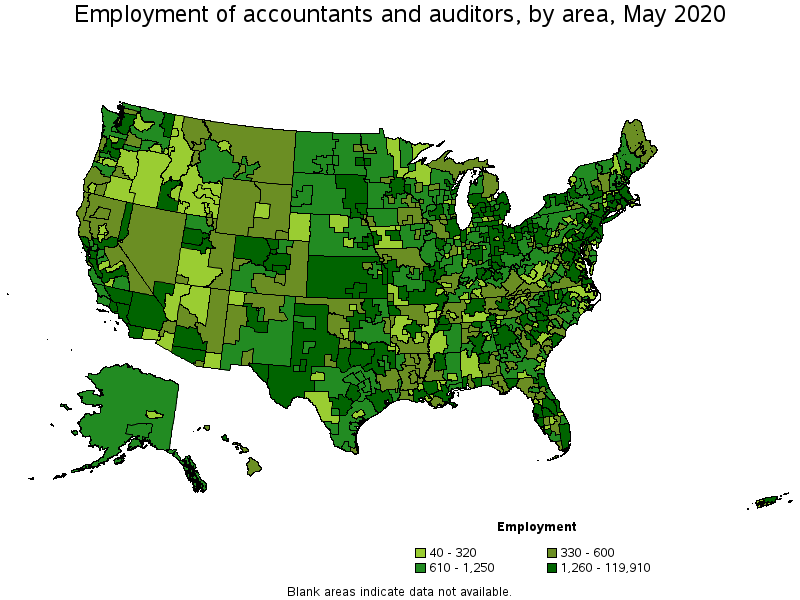
Metropolitan areas with the highest employment level in Accountants and Auditors:
| Metropolitan area | Employment (1) | Employment per thousand jobs | Location quotient (9) | Hourly mean wage | Annual mean wage (2) |
|---|---|---|---|---|---|
| New York-Newark-Jersey City, NY-NJ-PA | 119,910 | 13.57 | 1.48 | $ 50.83 | $ 105,720 |
| Los Angeles-Long Beach-Anaheim, CA | 61,740 | 10.60 | 1.16 | $ 40.22 | $ 83,660 |
| Chicago-Naperville-Elgin, IL-IN-WI | 42,080 | 9.65 | 1.05 | $ 37.81 | $ 78,640 |
| Washington-Arlington-Alexandria, DC-VA-MD-WV | 41,890 | 13.86 | 1.51 | $ 47.13 | $ 98,030 |
| Dallas-Fort Worth-Arlington, TX | 37,040 | 10.32 | 1.13 | $ 40.31 | $ 83,850 |
| Houston-The Woodlands-Sugar Land, TX | 31,270 | 10.53 | 1.15 | $ 40.30 | $ 83,820 |
| Boston-Cambridge-Nashua, MA-NH | 30,130 | 11.58 | 1.26 | $ 43.60 | $ 90,690 |
| Philadelphia-Camden-Wilmington, PA-NJ-DE-MD | 29,540 | 10.96 | 1.20 | $ 41.21 | $ 85,720 |
| Miami-Fort Lauderdale-West Palm Beach, FL | 27,090 | 10.80 | 1.18 | $ 38.52 | $ 80,110 |
| Atlanta-Sandy Springs-Roswell, GA | 25,740 | 9.77 | 1.07 | $ 42.18 | $ 87,730 |
Metropolitan areas with the highest concentration of jobs and location quotients in Accountants and Auditors:
| Metropolitan area | Employment (1) | Employment per thousand jobs | Location quotient (9) | Hourly mean wage | Annual mean wage (2) |
|---|---|---|---|---|---|
| Parkersburg-Vienna, WV | 620 | 18.12 | 1.98 | $ 39.61 | $ 82,400 |
| Denver-Aurora-Lakewood, CO | 24,390 | 16.74 | 1.83 | $ 42.62 | $ 88,650 |
| Midland, TX | 1,610 | 16.16 | 1.76 | $ 49.58 | $ 103,120 |
| Bay City, MI | 480 | 15.71 | 1.71 | $ 36.08 | $ 75,050 |
| Boulder, CO | 2,810 | 15.51 | 1.69 | $ 40.09 | $ 83,380 |
| Bridgeport-Stamford-Norwalk, CT | 5,560 | 14.76 | 1.61 | $ 45.08 | $ 93,780 |
| Montgomery, AL | 2,260 | 14.57 | 1.59 | $ 33.34 | $ 69,350 |
| Bismarck, ND | 990 | 14.53 | 1.59 | $ 32.73 | $ 68,080 |
| Birmingham-Hoover, AL | 7,180 | 14.42 | 1.57 | $ 36.85 | $ 76,650 |
| San Jose-Sunnyvale-Santa Clara, CA | 15,360 | 13.92 | 1.52 | $ 49.48 | $ 102,920 |
Top paying metropolitan areas for Accountants and Auditors:
| Metropolitan area | Employment (1) | Employment per thousand jobs | Location quotient (9) | Hourly mean wage | Annual mean wage (2) |
|---|---|---|---|---|---|
| Salinas, CA | 690 | 4.02 | 0.44 | $ 53.69 | $ 111,680 |
| New York-Newark-Jersey City, NY-NJ-PA | 119,910 | 13.57 | 1.48 | $ 50.83 | $ 105,720 |
| Midland, TX | 1,610 | 16.16 | 1.76 | $ 49.58 | $ 103,120 |
| San Jose-Sunnyvale-Santa Clara, CA | 15,360 | 13.92 | 1.52 | $ 49.48 | $ 102,920 |
| San Francisco-Oakland-Hayward, CA | 24,510 | 10.52 | 1.15 | $ 48.60 | $ 101,090 |
| Washington-Arlington-Alexandria, DC-VA-MD-WV | 41,890 | 13.86 | 1.51 | $ 47.13 | $ 98,030 |
| Midland, MI | 250 | 7.96 | 0.87 | $ 45.28 | $ 94,170 |
| Bridgeport-Stamford-Norwalk, CT | 5,560 | 14.76 | 1.61 | $ 45.08 | $ 93,780 |
| Lima, OH | 260 | 5.60 | 0.61 | $ 44.91 | $ 93,410 |
| Santa Rosa, CA | 1,730 | 8.95 | 0.98 | $ 44.34 | $ 92,220 |
Nonmetropolitan areas with the highest employment in Accountants and Auditors:
| Nonmetropolitan area | Employment (1) | Employment per thousand jobs | Location quotient (9) | Hourly mean wage | Annual mean wage (2) |
|---|---|---|---|---|---|
| Kansas nonmetropolitan area | 3,070 | 8.10 | 0.88 | $ 30.52 | $ 63,480 |
| North Northeastern Ohio nonmetropolitan area (noncontiguous) | 1,920 | 6.16 | 0.67 | $ 33.74 | $ 70,180 |
| West Northwestern Ohio nonmetropolitan area | 1,550 | 6.50 | 0.71 | $ 33.44 | $ 69,550 |
| North Texas Region of Texas nonmetropolitan area | 1,480 | 5.52 | 0.60 | $ 32.30 | $ 67,180 |
| Balance of Lower Peninsula of Michigan nonmetropolitan area | 1,470 | 5.98 | 0.65 | $ 33.03 | $ 68,690 |
Nonmetropolitan areas with the highest concentration of jobs and location quotients in Accountants and Auditors:
| Nonmetropolitan area | Employment (1) | Employment per thousand jobs | Location quotient (9) | Hourly mean wage | Annual mean wage (2) |
|---|---|---|---|---|---|
| West South Dakota nonmetropolitan area | 700 | 12.04 | 1.31 | $ 30.52 | $ 63,470 |
| Northwest Colorado nonmetropolitan area | 1,350 | 11.80 | 1.29 | $ 44.87 | $ 93,330 |
| East North Dakota nonmetropolitan area | 700 | 11.44 | 1.25 | $ 26.01 | $ 54,090 |
| Alaska nonmetropolitan area | 1,070 | 10.73 | 1.17 | $ 39.17 | $ 81,460 |
| Northern Vermont nonmetropolitan area | 690 | 10.48 | 1.14 | $ 33.26 | $ 69,180 |
Top paying nonmetropolitan areas for Accountants and Auditors:
| Nonmetropolitan area | Employment (1) | Employment per thousand jobs | Location quotient (9) | Hourly mean wage | Annual mean wage (2) |
|---|---|---|---|---|---|
| Northwest Colorado nonmetropolitan area | 1,350 | 11.80 | 1.29 | $ 44.87 | $ 93,330 |
| Eastern Sierra-Mother Lode Region of California nonmetropolitan area | 360 | 6.50 | 0.71 | $ 40.55 | $ 84,340 |
| Alaska nonmetropolitan area | 1,070 | 10.73 | 1.17 | $ 39.17 | $ 81,460 |
| North Georgia nonmetropolitan area | 640 | 3.87 | 0.42 | $ 37.72 | $ 78,460 |
| West Montana nonmetropolitan area | 430 | 5.72 | 0.62 | $ 37.26 | $ 77,490 |
These estimates are calculated with data collected from employers in all industry sectors, all metropolitan and nonmetropolitan areas, and all states and the District of Columbia. The top employment and wage figures are provided above. The complete list is available in the downloadable XLS files.
The percentile wage estimate is the value of a wage below which a certain percent of workers fall. The median wage is the 50th percentile wage estimate—50 percent of workers earn less than the median and 50 percent of workers earn more than the median. More about percentile wages.
(1) Estimates for detailed occupations do not sum to the totals because the totals include occupations not shown separately. Estimates do not include self-employed workers.
(2) Annual wages have been calculated by multiplying the hourly mean wage by a "year-round, full-time" hours figure of 2,080 hours; for those occupations where there is not an hourly wage published, the annual wage has been directly calculated from the reported survey data.
(3) The relative standard error (RSE) is a measure of the reliability of a survey statistic. The smaller the relative standard error, the more precise the estimate.
(9) The location quotient is the ratio of the area concentration of occupational employment to the national average concentration. A location quotient greater than one indicates the occupation has a higher share of employment than average, and a location quotient less than one indicates the occupation is less prevalent in the area than average.
Other OEWS estimates and related information:
May 2020 National Occupational Employment and Wage Estimates
May 2020 State Occupational Employment and Wage Estimates
May 2020 Metropolitan and Nonmetropolitan Area Occupational Employment and Wage Estimates
May 2020 National Industry-Specific Occupational Employment and Wage Estimates
Last Modified Date: March 31, 2021