
An official website of the United States government
An official website of the United States government
The .gov means it's official.
Federal government websites often end in .gov or .mil. Before sharing sensitive information,
make sure you're on a federal government site.
The site is secure.
The
https:// ensures that you are connecting to the official website and that any
information you provide is encrypted and transmitted securely.
This occupation includes the 2018 SOC occupations 19-3033 Clinical and Counseling Psychologists and 19-3034 School Psychologists and the 2010 SOC occupation 19-3031 Clinical, Counseling, and School Psychologists.
Employment estimate and mean wage estimates for Clinical, Counseling, and School Psychologists:
| Employment (1) | Employment RSE (3) |
Mean hourly wage |
Mean annual wage (2) |
Wage RSE (3) |
|---|---|---|---|---|
| 111,320 | 1.5 % | $ 42.93 | $ 89,290 | 1.1 % |
Percentile wage estimates for Clinical, Counseling, and School Psychologists:
| Percentile | 10% | 25% | 50% (Median) |
75% | 90% |
|---|---|---|---|---|---|
| Hourly Wage | $ 22.31 | $ 29.21 | $ 38.37 | $ 50.41 | $ 66.61 |
| Annual Wage (2) | $ 46,410 | $ 60,750 | $ 79,820 | $ 104,860 | $ 138,550 |
Industries with the highest published employment and wages for Clinical, Counseling, and School Psychologists are provided. For a list of all industries with employment in Clinical, Counseling, and School Psychologists, see the Create Customized Tables function.
Industries with the highest levels of employment in Clinical, Counseling, and School Psychologists:
| Industry | Employment (1) | Percent of industry employment | Hourly mean wage | Annual mean wage (2) |
|---|---|---|---|---|
| Elementary and Secondary Schools | 44,970 | 0.55 | $ 38.93 | $ 80,960 |
| Offices of Other Health Practitioners | 20,060 | 2.22 | $ 48.97 | $ 101,860 |
| Offices of Physicians | 6,400 | 0.25 | $ 47.88 | $ 99,590 |
| Individual and Family Services | 6,070 | 0.24 | $ 40.39 | $ 84,000 |
| Outpatient Care Centers | 5,430 | 0.57 | $ 52.45 | $ 109,100 |
Industries with the highest concentration of employment in Clinical, Counseling, and School Psychologists:
| Industry | Employment (1) | Percent of industry employment | Hourly mean wage | Annual mean wage (2) |
|---|---|---|---|---|
| Offices of Other Health Practitioners | 20,060 | 2.22 | $ 48.97 | $ 101,860 |
| Psychiatric and Substance Abuse Hospitals | 3,950 | 1.63 | $ 43.33 | $ 90,130 |
| Educational Support Services | 2,580 | 1.39 | $ 38.70 | $ 80,500 |
| Outpatient Care Centers | 5,430 | 0.57 | $ 52.45 | $ 109,100 |
| Elementary and Secondary Schools | 44,970 | 0.55 | $ 38.93 | $ 80,960 |
Top paying industries for Clinical, Counseling, and School Psychologists:
| Industry | Employment (1) | Percent of industry employment | Hourly mean wage | Annual mean wage (2) |
|---|---|---|---|---|
| Outpatient Care Centers | 5,430 | 0.57 | $ 52.45 | $ 109,100 |
| Child Day Care Services | 200 | 0.03 | $ 50.80 | $ 105,670 |
| Home Health Care Services | 310 | 0.02 | $ 49.77 | $ 103,520 |
| Offices of Other Health Practitioners | 20,060 | 2.22 | $ 48.97 | $ 101,860 |
| Junior Colleges | 110 | 0.02 | $ 48.31 | $ 100,470 |
States and areas with the highest published employment, location quotients, and wages for Clinical, Counseling, and School Psychologists are provided. For a list of all areas with employment in Clinical, Counseling, and School Psychologists, see the Create Customized Tables function.
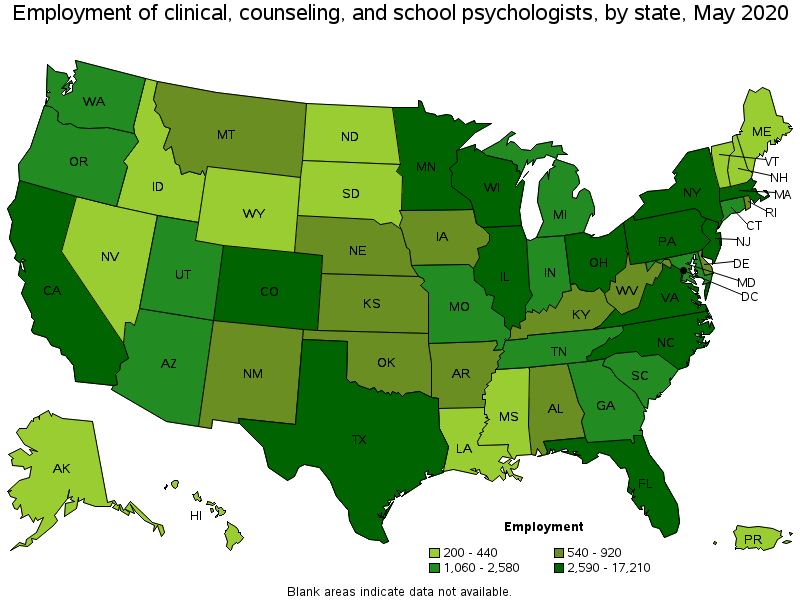
States with the highest employment level in Clinical, Counseling, and School Psychologists:
| State | Employment (1) | Employment per thousand jobs | Location quotient (9) | Hourly mean wage | Annual mean wage (2) |
|---|---|---|---|---|---|
| California | 17,210 | 1.05 | 1.31 | $ 55.69 | $ 115,830 |
| New York | 9,900 | 1.14 | 1.42 | $ 46.65 | $ 97,030 |
| Texas | 8,930 | 0.74 | 0.92 | $ 35.18 | $ 73,160 |
| Illinois | 5,610 | 1.00 | 1.25 | $ 38.98 | $ 81,070 |
| Florida | 5,520 | 0.65 | 0.82 | $ 37.22 | $ 77,410 |
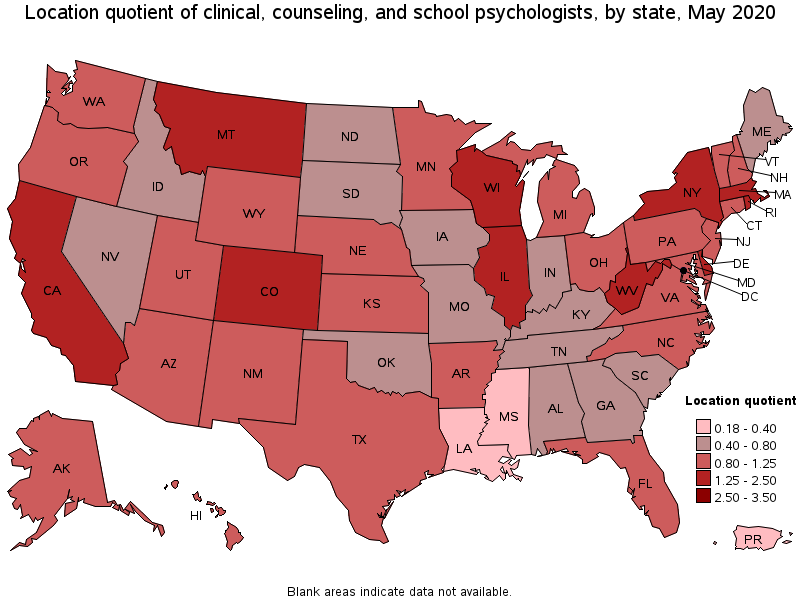
States with the highest concentration of jobs and location quotients in Clinical, Counseling, and School Psychologists:
| State | Employment (1) | Employment per thousand jobs | Location quotient (9) | Hourly mean wage | Annual mean wage (2) |
|---|---|---|---|---|---|
| Delaware | 570 | 1.34 | 1.67 | $ 38.47 | $ 80,030 |
| Massachusetts | 4,330 | 1.29 | 1.62 | $ 42.87 | $ 89,170 |
| Rhode Island | 560 | 1.26 | 1.57 | $ 40.80 | $ 84,860 |
| Wisconsin | 3,250 | 1.20 | 1.50 | $ 43.35 | $ 90,170 |
| Montana | 550 | 1.20 | 1.50 | $ 32.27 | $ 67,120 |
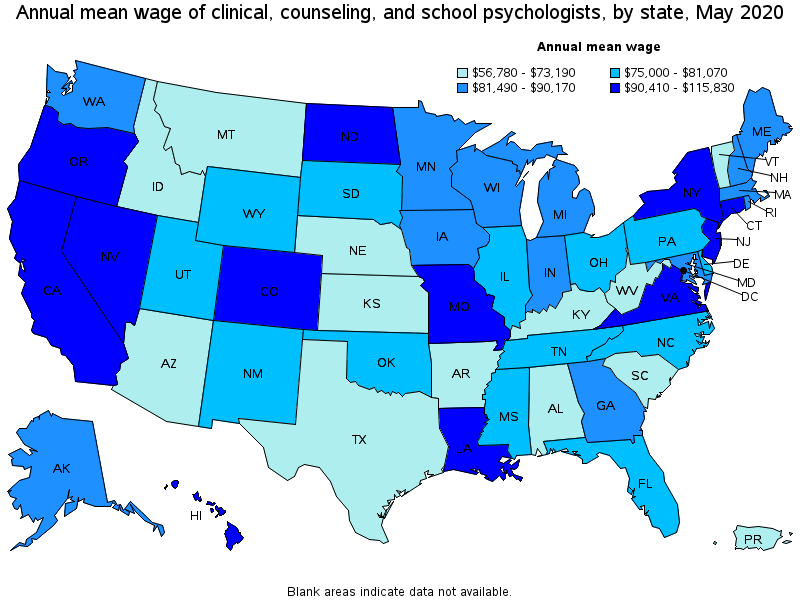
Top paying states for Clinical, Counseling, and School Psychologists:
| State | Employment (1) | Employment per thousand jobs | Location quotient (9) | Hourly mean wage | Annual mean wage (2) |
|---|---|---|---|---|---|
| California | 17,210 | 1.05 | 1.31 | $ 55.69 | $ 115,830 |
| Hawaii | 410 | 0.72 | 0.89 | $ 53.26 | $ 110,780 |
| Louisiana | 270 | 0.15 | 0.18 | $ 52.49 | $ 109,180 |
| Oregon | 1,520 | 0.84 | 1.05 | $ 51.92 | $ 108,000 |
| District of Columbia | 660 | 0.96 | 1.20 | $ 51.41 | $ 106,920 |
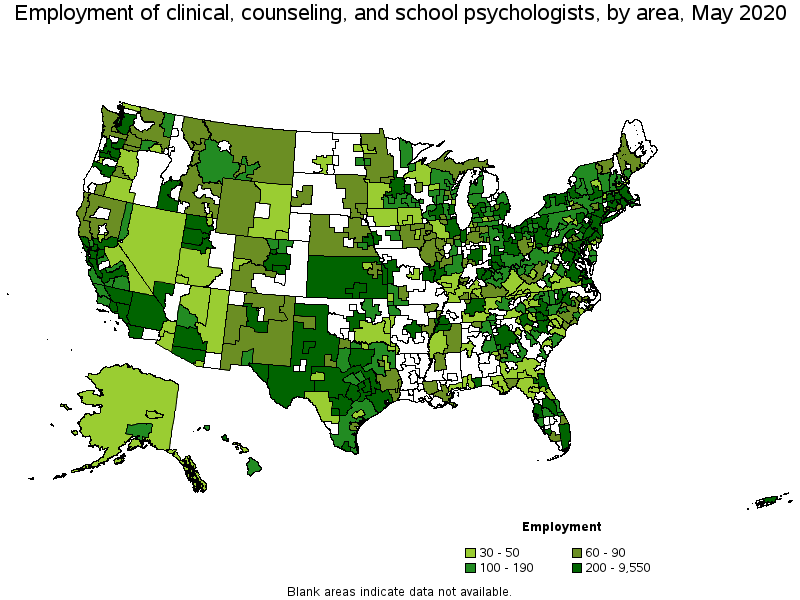
Metropolitan areas with the highest employment level in Clinical, Counseling, and School Psychologists:
| Metropolitan area | Employment (1) | Employment per thousand jobs | Location quotient (9) | Hourly mean wage | Annual mean wage (2) |
|---|---|---|---|---|---|
| New York-Newark-Jersey City, NY-NJ-PA | 9,550 | 1.08 | 1.35 | $ 49.15 | $ 102,230 |
| Los Angeles-Long Beach-Anaheim, CA | 5,380 | 0.92 | 1.15 | $ 60.10 | $ 125,020 |
| Chicago-Naperville-Elgin, IL-IN-WI | 4,760 | 1.09 | 1.36 | $ 39.83 | $ 82,850 |
| San Francisco-Oakland-Hayward, CA | 2,930 | 1.26 | 1.57 | $ 52.36 | $ 108,920 |
| Boston-Cambridge-Nashua, MA-NH | 2,870 | 1.10 | 1.38 | $ 43.23 | $ 89,920 |
| Philadelphia-Camden-Wilmington, PA-NJ-DE-MD | 2,720 | 1.01 | 1.26 | $ 38.91 | $ 80,940 |
| Washington-Arlington-Alexandria, DC-VA-MD-WV | 2,520 | 0.83 | 1.04 | $ 46.77 | $ 97,280 |
| Dallas-Fort Worth-Arlington, TX | 2,310 | 0.64 | 0.80 | $ 35.75 | $ 74,370 |
| Miami-Fort Lauderdale-West Palm Beach, FL | 2,300 | 0.92 | 1.15 | $ 37.10 | $ 77,170 |
| Houston-The Woodlands-Sugar Land, TX | 2,010 | 0.68 | 0.84 | $ 38.98 | $ 81,090 |
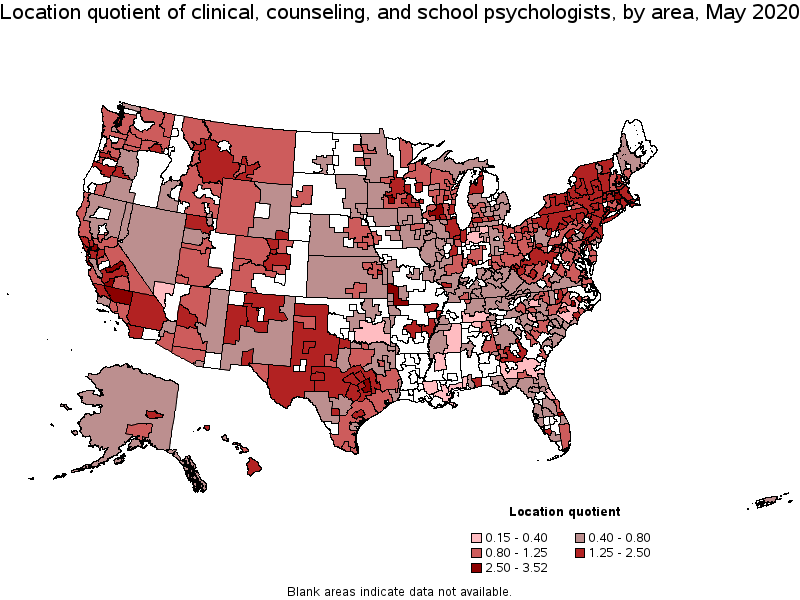
Metropolitan areas with the highest concentration of jobs and location quotients in Clinical, Counseling, and School Psychologists:
| Metropolitan area | Employment (1) | Employment per thousand jobs | Location quotient (9) | Hourly mean wage | Annual mean wage (2) |
|---|---|---|---|---|---|
| Goldsboro, NC | 120 | 2.81 | 3.52 | $ 36.84 | $ 76,630 |
| Hanford-Corcoran, CA | 110 | 2.48 | 3.10 | $ 54.49 | $ 113,330 |
| Madison, WI | 940 | 2.45 | 3.06 | $ 41.50 | $ 86,310 |
| Mankato-North Mankato, MN | 120 | 2.44 | 3.04 | $ 43.21 | $ 89,870 |
| New Bedford, MA | 140 | 2.39 | 2.99 | $ 41.51 | $ 86,350 |
| Cumberland, MD-WV | 80 | 2.33 | 2.91 | $ 39.52 | $ 82,200 |
| Santa Cruz-Watsonville, CA | 210 | 2.32 | 2.90 | $ 40.88 | $ 85,020 |
| Madera, CA | 100 | 2.20 | 2.75 | $ 55.03 | $ 114,450 |
| Gettysburg, PA | 70 | 2.19 | 2.74 | $ 31.00 | $ 64,490 |
| College Station-Bryan, TX | 230 | 2.15 | 2.68 | $ 26.30 | $ 54,700 |
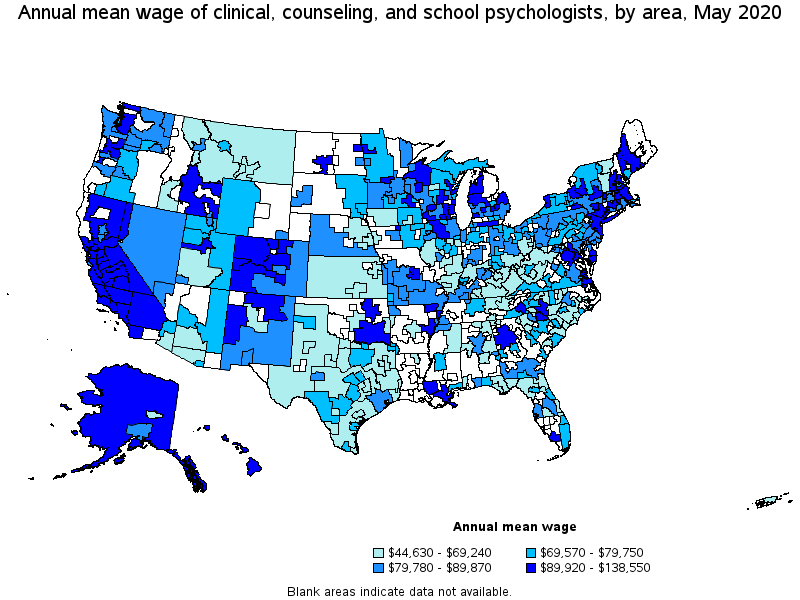
Top paying metropolitan areas for Clinical, Counseling, and School Psychologists:
| Metropolitan area | Employment (1) | Employment per thousand jobs | Location quotient (9) | Hourly mean wage | Annual mean wage (2) |
|---|---|---|---|---|---|
| Santa Rosa, CA | 240 | 1.22 | 1.53 | $ 66.61 | $ 138,550 |
| Jefferson City, MO | 40 | 0.60 | 0.75 | $ 64.25 | $ 133,640 |
| Los Angeles-Long Beach-Anaheim, CA | 5,380 | 0.92 | 1.15 | $ 60.10 | $ 125,020 |
| San Diego-Carlsbad, CA | 1,570 | 1.12 | 1.40 | $ 58.41 | $ 121,490 |
| Oxnard-Thousand Oaks-Ventura, CA | 260 | 0.88 | 1.10 | $ 58.09 | $ 120,830 |
| Portland-Vancouver-Hillsboro, OR-WA | 920 | 0.81 | 1.01 | $ 58.01 | $ 120,660 |
| San Luis Obispo-Paso Robles-Arroyo Grande, CA | 170 | 1.56 | 1.96 | $ 57.38 | $ 119,350 |
| Kahului-Wailuku-Lahaina, HI | 50 | 0.80 | 1.00 | $ 56.75 | $ 118,050 |
| Modesto, CA | 140 | 0.76 | 0.95 | $ 56.71 | $ 117,960 |
| Napa, CA | 140 | 1.98 | 2.48 | $ 56.66 | $ 117,860 |
Nonmetropolitan areas with the highest employment in Clinical, Counseling, and School Psychologists:
| Nonmetropolitan area | Employment (1) | Employment per thousand jobs | Location quotient (9) | Hourly mean wage | Annual mean wage (2) |
|---|---|---|---|---|---|
| Hill Country Region of Texas nonmetropolitan area | 250 | 1.32 | 1.65 | $ 29.90 | $ 62,200 |
| North Northeastern Ohio nonmetropolitan area (noncontiguous) | 230 | 0.72 | 0.90 | $ 34.98 | $ 72,750 |
| West Texas Region of Texas nonmetropolitan area | 220 | 1.13 | 1.41 | $ 28.84 | $ 59,990 |
| Western Pennsylvania nonmetropolitan area | 220 | 1.53 | 1.91 | $ 39.94 | $ 83,070 |
| Kansas nonmetropolitan area | 200 | 0.54 | 0.67 | $ 30.72 | $ 63,900 |
Nonmetropolitan areas with the highest concentration of jobs and location quotients in Clinical, Counseling, and School Psychologists:
| Nonmetropolitan area | Employment (1) | Employment per thousand jobs | Location quotient (9) | Hourly mean wage | Annual mean wage (2) |
|---|---|---|---|---|---|
| Southwest Missouri nonmetropolitan area | 180 | 2.64 | 3.30 | $ 40.99 | $ 85,260 |
| Massachusetts nonmetropolitan area | 100 | 1.76 | 2.20 | $ 40.21 | $ 83,630 |
| Western Pennsylvania nonmetropolitan area | 220 | 1.53 | 1.91 | $ 39.94 | $ 83,070 |
| Central New Hampshire nonmetropolitan area | 140 | 1.52 | 1.90 | $ 43.80 | $ 91,110 |
| Northwest Lower Peninsula of Michigan nonmetropolitan area | 150 | 1.41 | 1.76 | $ 52.40 | $ 108,990 |
Top paying nonmetropolitan areas for Clinical, Counseling, and School Psychologists:
| Nonmetropolitan area | Employment (1) | Employment per thousand jobs | Location quotient (9) | Hourly mean wage | Annual mean wage (2) |
|---|---|---|---|---|---|
| Eastern Sierra-Mother Lode Region of California nonmetropolitan area | 50 | 0.92 | 1.15 | $ 53.81 | $ 111,930 |
| Northwest Colorado nonmetropolitan area | 80 | 0.67 | 0.83 | $ 52.65 | $ 109,510 |
| Northwest Lower Peninsula of Michigan nonmetropolitan area | 150 | 1.41 | 1.76 | $ 52.40 | $ 108,990 |
| Southwest Maine nonmetropolitan area | 70 | 0.37 | 0.46 | $ 50.45 | $ 104,940 |
| Hawaii / Kauai nonmetropolitan area | 100 | 1.05 | 1.32 | $ 50.06 | $ 104,130 |
These estimates are calculated with data collected from employers in all industry sectors, all metropolitan and nonmetropolitan areas, and all states and the District of Columbia. The top employment and wage figures are provided above. The complete list is available in the downloadable XLS files.
The percentile wage estimate is the value of a wage below which a certain percent of workers fall. The median wage is the 50th percentile wage estimate—50 percent of workers earn less than the median and 50 percent of workers earn more than the median. More about percentile wages.
(1) Estimates for detailed occupations do not sum to the totals because the totals include occupations not shown separately. Estimates do not include self-employed workers.
(2) Annual wages have been calculated by multiplying the hourly mean wage by a "year-round, full-time" hours figure of 2,080 hours; for those occupations where there is not an hourly wage published, the annual wage has been directly calculated from the reported survey data.
(3) The relative standard error (RSE) is a measure of the reliability of a survey statistic. The smaller the relative standard error, the more precise the estimate.
(9) The location quotient is the ratio of the area concentration of occupational employment to the national average concentration. A location quotient greater than one indicates the occupation has a higher share of employment than average, and a location quotient less than one indicates the occupation is less prevalent in the area than average.
Other OEWS estimates and related information:
May 2020 National Occupational Employment and Wage Estimates
May 2020 State Occupational Employment and Wage Estimates
May 2020 Metropolitan and Nonmetropolitan Area Occupational Employment and Wage Estimates
May 2020 National Industry-Specific Occupational Employment and Wage Estimates
Last Modified Date: March 31, 2021