
An official website of the United States government
An official website of the United States government
The .gov means it's official.
Federal government websites often end in .gov or .mil. Before sharing sensitive information,
make sure you're on a federal government site.
The site is secure.
The
https:// ensures that you are connecting to the official website and that any
information you provide is encrypted and transmitted securely.
Perform any combination of light cleaning duties to maintain private households or commercial establishments, such as hotels and hospitals, in a clean and orderly manner. Duties may include making beds, replenishing linens, cleaning rooms and halls, and vacuuming.
Employment estimate and mean wage estimates for Maids and Housekeeping Cleaners:
| Employment (1) | Employment RSE (3) |
Mean hourly wage |
Mean annual wage (2) |
Wage RSE (3) |
|---|---|---|---|---|
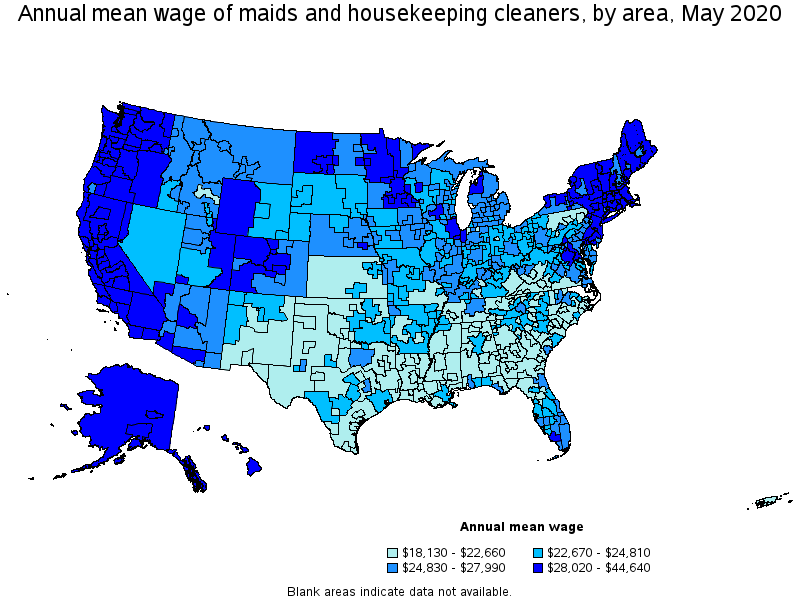
| 795,590 | 1.0 % | $ 13.47 | $ 28,010 | 0.3 % |
Percentile wage estimates for Maids and Housekeeping Cleaners:
| Percentile | 10% | 25% | 50% (Median) |
75% | 90% |
|---|---|---|---|---|---|
| Hourly Wage | $ 9.31 | $ 10.69 | $ 12.61 | $ 15.06 | $ 18.82 |
| Annual Wage (2) | $ 19,370 | $ 22,230 | $ 26,220 | $ 31,320 | $ 39,140 |
Industries with the highest published employment and wages for Maids and Housekeeping Cleaners are provided. For a list of all industries with employment in Maids and Housekeeping Cleaners, see the Create Customized Tables function.
Industries with the highest levels of employment in Maids and Housekeeping Cleaners:
| Industry | Employment (1) | Percent of industry employment | Hourly mean wage | Annual mean wage (2) |
|---|---|---|---|---|
| Traveler Accommodation | 355,930 | 23.48 | $ 13.18 | $ 27,420 |
| Services to Buildings and Dwellings | 95,360 | 4.48 | $ 13.12 | $ 27,290 |
| General Medical and Surgical Hospitals | 92,630 | 1.66 | $ 15.38 | $ 32,000 |
| Nursing Care Facilities (Skilled Nursing Facilities) | 68,850 | 4.49 | $ 12.65 | $ 26,310 |
| Continuing Care Retirement Communities and Assisted Living Facilities for the Elderly | 46,020 | 4.89 | $ 13.03 | $ 27,100 |
Industries with the highest concentration of employment in Maids and Housekeeping Cleaners:
| Industry | Employment (1) | Percent of industry employment | Hourly mean wage | Annual mean wage (2) |
|---|---|---|---|---|
| Traveler Accommodation | 355,930 | 23.48 | $ 13.18 | $ 27,420 |
| Rooming and Boarding Houses | 2,020 | 20.17 | $ 13.36 | $ 27,800 |
| RV (Recreational Vehicle) Parks and Recreational Camps | 2,770 | 5.47 | $ 12.59 | $ 26,190 |
| Continuing Care Retirement Communities and Assisted Living Facilities for the Elderly | 46,020 | 4.89 | $ 13.03 | $ 27,100 |
| Facilities Support Services | 7,260 | 4.51 | $ 13.32 | $ 27,710 |
Top paying industries for Maids and Housekeeping Cleaners:
| Industry | Employment (1) | Percent of industry employment | Hourly mean wage | Annual mean wage (2) |
|---|---|---|---|---|
| Independent Artists, Writers, and Performers | 30 | 0.06 | $ 25.38 | $ 52,790 |
| Deep Sea, Coastal, and Great Lakes Water Transportation | 50 | 0.15 | $ 23.37 | $ 48,610 |
| Grantmaking and Giving Services | (8) | (8) | $ 22.99 | $ 47,830 |
| Outpatient Care Centers | 3,380 | 0.35 | $ 18.77 | $ 39,040 |
| Insurance Carriers | 30 | (7) | $ 18.44 | $ 38,350 |
States and areas with the highest published employment, location quotients, and wages for Maids and Housekeeping Cleaners are provided. For a list of all areas with employment in Maids and Housekeeping Cleaners, see the Create Customized Tables function.
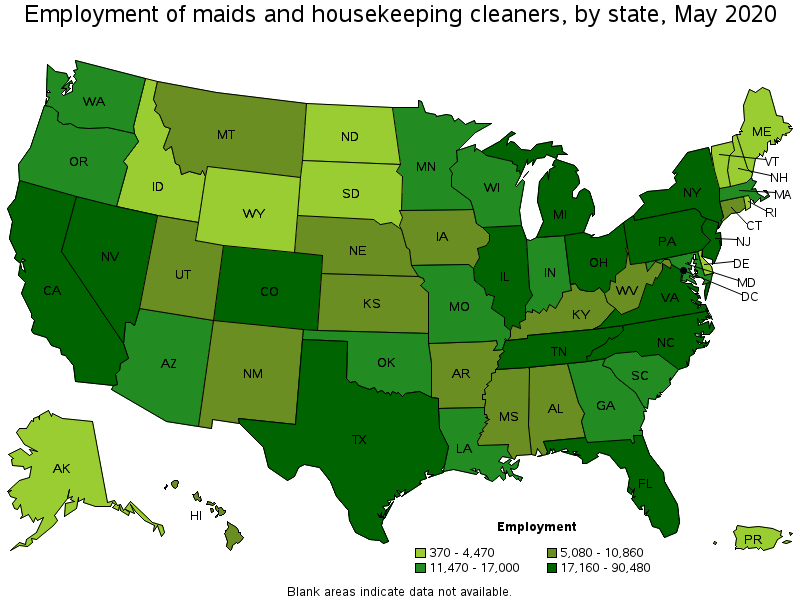
States with the highest employment level in Maids and Housekeeping Cleaners:
| State | Employment (1) | Employment per thousand jobs | Location quotient (9) | Hourly mean wage | Annual mean wage (2) |
|---|---|---|---|---|---|
| California | 90,480 | 5.51 | 0.96 | $ 17.10 | $ 35,560 |
| Florida | 67,530 | 8.00 | 1.40 | $ 11.92 | $ 24,790 |
| Texas | 66,180 | 5.47 | 0.96 | $ 11.34 | $ 23,580 |
| New York | 39,570 | 4.55 | 0.80 | $ 18.48 | $ 38,430 |
| North Carolina | 28,470 | 6.64 | 1.16 | $ 11.77 | $ 24,480 |
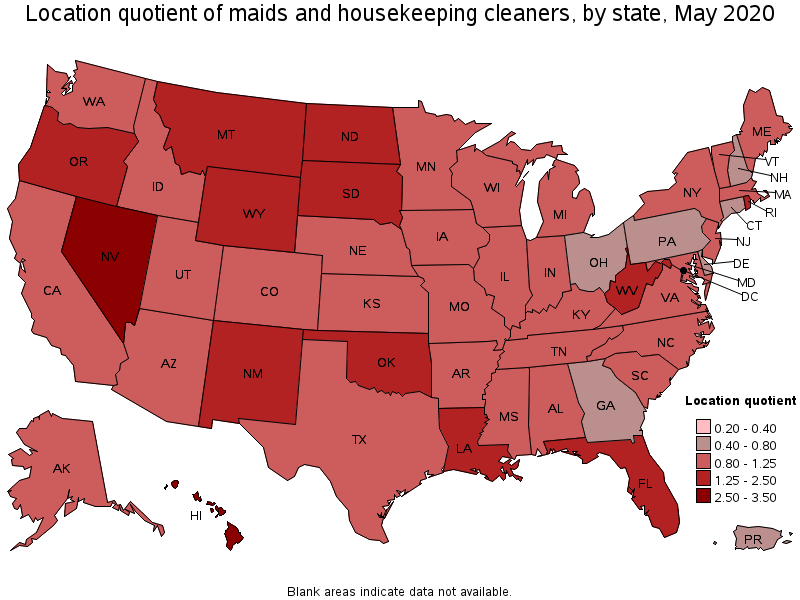
States with the highest concentration of jobs and location quotients in Maids and Housekeeping Cleaners:
| State | Employment (1) | Employment per thousand jobs | Location quotient (9) | Hourly mean wage | Annual mean wage (2) |
|---|---|---|---|---|---|
| Hawaii | 9,930 | 17.31 | 3.03 | $ 19.04 | $ 39,600 |
| Nevada | 17,890 | 14.31 | 2.50 | $ 15.42 | $ 32,070 |
| Montana | 5,080 | 11.14 | 1.95 | $ 12.54 | $ 26,070 |
| Wyoming | 2,750 | 10.49 | 1.83 | $ 12.76 | $ 26,540 |
| South Dakota | 3,890 | 9.47 | 1.66 | $ 11.43 | $ 23,770 |
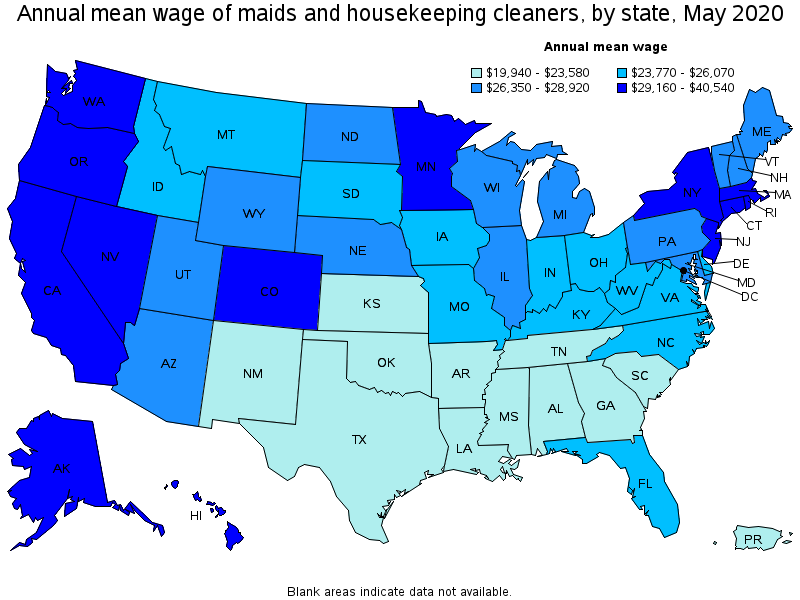
Top paying states for Maids and Housekeeping Cleaners:
| State | Employment (1) | Employment per thousand jobs | Location quotient (9) | Hourly mean wage | Annual mean wage (2) |
|---|---|---|---|---|---|
| District of Columbia | 5,300 | 7.71 | 1.35 | $ 19.49 | $ 40,540 |
| Hawaii | 9,930 | 17.31 | 3.03 | $ 19.04 | $ 39,600 |
| New York | 39,570 | 4.55 | 0.80 | $ 18.48 | $ 38,430 |
| California | 90,480 | 5.51 | 0.96 | $ 17.10 | $ 35,560 |
| Massachusetts | 16,240 | 4.85 | 0.85 | $ 16.19 | $ 33,680 |
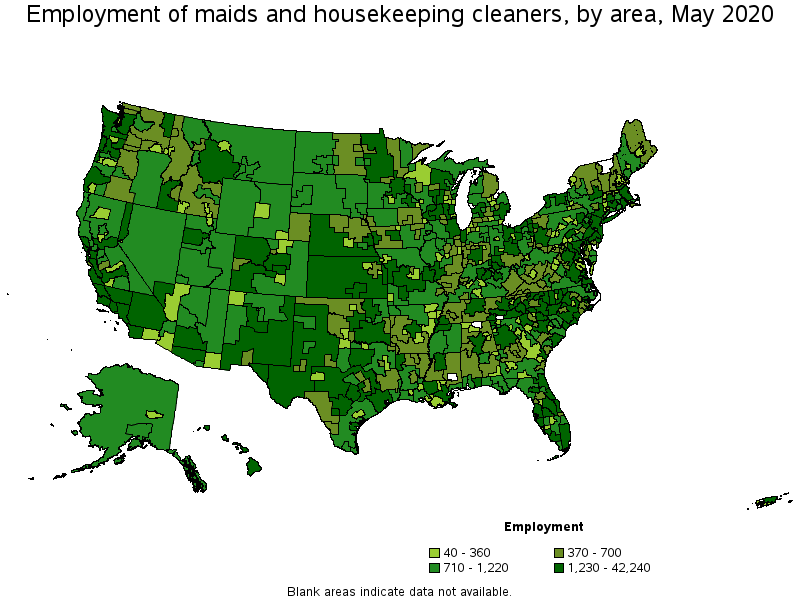
Metropolitan areas with the highest employment level in Maids and Housekeeping Cleaners:
| Metropolitan area | Employment (1) | Employment per thousand jobs | Location quotient (9) | Hourly mean wage | Annual mean wage (2) |
|---|---|---|---|---|---|
| New York-Newark-Jersey City, NY-NJ-PA | 42,240 | 4.78 | 0.84 | $ 18.17 | $ 37,790 |
| Los Angeles-Long Beach-Anaheim, CA | 29,600 | 5.08 | 0.89 | $ 16.19 | $ 33,670 |
| Chicago-Naperville-Elgin, IL-IN-WI | 19,670 | 4.51 | 0.79 | $ 14.09 | $ 29,300 |
| Miami-Fort Lauderdale-West Palm Beach, FL | 18,780 | 7.49 | 1.31 | $ 11.96 | $ 24,870 |
| Washington-Arlington-Alexandria, DC-VA-MD-WV | 17,530 | 5.80 | 1.01 | $ 15.44 | $ 32,110 |
| Dallas-Fort Worth-Arlington, TX | 16,890 | 4.71 | 0.82 | $ 12.05 | $ 25,070 |
| Houston-The Woodlands-Sugar Land, TX | 16,670 | 5.61 | 0.98 | $ 11.44 | $ 23,790 |
| Las Vegas-Henderson-Paradise, NV | 14,850 | 16.46 | 2.88 | $ 15.89 | $ 33,050 |
| Orlando-Kissimmee-Sanford, FL | 14,090 | 11.81 | 2.06 | $ 11.93 | $ 24,810 |
| San Francisco-Oakland-Hayward, CA | 12,390 | 5.31 | 0.93 | $ 21.46 | $ 44,640 |
Metropolitan areas with the highest concentration of jobs and location quotients in Maids and Housekeeping Cleaners:
| Metropolitan area | Employment (1) | Employment per thousand jobs | Location quotient (9) | Hourly mean wage | Annual mean wage (2) |
|---|---|---|---|---|---|
| Kahului-Wailuku-Lahaina, HI | 2,570 | 38.29 | 6.70 | $ 19.07 | $ 39,670 |
| Flagstaff, AZ | 1,220 | 21.46 | 3.75 | $ 13.35 | $ 27,770 |
| Ocean City, NJ | 660 | 19.00 | 3.32 | $ 13.08 | $ 27,210 |
| Homosassa Springs, FL | 530 | 17.50 | 3.06 | $ 11.05 | $ 22,980 |
| Myrtle Beach-Conway-North Myrtle Beach, SC-NC | 2,700 | 17.46 | 3.05 | $ 10.72 | $ 22,290 |
| Las Vegas-Henderson-Paradise, NV | 14,850 | 16.46 | 2.88 | $ 15.89 | $ 33,050 |
| East Stroudsburg, PA | 810 | 16.40 | 2.87 | $ 12.17 | $ 25,310 |
| Wenatchee, WA | 730 | 16.10 | 2.81 | $ 15.57 | $ 32,380 |
| Enid, OK | 350 | 15.09 | 2.64 | $ 9.97 | $ 20,740 |
| Atlantic City-Hammonton, NJ | 1,630 | 14.73 | 2.57 | $ 12.66 | $ 26,330 |
Top paying metropolitan areas for Maids and Housekeeping Cleaners:
| Metropolitan area | Employment (1) | Employment per thousand jobs | Location quotient (9) | Hourly mean wage | Annual mean wage (2) |
|---|---|---|---|---|---|
| San Francisco-Oakland-Hayward, CA | 12,390 | 5.31 | 0.93 | $ 21.46 | $ 44,640 |
| Urban Honolulu, HI | 5,230 | 12.61 | 2.20 | $ 19.89 | $ 41,370 |
| San Jose-Sunnyvale-Santa Clara, CA | 4,600 | 4.17 | 0.73 | $ 19.47 | $ 40,490 |
| Kahului-Wailuku-Lahaina, HI | 2,570 | 38.29 | 6.70 | $ 19.07 | $ 39,670 |
| Vallejo-Fairfield, CA | 730 | 5.49 | 0.96 | $ 18.97 | $ 39,450 |
| Sacramento--Roseville--Arden-Arcade, CA | 5,380 | 5.56 | 0.97 | $ 18.56 | $ 38,610 |
| New York-Newark-Jersey City, NY-NJ-PA | 42,240 | 4.78 | 0.84 | $ 18.17 | $ 37,790 |
| Napa, CA | 890 | 12.85 | 2.25 | $ 17.68 | $ 36,780 |
| Kingston, NY | 390 | 7.08 | 1.24 | $ 17.25 | $ 35,870 |
| Santa Cruz-Watsonville, CA | 560 | 6.11 | 1.07 | $ 17.07 | $ 35,500 |
Nonmetropolitan areas with the highest employment in Maids and Housekeeping Cleaners:
| Nonmetropolitan area | Employment (1) | Employment per thousand jobs | Location quotient (9) | Hourly mean wage | Annual mean wage (2) |
|---|---|---|---|---|---|
| Northwest Colorado nonmetropolitan area | 3,150 | 27.48 | 4.80 | $ 15.94 | $ 33,150 |
| Kansas nonmetropolitan area | 2,950 | 7.79 | 1.36 | $ 10.55 | $ 21,940 |
| Northwest Minnesota nonmetropolitan area | 2,250 | 12.50 | 2.18 | $ 14.40 | $ 29,950 |
| Hawaii / Kauai nonmetropolitan area | 2,140 | 23.16 | 4.05 | $ 16.91 | $ 35,180 |
| Southeast Coastal North Carolina nonmetropolitan area | 2,110 | 8.78 | 1.54 | $ 10.79 | $ 22,450 |
Nonmetropolitan areas with the highest concentration of jobs and location quotients in Maids and Housekeeping Cleaners:
| Nonmetropolitan area | Employment (1) | Employment per thousand jobs | Location quotient (9) | Hourly mean wage | Annual mean wage (2) |
|---|---|---|---|---|---|
| Northwest Colorado nonmetropolitan area | 3,150 | 27.48 | 4.80 | $ 15.94 | $ 33,150 |
| Hawaii / Kauai nonmetropolitan area | 2,140 | 23.16 | 4.05 | $ 16.91 | $ 35,180 |
| Eastern Sierra-Mother Lode Region of California nonmetropolitan area | 1,080 | 19.62 | 3.43 | $ 15.53 | $ 32,290 |
| Coast Oregon nonmetropolitan area | 1,830 | 17.35 | 3.03 | $ 13.79 | $ 28,690 |
| Northeast Minnesota nonmetropolitan area | 650 | 16.52 | 2.89 | $ 15.77 | $ 32,800 |
Top paying nonmetropolitan areas for Maids and Housekeeping Cleaners:
| Nonmetropolitan area | Employment (1) | Employment per thousand jobs | Location quotient (9) | Hourly mean wage | Annual mean wage (2) |
|---|---|---|---|---|---|
| Hawaii / Kauai nonmetropolitan area | 2,140 | 23.16 | 4.05 | $ 16.91 | $ 35,180 |
| Central East New York nonmetropolitan area | 1,100 | 7.32 | 1.28 | $ 16.59 | $ 34,510 |
| Alaska nonmetropolitan area | 790 | 7.94 | 1.39 | $ 16.53 | $ 34,390 |
| Massachusetts nonmetropolitan area | 570 | 10.08 | 1.76 | $ 16.41 | $ 34,130 |
| North Valley-Northern Mountains Region of California nonmetropolitan area | 800 | 8.19 | 1.43 | $ 16.21 | $ 33,720 |
These estimates are calculated with data collected from employers in all industry sectors, all metropolitan and nonmetropolitan areas, and all states and the District of Columbia. The top employment and wage figures are provided above. The complete list is available in the downloadable XLS files.
The percentile wage estimate is the value of a wage below which a certain percent of workers fall. The median wage is the 50th percentile wage estimate—50 percent of workers earn less than the median and 50 percent of workers earn more than the median. More about percentile wages.
(1) Estimates for detailed occupations do not sum to the totals because the totals include occupations not shown separately. Estimates do not include self-employed workers.
(2) Annual wages have been calculated by multiplying the hourly mean wage by a "year-round, full-time" hours figure of 2,080 hours; for those occupations where there is not an hourly wage published, the annual wage has been directly calculated from the reported survey data.
(3) The relative standard error (RSE) is a measure of the reliability of a survey statistic. The smaller the relative standard error, the more precise the estimate.
(7) The value is less than .005 percent of industry employment.
(8) Estimate not released.
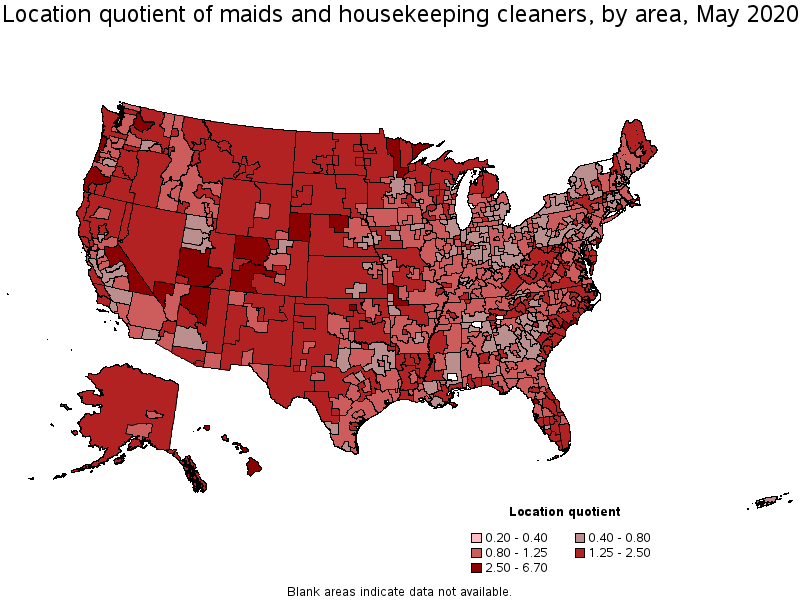
(9) The location quotient is the ratio of the area concentration of occupational employment to the national average concentration. A location quotient greater than one indicates the occupation has a higher share of employment than average, and a location quotient less than one indicates the occupation is less prevalent in the area than average.
Other OEWS estimates and related information:
May 2020 National Occupational Employment and Wage Estimates
May 2020 State Occupational Employment and Wage Estimates
May 2020 Metropolitan and Nonmetropolitan Area Occupational Employment and Wage Estimates
May 2020 National Industry-Specific Occupational Employment and Wage Estimates
Last Modified Date: March 31, 2021