
An official website of the United States government
An official website of the United States government
The .gov means it's official.
Federal government websites often end in .gov or .mil. Before sharing sensitive information,
make sure you're on a federal government site.
The site is secure.
The
https:// ensures that you are connecting to the official website and that any
information you provide is encrypted and transmitted securely.
Operate or maintain stationary engines, boilers, or other mechanical equipment to provide utilities for buildings or industrial processes. Operate equipment such as steam engines, generators, motors, turbines, and steam boilers.
Employment estimate and mean wage estimates for Stationary Engineers and Boiler Operators:
| Employment (1) | Employment RSE (3) |
Mean hourly wage |
Mean annual wage (2) |
Wage RSE (3) |
|---|---|---|---|---|
| 29,550 | 2.2 % | $ 32.77 | $ 68,170 | 1.0 % |
Percentile wage estimates for Stationary Engineers and Boiler Operators:
| Percentile | 10% | 25% | 50% (Median) |
75% | 90% |
|---|---|---|---|---|---|
| Hourly Wage | $ 19.56 | $ 25.31 | $ 31.09 | $ 39.13 | $ 49.80 |
| Annual Wage (2) | $ 40,680 | $ 52,650 | $ 64,680 | $ 81,390 | $ 103,580 |
Industries with the highest published employment and wages for Stationary Engineers and Boiler Operators are provided. For a list of all industries with employment in Stationary Engineers and Boiler Operators, see the Create Customized Tables function.
Industries with the highest levels of employment in Stationary Engineers and Boiler Operators:
| Industry | Employment (1) | Percent of industry employment | Hourly mean wage | Annual mean wage (2) |
|---|---|---|---|---|
| General Medical and Surgical Hospitals | 4,710 | 0.08 | $ 34.76 | $ 72,300 |
| Colleges, Universities, and Professional Schools | 3,010 | 0.10 | $ 31.55 | $ 65,620 |
| Local Government, excluding schools and hospitals (OEWS Designation) | 2,960 | 0.05 | $ 41.70 | $ 86,740 |
| State Government, excluding schools and hospitals (OEWS Designation) | 2,320 | 0.11 | $ 31.91 | $ 66,370 |
| Real Estate | 1,430 | 0.09 | $ 36.95 | $ 76,850 |
Industries with the highest concentration of employment in Stationary Engineers and Boiler Operators:
| Industry | Employment (1) | Percent of industry employment | Hourly mean wage | Annual mean wage (2) |
|---|---|---|---|---|
| Pulp, Paper, and Paperboard Mills | 1,380 | 1.50 | $ 29.48 | $ 61,330 |
| Water, Sewage and Other Systems | 490 | 0.92 | $ 28.91 | $ 60,130 |
| Sawmills and Wood Preservation | 590 | 0.66 | $ 21.55 | $ 44,830 |
| Waste Treatment and Disposal | 560 | 0.57 | $ 31.17 | $ 64,840 |
| Facilities Support Services | 740 | 0.46 | $ 34.67 | $ 72,110 |
Top paying industries for Stationary Engineers and Boiler Operators:
| Industry | Employment (1) | Percent of industry employment | Hourly mean wage | Annual mean wage (2) |
|---|---|---|---|---|
| Outpatient Care Centers | 140 | 0.01 | $ 43.03 | $ 89,510 |
| Local Government, excluding schools and hospitals (OEWS Designation) | 2,960 | 0.05 | $ 41.70 | $ 86,740 |
| Museums, Historical Sites, and Similar Institutions | 80 | 0.06 | $ 40.46 | $ 84,160 |
| Electric Power Generation, Transmission and Distribution | 570 | 0.15 | $ 39.22 | $ 81,580 |
| Aerospace Product and Parts Manufacturing | 210 | 0.04 | $ 38.30 | $ 79,670 |
States and areas with the highest published employment, location quotients, and wages for Stationary Engineers and Boiler Operators are provided. For a list of all areas with employment in Stationary Engineers and Boiler Operators, see the Create Customized Tables function.
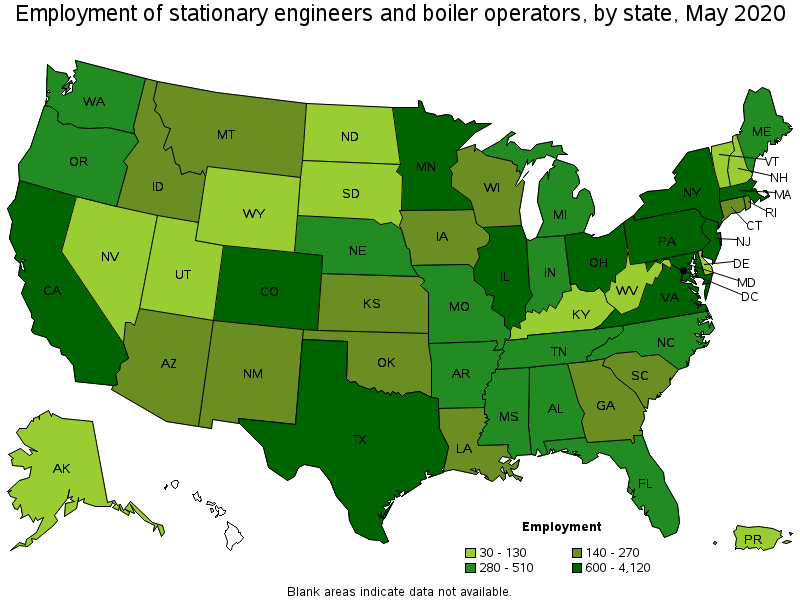
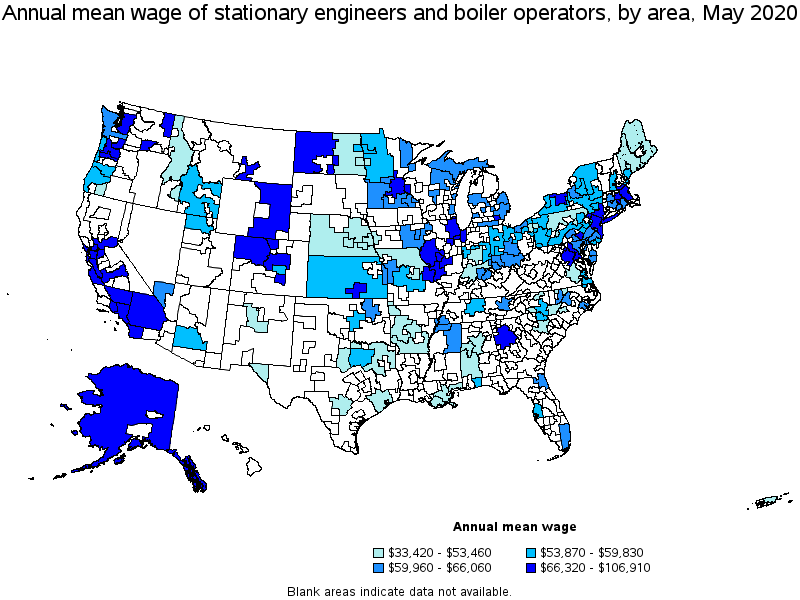
States with the highest employment level in Stationary Engineers and Boiler Operators:
| State | Employment (1) | Employment per thousand jobs | Location quotient (9) | Hourly mean wage | Annual mean wage (2) |
|---|---|---|---|---|---|
| New York | 4,120 | 0.47 | 2.23 | $ 39.88 | $ 82,940 |
| California | 3,480 | 0.21 | 1.00 | $ 41.84 | $ 87,030 |
| Pennsylvania | 1,880 | 0.34 | 1.61 | $ 28.39 | $ 59,050 |
| Texas | 1,770 | 0.15 | 0.69 | $ 22.06 | $ 45,880 |
| Illinois | 1,580 | 0.28 | 1.32 | $ 42.82 | $ 89,050 |
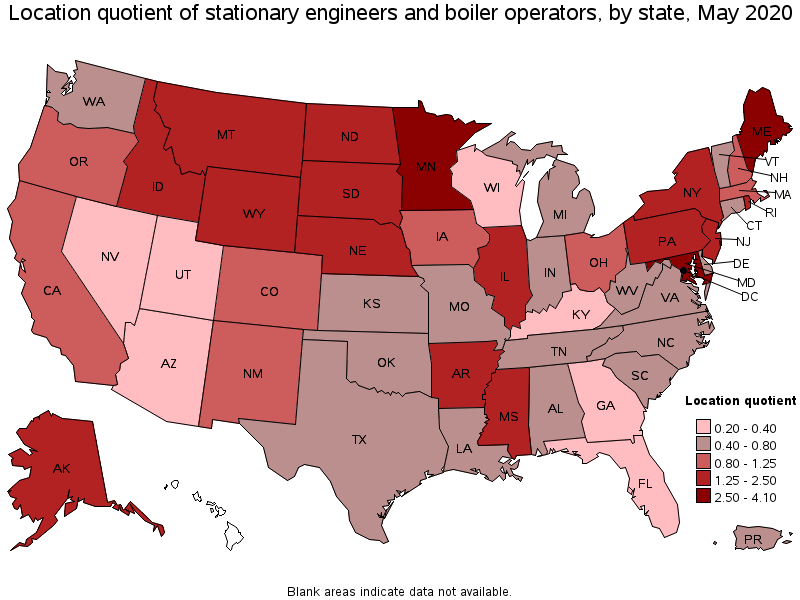
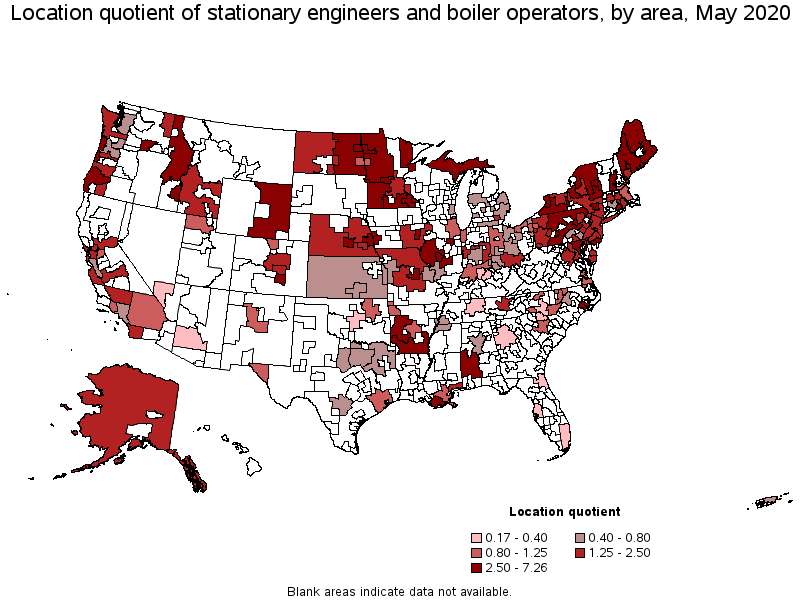
States with the highest concentration of jobs and location quotients in Stationary Engineers and Boiler Operators:
| State | Employment (1) | Employment per thousand jobs | Location quotient (9) | Hourly mean wage | Annual mean wage (2) |
|---|---|---|---|---|---|
| District of Columbia | 600 | 0.87 | 4.10 | $ 37.50 | $ 77,990 |
| Maryland | 1,490 | 0.59 | 2.79 | $ 32.48 | $ 67,550 |
| Minnesota | 1,490 | 0.55 | 2.59 | $ 30.50 | $ 63,440 |
| Maine | 320 | 0.55 | 2.59 | $ 24.76 | $ 51,490 |
| Nebraska | 470 | 0.50 | 2.36 | $ 24.60 | $ 51,180 |
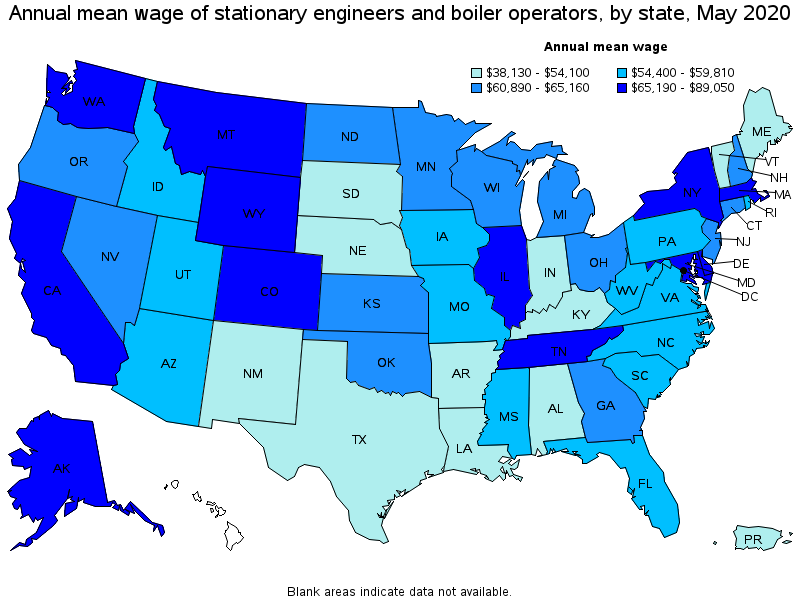
Top paying states for Stationary Engineers and Boiler Operators:
| State | Employment (1) | Employment per thousand jobs | Location quotient (9) | Hourly mean wage | Annual mean wage (2) |
|---|---|---|---|---|---|
| Illinois | 1,580 | 0.28 | 1.32 | $ 42.82 | $ 89,050 |
| California | 3,480 | 0.21 | 1.00 | $ 41.84 | $ 87,030 |
| New York | 4,120 | 0.47 | 2.23 | $ 39.88 | $ 82,940 |
| District of Columbia | 600 | 0.87 | 4.10 | $ 37.50 | $ 77,990 |
| Wyoming | 100 | 0.38 | 1.78 | $ 36.89 | $ 76,740 |
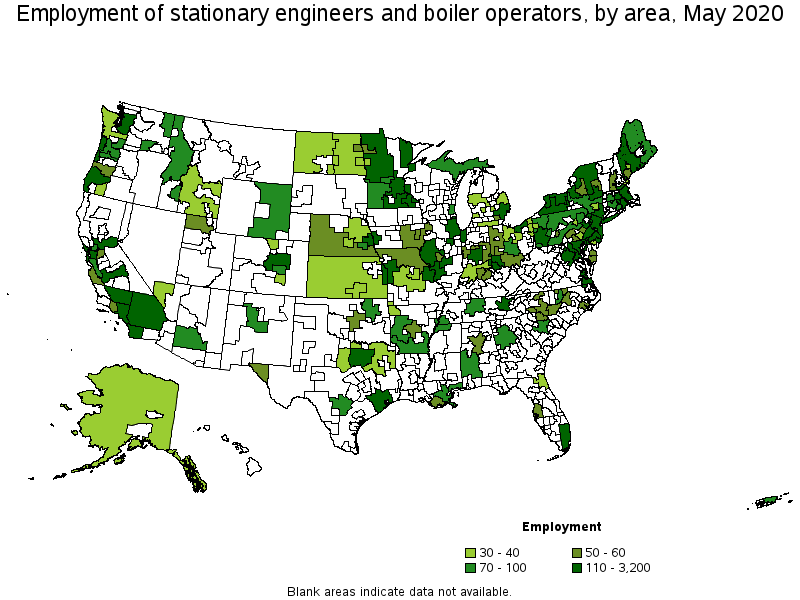
Metropolitan areas with the highest employment level in Stationary Engineers and Boiler Operators:
| Metropolitan area | Employment (1) | Employment per thousand jobs | Location quotient (9) | Hourly mean wage | Annual mean wage (2) |
|---|---|---|---|---|---|
| New York-Newark-Jersey City, NY-NJ-PA | 3,200 | 0.36 | 1.70 | $ 43.69 | $ 90,880 |
| Washington-Arlington-Alexandria, DC-VA-MD-WV | 1,400 | 0.46 | 2.18 | $ 35.24 | $ 73,300 |
| Chicago-Naperville-Elgin, IL-IN-WI | 1,020 | 0.23 | 1.10 | $ 43.54 | $ 90,560 |
| Philadelphia-Camden-Wilmington, PA-NJ-DE-MD | 920 | 0.34 | 1.60 | $ 31.32 | $ 65,140 |
| Los Angeles-Long Beach-Anaheim, CA | 830 | 0.14 | 0.67 | $ 36.41 | $ 75,730 |
| Minneapolis-St. Paul-Bloomington, MN-WI | 760 | 0.41 | 1.95 | $ 31.88 | $ 66,320 |
| San Francisco-Oakland-Hayward, CA | 760 | 0.33 | 1.53 | $ 50.46 | $ 104,970 |
| Baltimore-Columbia-Towson, MD | 740 | 0.58 | 2.72 | $ 31.71 | $ 65,960 |
| Houston-The Woodlands-Sugar Land, TX | 610 | 0.20 | 0.96 | $ 20.69 | $ 43,040 |
| Boston-Cambridge-Nashua, MA-NH | 440 | 0.17 | 0.80 | $ 35.98 | $ 74,840 |
Metropolitan areas with the highest concentration of jobs and location quotients in Stationary Engineers and Boiler Operators:
| Metropolitan area | Employment (1) | Employment per thousand jobs | Location quotient (9) | Hourly mean wage | Annual mean wage (2) |
|---|---|---|---|---|---|
| New Bern, NC | 50 | 1.31 | 6.15 | $ 30.89 | $ 64,240 |
| Atlantic City-Hammonton, NJ | 130 | 1.14 | 5.36 | $ 27.41 | $ 57,020 |
| Grand Island, NE | 40 | 1.09 | 5.12 | $ 21.36 | $ 44,430 |
| Bloomsburg-Berwick, PA | 40 | 1.04 | 4.92 | $ 22.52 | $ 46,850 |
| Glens Falls, NY | 50 | 1.03 | 4.84 | (8) | (8) |
| Rochester, MN | 120 | 1.01 | 4.77 | $ 30.49 | $ 63,410 |
| Grand Forks, ND-MN | 50 | 0.97 | 4.57 | $ 27.11 | $ 56,400 |
| Albany-Schenectady-Troy, NY | 380 | 0.90 | 4.25 | $ 28.10 | $ 58,460 |
| Altoona, PA | 50 | 0.90 | 4.24 | $ 24.67 | $ 51,310 |
| Duluth, MN-WI | 110 | 0.89 | 4.18 | $ 28.95 | $ 60,220 |
Top paying metropolitan areas for Stationary Engineers and Boiler Operators:
| Metropolitan area | Employment (1) | Employment per thousand jobs | Location quotient (9) | Hourly mean wage | Annual mean wage (2) |
|---|---|---|---|---|---|
| San Jose-Sunnyvale-Santa Clara, CA | 100 | 0.09 | 0.43 | $ 51.40 | $ 106,910 |
| San Francisco-Oakland-Hayward, CA | 760 | 0.33 | 1.53 | $ 50.46 | $ 104,970 |
| Springfield, IL | 60 | 0.61 | 2.87 | $ 49.36 | $ 102,660 |
| Vallejo-Fairfield, CA | 70 | 0.50 | 2.35 | $ 46.06 | $ 95,800 |
| Kankakee, IL | (8) | (8) | (8) | $ 46.04 | $ 95,760 |
| Sacramento--Roseville--Arden-Arcade, CA | 360 | 0.38 | 1.77 | $ 45.98 | $ 95,630 |
| New York-Newark-Jersey City, NY-NJ-PA | 3,200 | 0.36 | 1.70 | $ 43.69 | $ 90,880 |
| Chicago-Naperville-Elgin, IL-IN-WI | 1,020 | 0.23 | 1.10 | $ 43.54 | $ 90,560 |
| Fresno, CA | 120 | 0.31 | 1.47 | $ 41.33 | $ 85,960 |
| Salinas, CA | 50 | 0.29 | 1.37 | $ 41.27 | $ 85,840 |
Nonmetropolitan areas with the highest employment in Stationary Engineers and Boiler Operators:
| Nonmetropolitan area | Employment (1) | Employment per thousand jobs | Location quotient (9) | Hourly mean wage | Annual mean wage (2) |
|---|---|---|---|---|---|
| West Central Illinois nonmetropolitan area | 160 | 0.96 | 4.52 | $ 39.64 | $ 82,450 |
| Southwest New York nonmetropolitan area | 140 | 0.82 | 3.85 | $ 26.84 | $ 55,820 |
| Capital/Northern New York nonmetropolitan area | 130 | 1.00 | 4.70 | $ 27.59 | $ 57,380 |
| Northwest Minnesota nonmetropolitan area | 120 | 0.66 | 3.13 | $ 28.39 | $ 59,060 |
| Coast Oregon nonmetropolitan area | 110 | 1.03 | 4.87 | $ 27.56 | $ 57,320 |
Nonmetropolitan areas with the highest concentration of jobs and location quotients in Stationary Engineers and Boiler Operators:
| Nonmetropolitan area | Employment (1) | Employment per thousand jobs | Location quotient (9) | Hourly mean wage | Annual mean wage (2) |
|---|---|---|---|---|---|
| Northwestern Idaho nonmetropolitan area | 100 | 1.54 | 7.26 | $ 21.79 | $ 45,330 |
| Southwest Alabama nonmetropolitan area | 90 | 1.38 | 6.49 | $ 16.07 | $ 33,420 |
| Northeast Maine nonmetropolitan area | 80 | 1.14 | 5.36 | $ 25.58 | $ 53,210 |
| South Arkansas nonmetropolitan area | 100 | 1.09 | 5.14 | $ 20.38 | $ 42,380 |
| Coast Oregon nonmetropolitan area | 110 | 1.03 | 4.87 | $ 27.56 | $ 57,320 |
Top paying nonmetropolitan areas for Stationary Engineers and Boiler Operators:
| Nonmetropolitan area | Employment (1) | Employment per thousand jobs | Location quotient (9) | Hourly mean wage | Annual mean wage (2) |
|---|---|---|---|---|---|
| West North Dakota nonmetropolitan area | 40 | 0.34 | 1.60 | $ 42.77 | $ 88,960 |
| Northwest Colorado nonmetropolitan area | (8) | (8) | (8) | $ 41.23 | $ 85,750 |
| West Central Illinois nonmetropolitan area | 160 | 0.96 | 4.52 | $ 39.64 | $ 82,450 |
| Eastern Wyoming nonmetropolitan area | 80 | 0.95 | 4.49 | $ 35.96 | $ 74,800 |
| Alaska nonmetropolitan area | 40 | 0.38 | 1.77 | $ 34.85 | $ 72,490 |
These estimates are calculated with data collected from employers in all industry sectors, all metropolitan and nonmetropolitan areas, and all states and the District of Columbia. The top employment and wage figures are provided above. The complete list is available in the downloadable XLS files.
The percentile wage estimate is the value of a wage below which a certain percent of workers fall. The median wage is the 50th percentile wage estimate—50 percent of workers earn less than the median and 50 percent of workers earn more than the median. More about percentile wages.
(1) Estimates for detailed occupations do not sum to the totals because the totals include occupations not shown separately. Estimates do not include self-employed workers.
(2) Annual wages have been calculated by multiplying the hourly mean wage by a "year-round, full-time" hours figure of 2,080 hours; for those occupations where there is not an hourly wage published, the annual wage has been directly calculated from the reported survey data.
(3) The relative standard error (RSE) is a measure of the reliability of a survey statistic. The smaller the relative standard error, the more precise the estimate.
(8) Estimate not released.
(9) The location quotient is the ratio of the area concentration of occupational employment to the national average concentration. A location quotient greater than one indicates the occupation has a higher share of employment than average, and a location quotient less than one indicates the occupation is less prevalent in the area than average.
Other OEWS estimates and related information:
May 2020 National Occupational Employment and Wage Estimates
May 2020 State Occupational Employment and Wage Estimates
May 2020 Metropolitan and Nonmetropolitan Area Occupational Employment and Wage Estimates
May 2020 National Industry-Specific Occupational Employment and Wage Estimates
Last Modified Date: March 31, 2021