An official website of the United States government
 United States Department of Labor
This occupation includes the 2018 SOC occupations 11-3012 Administrative Services Managers and 11-3013 Facilities Managers and the 2010 SOC occupation 11-3011 Administrative Services Managers.
Employment estimate and mean wage estimates for Administrative Services and Facilities Managers:
| Employment (1) | Employment RSE (3) |
Mean hourly wage |
Mean annual wage (2) |
Wage RSE (3) |
|---|---|---|---|---|
| 307,620 | 0.6 % | $ 51.98 | $ 108,120 | 0.3 % |
Percentile wage estimates for Administrative Services and Facilities Managers:
| Percentile | 10% | 25% | 50% (Median) |
75% | 90% |
|---|---|---|---|---|---|
| Hourly Wage | $ 26.96 | $ 35.41 | $ 47.54 | $ 62.95 | $ 81.70 |
| Annual Wage (2) | $ 56,080 | $ 73,650 | $ 98,890 | $ 130,930 | $ 169,930 |
Industries with the highest published employment and wages for Administrative Services and Facilities Managers are provided. For a list of all industries with employment in Administrative Services and Facilities Managers, see the Create Customized Tables function.
Industries with the highest levels of employment in Administrative Services and Facilities Managers:
| Industry | Employment (1) | Percent of industry employment | Hourly mean wage | Annual mean wage (2) |
|---|---|---|---|---|
| Local Government, excluding schools and hospitals (OEWS Designation) | 26,350 | 0.49 | $ 47.79 | $ 99,400 |
| Management of Companies and Enterprises | 20,480 | 0.85 | $ 59.49 | $ 123,730 |
| Colleges, Universities, and Professional Schools | 19,900 | 0.66 | $ 49.39 | $ 102,730 |
| General Medical and Surgical Hospitals | 15,030 | 0.27 | $ 53.53 | $ 111,350 |
| State Government, excluding schools and hospitals (OEWS Designation) | 12,810 | 0.58 | $ 46.06 | $ 95,800 |
Industries with the highest concentration of employment in Administrative Services and Facilities Managers:
| Industry | Employment (1) | Percent of industry employment | Hourly mean wage | Annual mean wage (2) |
|---|---|---|---|---|
| Other Pipeline Transportation | 100 | 1.24 | $ 51.24 | $ 106,580 |
| Office Administrative Services | 4,980 | 1.00 | $ 52.74 | $ 109,690 |
| Monetary Authorities-Central Bank | 190 | 0.99 | (8) | (8) |
| Cable and Other Subscription Programming | 490 | 0.98 | $ 55.22 | $ 114,850 |
| Management of Companies and Enterprises | 20,480 | 0.85 | $ 59.49 | $ 123,730 |
Top paying industries for Administrative Services and Facilities Managers:
| Industry | Employment (1) | Percent of industry employment | Hourly mean wage | Annual mean wage (2) |
|---|---|---|---|---|
| Inland Water Transportation | 90 | 0.38 | $ 75.85 | $ 157,770 |
| Textile Furnishings Mills | 40 | 0.08 | $ 71.10 | $ 147,900 |
| Other Investment Pools and Funds | 40 | 0.42 | $ 67.64 | $ 140,700 |
| Securities, Commodity Contracts, and Other Financial Investments and Related Activities | 3,280 | 0.35 | $ 66.08 | $ 137,460 |
| Natural Gas Distribution | 530 | 0.49 | $ 65.38 | $ 135,990 |
States and areas with the highest published employment, location quotients, and wages for Administrative Services and Facilities Managers are provided. For a list of all areas with employment in Administrative Services and Facilities Managers, see the Create Customized Tables function.
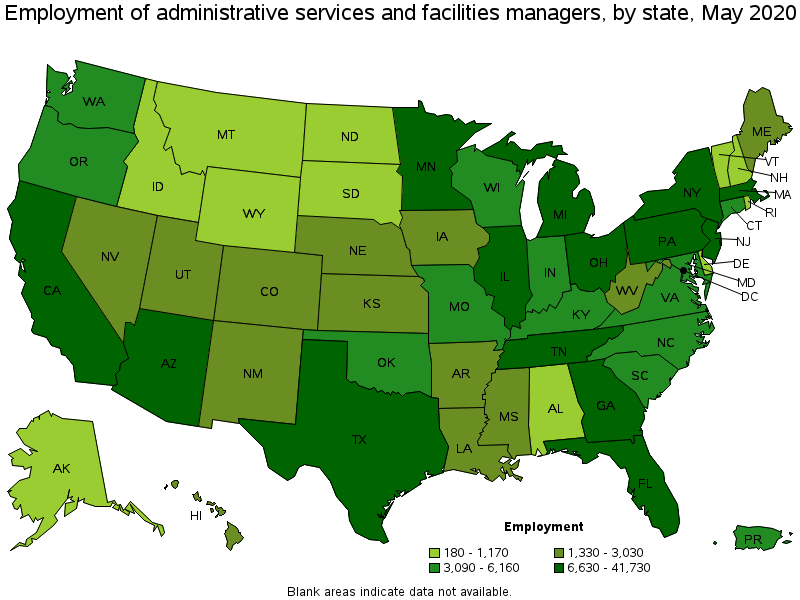
States with the highest employment level in Administrative Services and Facilities Managers:
| State | Employment (1) | Employment per thousand jobs | Location quotient (9) | Hourly mean wage | Annual mean wage (2) |
|---|---|---|---|---|---|
| California | 41,730 | 2.54 | 1.15 | $ 55.75 | $ 115,960 |
| Texas | 29,520 | 2.44 | 1.10 | $ 48.37 | $ 100,610 |
| Illinois | 18,790 | 3.34 | 1.51 | $ 49.24 | $ 102,430 |
| New York | 17,670 | 2.03 | 0.92 | $ 69.12 | $ 143,760 |
| Florida | 15,670 | 1.86 | 0.84 | $ 45.03 | $ 93,660 |
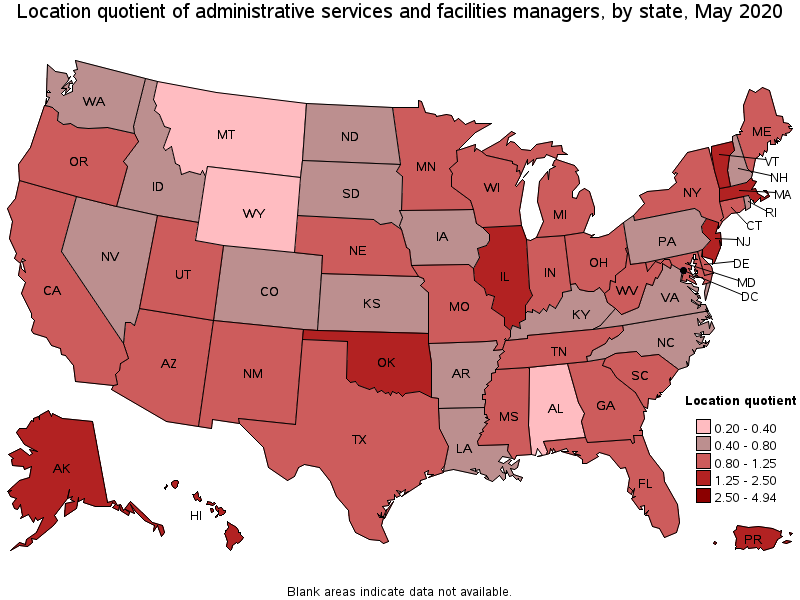
States with the highest concentration of jobs and location quotients in Administrative Services and Facilities Managers:
| State | Employment (1) | Employment per thousand jobs | Location quotient (9) | Hourly mean wage | Annual mean wage (2) |
|---|---|---|---|---|---|
| Oklahoma | 6,160 | 3.94 | 1.78 | $ 47.09 | $ 97,950 |
| Alaska | 1,160 | 3.90 | 1.76 | $ 47.51 | $ 98,830 |
| New Jersey | 13,900 | 3.68 | 1.66 | $ 65.46 | $ 136,150 |
| Vermont | 1,020 | 3.63 | 1.64 | $ 37.44 | $ 77,880 |
| Massachusetts | 11,800 | 3.52 | 1.59 | $ 55.11 | $ 114,620 |
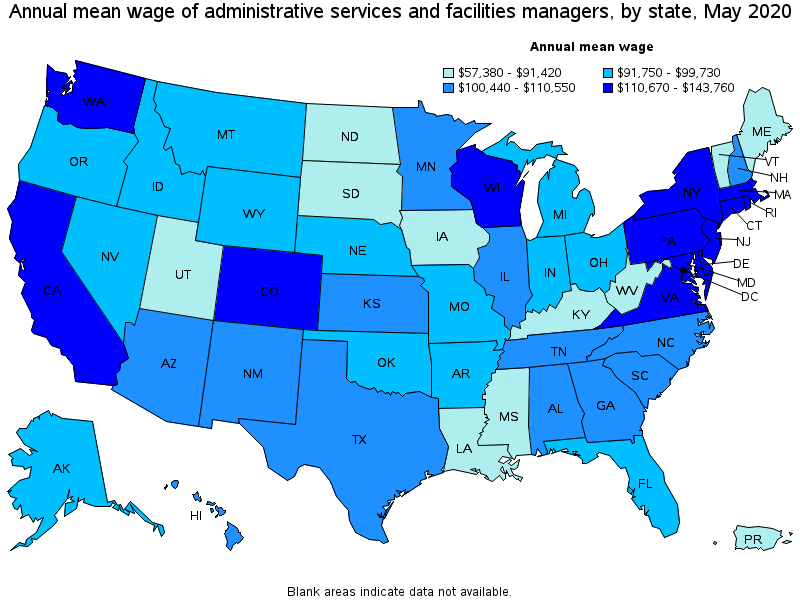
Top paying states for Administrative Services and Facilities Managers:
| State | Employment (1) | Employment per thousand jobs | Location quotient (9) | Hourly mean wage | Annual mean wage (2) |
|---|---|---|---|---|---|
| New York | 17,670 | 2.03 | 0.92 | $ 69.12 | $ 143,760 |
| New Jersey | 13,900 | 3.68 | 1.66 | $ 65.46 | $ 136,150 |
| Rhode Island | 520 | 1.17 | 0.53 | $ 63.52 | $ 132,120 |
| Delaware | 770 | 1.82 | 0.82 | $ 63.03 | $ 131,100 |
| District of Columbia | 1,330 | 1.94 | 0.88 | $ 59.54 | $ 123,850 |
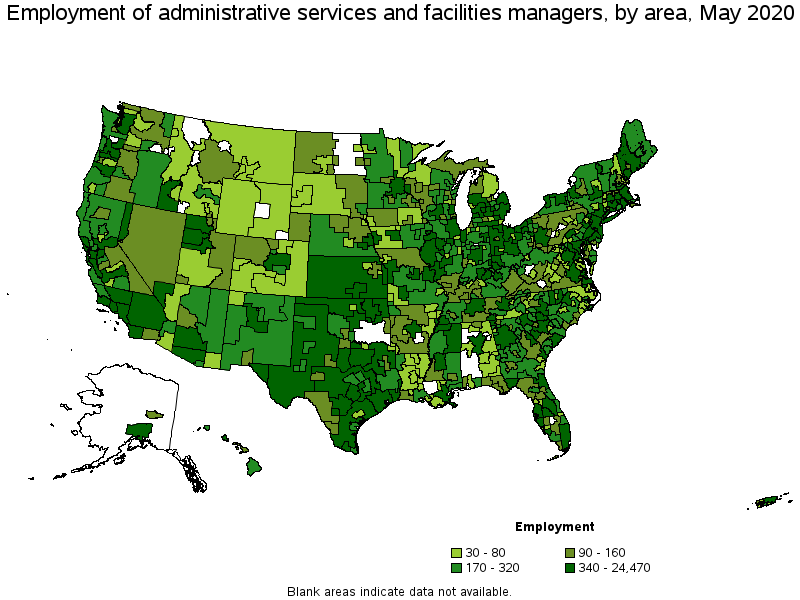
Metropolitan areas with the highest employment level in Administrative Services and Facilities Managers:
| Metropolitan area | Employment (1) | Employment per thousand jobs | Location quotient (9) | Hourly mean wage | Annual mean wage (2) |
|---|---|---|---|---|---|
| New York-Newark-Jersey City, NY-NJ-PA | 24,470 | 2.77 | 1.25 | $ 70.42 | $ 146,480 |
| Los Angeles-Long Beach-Anaheim, CA | 16,130 | 2.77 | 1.25 | $ 54.73 | $ 113,850 |
| Chicago-Naperville-Elgin, IL-IN-WI | 15,490 | 3.55 | 1.61 | $ 50.59 | $ 105,220 |
| Boston-Cambridge-Nashua, MA-NH | 9,780 | 3.76 | 1.70 | $ 56.44 | $ 117,390 |
| Dallas-Fort Worth-Arlington, TX | 9,190 | 2.56 | 1.16 | $ 50.71 | $ 105,480 |
| Atlanta-Sandy Springs-Roswell, GA | 8,040 | 3.05 | 1.38 | $ 56.35 | $ 117,210 |
| Houston-The Woodlands-Sugar Land, TX | 7,340 | 2.47 | 1.12 | $ 49.23 | $ 102,390 |
| San Francisco-Oakland-Hayward, CA | 7,010 | 3.01 | 1.36 | $ 62.92 | $ 130,880 |
| Phoenix-Mesa-Scottsdale, AZ | 6,140 | 2.91 | 1.32 | $ 49.53 | $ 103,020 |
| Miami-Fort Lauderdale-West Palm Beach, FL | 5,650 | 2.25 | 1.02 | $ 43.77 | $ 91,040 |
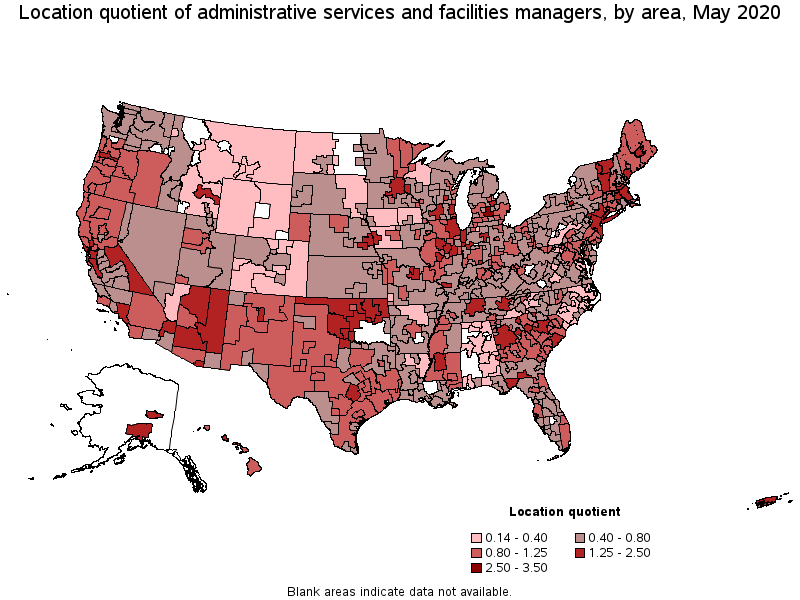
Metropolitan areas with the highest concentration of jobs and location quotients in Administrative Services and Facilities Managers:
| Metropolitan area | Employment (1) | Employment per thousand jobs | Location quotient (9) | Hourly mean wage | Annual mean wage (2) |
|---|---|---|---|---|---|
| Lansing-East Lansing, MI | 1,130 | 5.72 | 2.59 | $ 50.03 | $ 104,070 |
| Jefferson City, MO | 380 | 5.29 | 2.39 | (8) | (8) |
| Trenton, NJ | 1,100 | 4.77 | 2.15 | $ 63.50 | $ 132,090 |
| Salem, OR | 710 | 4.27 | 1.93 | $ 47.62 | $ 99,040 |
| Valdosta, GA | 220 | 4.26 | 1.93 | $ 43.85 | $ 91,200 |
| Oklahoma City, OK | 2,500 | 4.09 | 1.85 | $ 46.98 | $ 97,720 |
| Tulsa, OK | 1,740 | 4.06 | 1.84 | $ 52.00 | $ 108,170 |
| Carson City, NV | 120 | 4.03 | 1.82 | $ 48.89 | $ 101,690 |
| Columbus, IN | 180 | 3.94 | 1.78 | $ 52.01 | $ 108,170 |
| Austin-Round Rock, TX | 4,110 | 3.90 | 1.76 | $ 52.82 | $ 109,870 |
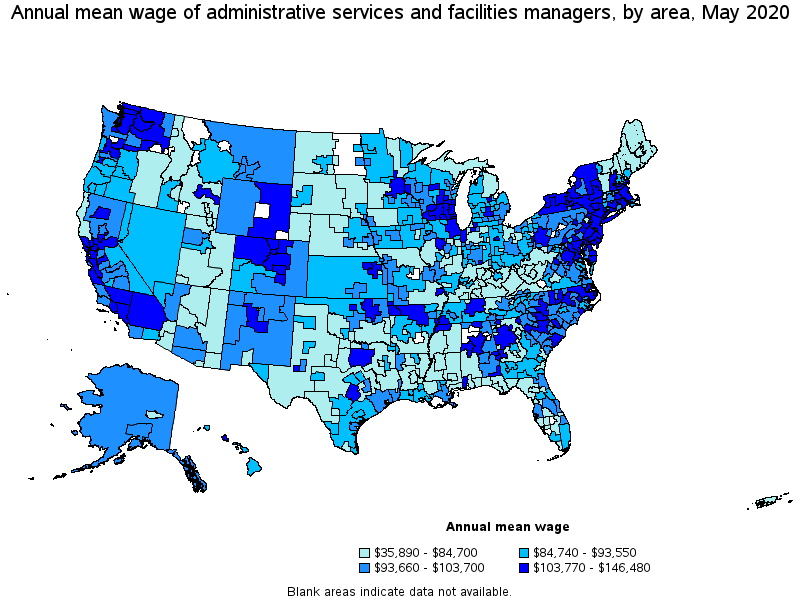
Top paying metropolitan areas for Administrative Services and Facilities Managers:
| Metropolitan area | Employment (1) | Employment per thousand jobs | Location quotient (9) | Hourly mean wage | Annual mean wage (2) |
|---|---|---|---|---|---|
| New York-Newark-Jersey City, NY-NJ-PA | 24,470 | 2.77 | 1.25 | $ 70.42 | $ 146,480 |
| Kennewick-Richland, WA | 200 | 1.72 | 0.78 | $ 69.39 | $ 144,340 |
| San Jose-Sunnyvale-Santa Clara, CA | 3,620 | 3.28 | 1.48 | $ 68.51 | $ 142,500 |
| Bloomsburg-Berwick, PA | 50 | 1.18 | 0.54 | $ 67.57 | $ 140,540 |
| Idaho Falls, ID | 260 | 3.82 | 1.73 | $ 66.95 | $ 139,260 |
| Bridgeport-Stamford-Norwalk, CT | 1,220 | 3.24 | 1.47 | $ 66.61 | $ 138,540 |
| Ithaca, NY | 130 | 2.83 | 1.28 | $ 64.99 | $ 135,190 |
| Dothan, AL | 40 | 0.69 | 0.31 | $ 64.43 | $ 134,010 |
| Dalton, GA | 110 | 1.89 | 0.85 | $ 64.36 | $ 133,860 |
| Trenton, NJ | 1,100 | 4.77 | 2.15 | $ 63.50 | $ 132,090 |
Nonmetropolitan areas with the highest employment in Administrative Services and Facilities Managers:
| Nonmetropolitan area | Employment (1) | Employment per thousand jobs | Location quotient (9) | Hourly mean wage | Annual mean wage (2) |
|---|---|---|---|---|---|
| North Northeastern Ohio nonmetropolitan area (noncontiguous) | 490 | 1.56 | 0.70 | $ 35.51 | $ 73,870 |
| Hill Country Region of Texas nonmetropolitan area | 480 | 2.50 | 1.13 | $ 39.19 | $ 81,510 |
| Southwest Maine nonmetropolitan area | 440 | 2.39 | 1.08 | $ 36.36 | $ 75,630 |
| North Texas Region of Texas nonmetropolitan area | 440 | 1.62 | 0.73 | $ 39.44 | $ 82,030 |
| Kansas nonmetropolitan area | 430 | 1.15 | 0.52 | $ 41.25 | $ 85,810 |
Nonmetropolitan areas with the highest concentration of jobs and location quotients in Administrative Services and Facilities Managers:
| Nonmetropolitan area | Employment (1) | Employment per thousand jobs | Location quotient (9) | Hourly mean wage | Annual mean wage (2) |
|---|---|---|---|---|---|
| Northern Vermont nonmetropolitan area | 310 | 4.80 | 2.17 | $ 34.05 | $ 70,810 |
| Northwest Oklahoma nonmetropolitan area | 390 | 4.28 | 1.93 | $ 41.15 | $ 85,590 |
| Northeast Oklahoma nonmetropolitan area | 420 | 3.69 | 1.67 | $ 48.61 | $ 101,120 |
| Southwest Oklahoma nonmetropolitan area | 220 | 3.60 | 1.63 | $ 38.73 | $ 80,560 |
| Southern Vermont nonmetropolitan area | 320 | 3.26 | 1.47 | $ 36.66 | $ 76,250 |
Top paying nonmetropolitan areas for Administrative Services and Facilities Managers:
| Nonmetropolitan area | Employment (1) | Employment per thousand jobs | Location quotient (9) | Hourly mean wage | Annual mean wage (2) |
|---|---|---|---|---|---|
| West Central-Southwest New Hampshire nonmetropolitan area | 180 | 1.82 | 0.82 | $ 54.39 | $ 113,130 |
| Northeast Coastal North Carolina nonmetropolitan area | 70 | 0.81 | 0.37 | $ 52.97 | $ 110,170 |
| Southwest New York nonmetropolitan area | 180 | 1.09 | 0.49 | $ 52.71 | $ 109,640 |
| South Central Wisconsin nonmetropolitan area | 230 | 1.20 | 0.54 | $ 52.08 | $ 108,320 |
| Eastern Washington nonmetropolitan area | 140 | 1.53 | 0.69 | $ 51.81 | $ 107,770 |
These estimates are calculated with data collected from employers in all industry sectors, all metropolitan and nonmetropolitan areas, and all states and the District of Columbia. The top employment and wage figures are provided above. The complete list is available in the downloadable XLS files.
The percentile wage estimate is the value of a wage below which a certain percent of workers fall. The median wage is the 50th percentile wage estimate—50 percent of workers earn less than the median and 50 percent of workers earn more than the median. More about percentile wages.
(1) Estimates for detailed occupations do not sum to the totals because the totals include occupations not shown separately. Estimates do not include self-employed workers.
(2) Annual wages have been calculated by multiplying the hourly mean wage by a "year-round, full-time" hours figure of 2,080 hours; for those occupations where there is not an hourly wage published, the annual wage has been directly calculated from the reported survey data.
(3) The relative standard error (RSE) is a measure of the reliability of a survey statistic. The smaller the relative standard error, the more precise the estimate.
(8) Estimate not released.
(9) The location quotient is the ratio of the area concentration of occupational employment to the national average concentration. A location quotient greater than one indicates the occupation has a higher share of employment than average, and a location quotient less than one indicates the occupation is less prevalent in the area than average.
Other OEWS estimates and related information:
May 2020 National Occupational Employment and Wage Estimates
May 2020 State Occupational Employment and Wage Estimates
May 2020 Metropolitan and Nonmetropolitan Area Occupational Employment and Wage Estimates
May 2020 National Industry-Specific Occupational Employment and Wage Estimates
Last Modified Date: March 31, 2021