
An official website of the United States government
An official website of the United States government
The .gov means it's official.
Federal government websites often end in .gov or .mil. Before sharing sensitive information,
make sure you're on a federal government site.
The site is secure.
The
https:// ensures that you are connecting to the official website and that any
information you provide is encrypted and transmitted securely.
Plan, direct, or coordinate the management or operation of farms, ranches, greenhouses, aquacultural operations, nurseries, timber tracts, or other agricultural establishments. May hire, train, and supervise farm workers or contract for services to carry out the day-to-day activities of the managed operation. May engage in or supervise planting, cultivating, harvesting, and financial and marketing activities. Excludes "First-Line Supervisors of Farming, Fishing, and Forestry Workers" (45-1011).
Employment estimate and mean wage estimates for Farmers, Ranchers, and Other Agricultural Managers:
| Employment (1) | Employment RSE (3) |
Mean hourly wage |
Mean annual wage (2) |
Wage RSE (3) |
|---|---|---|---|---|
| 5,670 | 13.5 % | $ 36.93 | $ 76,810 | 6.2 % |
Percentile wage estimates for Farmers, Ranchers, and Other Agricultural Managers:
| Percentile | 10% | 25% | 50% (Median) |
75% | 90% |
|---|---|---|---|---|---|
| Hourly Wage | $ 16.87 | $ 20.60 | $ 32.73 | $ 46.63 | $ 62.86 |
| Annual Wage (2) | $ 35,090 | $ 42,850 | $ 68,090 | $ 96,980 | $ 130,760 |
Industries with the highest published employment and wages for Farmers, Ranchers, and Other Agricultural Managers are provided. For a list of all industries with employment in Farmers, Ranchers, and Other Agricultural Managers, see the Create Customized Tables function.
Industries with the highest levels of employment in Farmers, Ranchers, and Other Agricultural Managers:
| Industry | Employment (1) | Percent of industry employment | Hourly mean wage | Annual mean wage (2) |
|---|---|---|---|---|
| Support Activities for Crop Production | 2,540 | 0.73 | $ 34.50 | $ 71,750 |
| State Government, excluding schools and hospitals (OEWS Designation) | 350 | 0.02 | $ 35.28 | $ 73,380 |
| Support Activities for Animal Production | 340 | 1.06 | $ 43.57 | $ 90,630 |
| Colleges, Universities, and Professional Schools | 270 | 0.01 | $ 32.75 | $ 68,110 |
| Merchant Wholesalers, Nondurable Goods (4241, 4247, and 4249 only) | 230 | 0.04 | $ 39.20 | $ 81,530 |
Industries with the highest concentration of employment in Farmers, Ranchers, and Other Agricultural Managers:
| Industry | Employment (1) | Percent of industry employment | Hourly mean wage | Annual mean wage (2) |
|---|---|---|---|---|
| Support Activities for Animal Production | 340 | 1.06 | $ 43.57 | $ 90,630 |
| Support Activities for Crop Production | 2,540 | 0.73 | $ 34.50 | $ 71,750 |
| Farm Product Raw Material Merchant Wholesalers | 100 | 0.15 | $ 39.06 | $ 81,250 |
| Museums, Historical Sites, and Similar Institutions | 80 | 0.05 | $ 32.53 | $ 67,660 |
| Merchant Wholesalers, Nondurable Goods (4241, 4247, and 4249 only) | 230 | 0.04 | $ 39.20 | $ 81,530 |
Top paying industries for Farmers, Ranchers, and Other Agricultural Managers:
| Industry | Employment (1) | Percent of industry employment | Hourly mean wage | Annual mean wage (2) |
|---|---|---|---|---|
| Merchant Wholesalers, Durable Goods (4232, 4233, 4235, 4236, 4237, and 4239 only) | 70 | 0.01 | $ 55.94 | $ 116,360 |
| Beverage Manufacturing | 90 | 0.03 | $ 54.52 | $ 113,400 |
| Fruit and Vegetable Preserving and Specialty Food Manufacturing | 50 | 0.03 | $ 48.95 | $ 101,820 |
| Management of Companies and Enterprises | 220 | 0.01 | $ 46.50 | $ 96,710 |
| Scientific Research and Development Services | 130 | 0.02 | $ 44.53 | $ 92,610 |
States and areas with the highest published employment, location quotients, and wages for Farmers, Ranchers, and Other Agricultural Managers are provided. For a list of all areas with employment in Farmers, Ranchers, and Other Agricultural Managers, see the Create Customized Tables function.
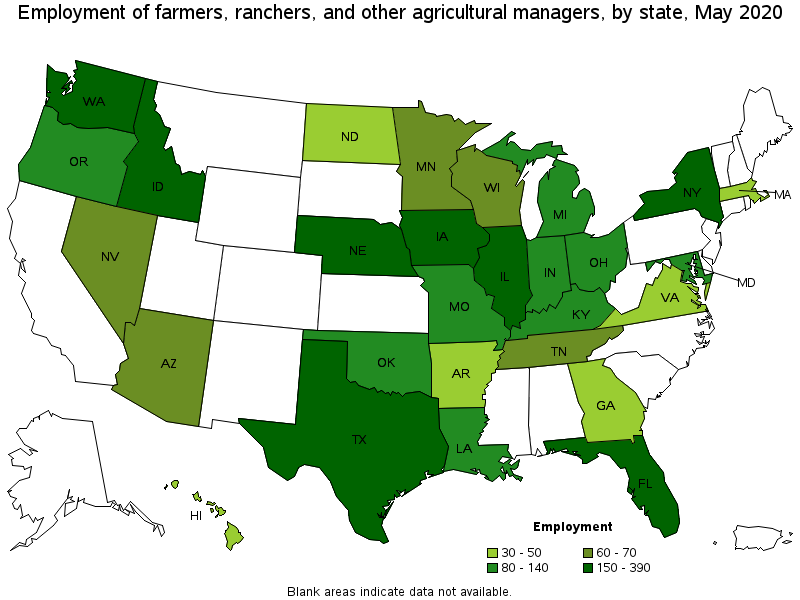
States with the highest employment level in Farmers, Ranchers, and Other Agricultural Managers:
| State | Employment (1) | Employment per thousand jobs | Location quotient (9) | Hourly mean wage | Annual mean wage (2) |
|---|---|---|---|---|---|
| Texas | 390 | 0.03 | 0.78 | $ 41.29 | $ 85,880 |
| Illinois | 270 | 0.05 | 1.17 | $ 38.05 | $ 79,140 |
| Idaho | 270 | 0.37 | 9.14 | $ 31.12 | $ 64,730 |
| Iowa | 210 | 0.14 | 3.51 | $ 45.97 | $ 95,610 |
| Nebraska | 210 | 0.22 | 5.34 | $ 32.86 | $ 68,350 |
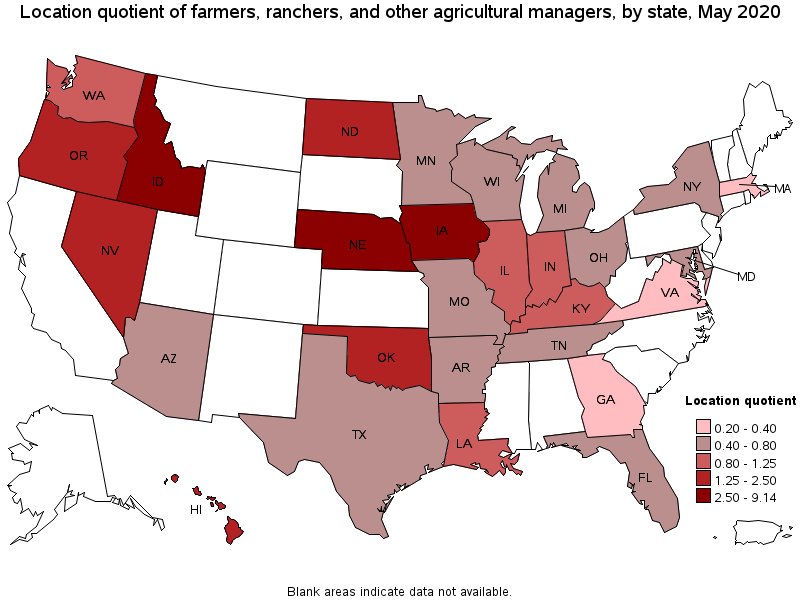
States with the highest concentration of jobs and location quotients in Farmers, Ranchers, and Other Agricultural Managers:
| State | Employment (1) | Employment per thousand jobs | Location quotient (9) | Hourly mean wage | Annual mean wage (2) |
|---|---|---|---|---|---|
| Idaho | 270 | 0.37 | 9.14 | $ 31.12 | $ 64,730 |
| Nebraska | 210 | 0.22 | 5.34 | $ 32.86 | $ 68,350 |
| Iowa | 210 | 0.14 | 3.51 | $ 45.97 | $ 95,610 |
| North Dakota | 40 | 0.10 | 2.45 | $ 47.05 | $ 97,870 |
| Oklahoma | 120 | 0.07 | 1.84 | $ 29.07 | $ 60,460 |
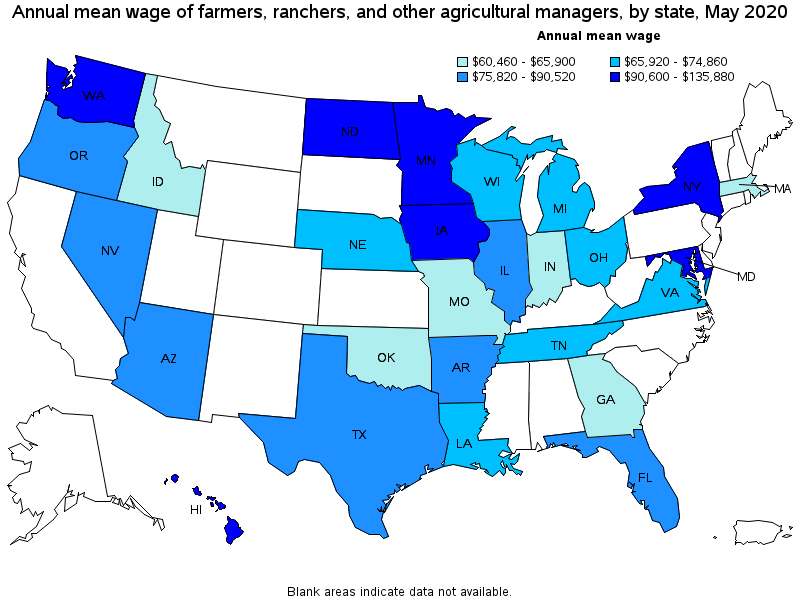
Top paying states for Farmers, Ranchers, and Other Agricultural Managers:
| State | Employment (1) | Employment per thousand jobs | Location quotient (9) | Hourly mean wage | Annual mean wage (2) |
|---|---|---|---|---|---|
| Hawaii | 40 | 0.07 | 1.76 | $ 65.33 | $ 135,880 |
| Minnesota | 60 | 0.02 | 0.50 | $ 48.02 | $ 99,890 |
| North Dakota | 40 | 0.10 | 2.45 | $ 47.05 | $ 97,870 |
| Iowa | 210 | 0.14 | 3.51 | $ 45.97 | $ 95,610 |
| New York | 150 | 0.02 | 0.41 | $ 45.07 | $ 93,740 |
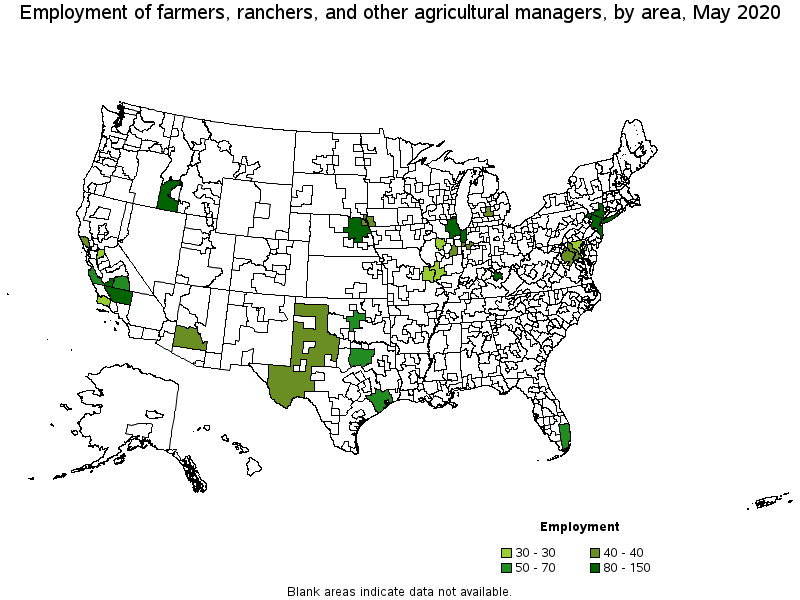
Metropolitan areas with the highest employment level in Farmers, Ranchers, and Other Agricultural Managers:
| Metropolitan area | Employment (1) | Employment per thousand jobs | Location quotient (9) | Hourly mean wage | Annual mean wage (2) |
|---|---|---|---|---|---|
| Chicago-Naperville-Elgin, IL-IN-WI | 150 | 0.03 | 0.85 | $ 36.96 | $ 76,880 |
| Boise City, ID | 130 | 0.38 | 9.39 | $ 33.23 | $ 69,110 |
| Bakersfield, CA | 90 | 0.30 | 7.36 | $ 46.98 | $ 97,720 |
| New York-Newark-Jersey City, NY-NJ-PA | 90 | 0.01 | 0.25 | $ 50.66 | $ 105,370 |
| Hanford-Corcoran, CA | 80 | 1.99 | 48.72 | $ 45.11 | $ 93,820 |
| Lexington-Fayette, KY | 80 | 0.31 | 7.55 | $ 52.58 | $ 109,360 |
| Salinas, CA | 70 | 0.41 | 10.06 | $ 52.01 | $ 108,180 |
| Dallas-Fort Worth-Arlington, TX | 60 | 0.02 | 0.40 | $ 33.43 | $ 69,530 |
| Visalia-Porterville, CA | 60 | 0.39 | 9.56 | $ 48.46 | $ 100,810 |
| Houston-The Woodlands-Sugar Land, TX | 60 | 0.02 | 0.46 | (8) | (8) |
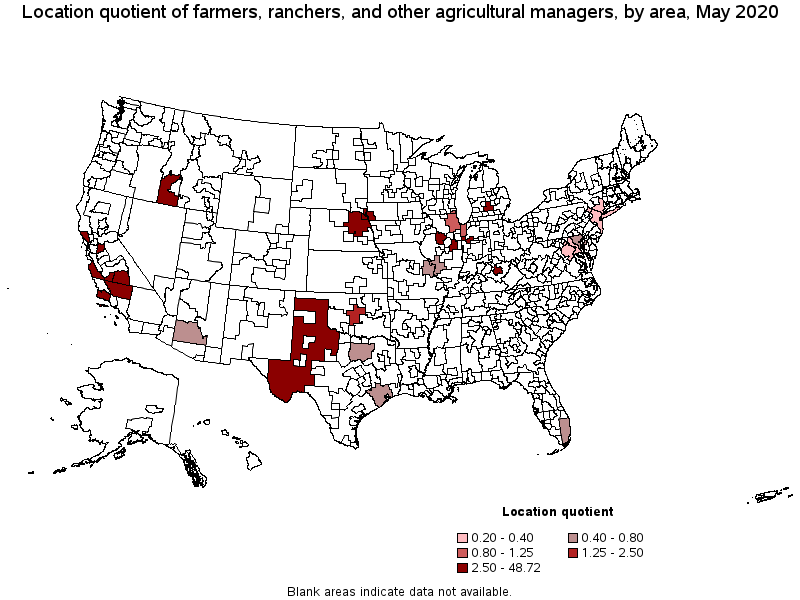
Metropolitan areas with the highest concentration of jobs and location quotients in Farmers, Ranchers, and Other Agricultural Managers:
| Metropolitan area | Employment (1) | Employment per thousand jobs | Location quotient (9) | Hourly mean wage | Annual mean wage (2) |
|---|---|---|---|---|---|
| Hanford-Corcoran, CA | 80 | 1.99 | 48.72 | $ 45.11 | $ 93,820 |
| Sioux City, IA-NE-SD | 40 | 0.48 | 11.81 | $ 54.80 | $ 113,990 |
| Lafayette-West Lafayette, IN | 40 | 0.43 | 10.53 | $ 36.27 | $ 75,450 |
| Salinas, CA | 70 | 0.41 | 10.06 | $ 52.01 | $ 108,180 |
| Champaign-Urbana, IL | 40 | 0.40 | 9.90 | $ 41.08 | $ 85,450 |
| Visalia-Porterville, CA | 60 | 0.39 | 9.56 | $ 48.46 | $ 100,810 |
| Boise City, ID | 130 | 0.38 | 9.39 | $ 33.23 | $ 69,110 |
| Lexington-Fayette, KY | 80 | 0.31 | 7.55 | $ 52.58 | $ 109,360 |
| Bakersfield, CA | 90 | 0.30 | 7.36 | $ 46.98 | $ 97,720 |
| Santa Rosa, CA | 40 | 0.21 | 5.10 | $ 49.67 | $ 103,300 |
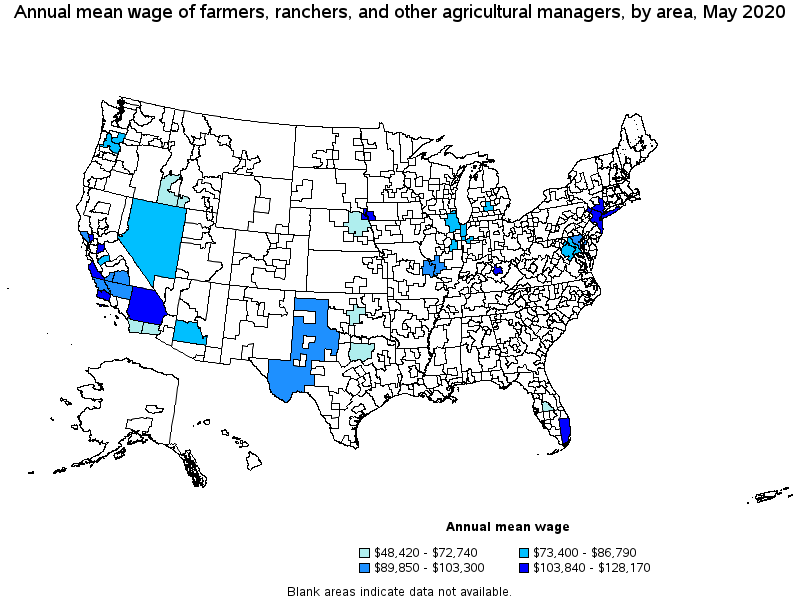
Top paying metropolitan areas for Farmers, Ranchers, and Other Agricultural Managers:
| Metropolitan area | Employment (1) | Employment per thousand jobs | Location quotient (9) | Hourly mean wage | Annual mean wage (2) |
|---|---|---|---|---|---|
| Miami-Fort Lauderdale-West Palm Beach, FL | 50 | 0.02 | 0.54 | $ 61.62 | $ 128,170 |
| Riverside-San Bernardino-Ontario, CA | (8) | (8) | (8) | $ 57.07 | $ 118,710 |
| Napa, CA | (8) | (8) | (8) | $ 56.13 | $ 116,750 |
| Santa Maria-Santa Barbara, CA | 30 | 0.19 | 4.69 | $ 55.36 | $ 115,150 |
| Sioux City, IA-NE-SD | 40 | 0.48 | 11.81 | $ 54.80 | $ 113,990 |
| Lexington-Fayette, KY | 80 | 0.31 | 7.55 | $ 52.58 | $ 109,360 |
| Salinas, CA | 70 | 0.41 | 10.06 | $ 52.01 | $ 108,180 |
| New York-Newark-Jersey City, NY-NJ-PA | 90 | 0.01 | 0.25 | $ 50.66 | $ 105,370 |
| Stockton-Lodi, CA | 30 | 0.13 | 3.28 | $ 49.92 | $ 103,840 |
| Santa Rosa, CA | 40 | 0.21 | 5.10 | $ 49.67 | $ 103,300 |
Nonmetropolitan areas with the highest employment in Farmers, Ranchers, and Other Agricultural Managers:
| Nonmetropolitan area | Employment (1) | Employment per thousand jobs | Location quotient (9) | Hourly mean wage | Annual mean wage (2) |
|---|---|---|---|---|---|
| Northeast Nebraska nonmetropolitan area | 110 | 1.24 | 30.34 | $ 29.00 | $ 60,330 |
| West Texas Region of Texas nonmetropolitan area | 40 | 0.20 | 5.02 | $ 43.20 | $ 89,850 |
Nonmetropolitan areas with the highest concentration of jobs and location quotients in Farmers, Ranchers, and Other Agricultural Managers:
| Nonmetropolitan area | Employment (1) | Employment per thousand jobs | Location quotient (9) | Hourly mean wage | Annual mean wage (2) |
|---|---|---|---|---|---|
| Northeast Nebraska nonmetropolitan area | 110 | 1.24 | 30.34 | $ 29.00 | $ 60,330 |
| West Texas Region of Texas nonmetropolitan area | 40 | 0.20 | 5.02 | $ 43.20 | $ 89,850 |
Top paying nonmetropolitan areas for Farmers, Ranchers, and Other Agricultural Managers:
| Nonmetropolitan area | Employment (1) | Employment per thousand jobs | Location quotient (9) | Hourly mean wage | Annual mean wage (2) |
|---|---|---|---|---|---|
| West Texas Region of Texas nonmetropolitan area | 40 | 0.20 | 5.02 | $ 43.20 | $ 89,850 |
| Nevada nonmetropolitan area | (8) | (8) | (8) | $ 41.72 | $ 86,790 |
| Northeast Nebraska nonmetropolitan area | 110 | 1.24 | 30.34 | $ 29.00 | $ 60,330 |
These estimates are calculated with data collected from employers in all industry sectors, all metropolitan and nonmetropolitan areas, and all states and the District of Columbia. The top employment and wage figures are provided above. The complete list is available in the downloadable XLS files.
The percentile wage estimate is the value of a wage below which a certain percent of workers fall. The median wage is the 50th percentile wage estimate—50 percent of workers earn less than the median and 50 percent of workers earn more than the median. More about percentile wages.
(1) Estimates for detailed occupations do not sum to the totals because the totals include occupations not shown separately. Estimates do not include self-employed workers.
(2) Annual wages have been calculated by multiplying the hourly mean wage by a "year-round, full-time" hours figure of 2,080 hours; for those occupations where there is not an hourly wage published, the annual wage has been directly calculated from the reported survey data.
(3) The relative standard error (RSE) is a measure of the reliability of a survey statistic. The smaller the relative standard error, the more precise the estimate.
(8) Estimate not released.
(9) The location quotient is the ratio of the area concentration of occupational employment to the national average concentration. A location quotient greater than one indicates the occupation has a higher share of employment than average, and a location quotient less than one indicates the occupation is less prevalent in the area than average.
Other OEWS estimates and related information:
May 2020 National Occupational Employment and Wage Estimates
May 2020 State Occupational Employment and Wage Estimates
May 2020 Metropolitan and Nonmetropolitan Area Occupational Employment and Wage Estimates
May 2020 National Industry-Specific Occupational Employment and Wage Estimates
Last Modified Date: March 31, 2021