
An official website of the United States government
An official website of the United States government
The .gov means it's official.
Federal government websites often end in .gov or .mil. Before sharing sensitive information,
make sure you're on a federal government site.
The site is secure.
The
https:// ensures that you are connecting to the official website and that any
information you provide is encrypted and transmitted securely.
This occupation includes the 2018 and 2010 SOC occupations 13-1021 Buyers and Purchasing Agents, Farm Products; 13-1022 Wholesale and Retail Buyers, Except Farm Products; and 13-1023 Purchasing Agents, Except Wholesale, Retail, and Farm Products.
Employment estimate and mean wage estimates for Buyers and Purchasing Agents:
| Employment (1) | Employment RSE (3) |
Mean hourly wage |
Mean annual wage (2) |
Wage RSE (3) |
|---|---|---|---|---|
| 419,920 | 0.7 % | $ 34.80 | $ 72,370 | 0.3 % |
Percentile wage estimates for Buyers and Purchasing Agents:
| Percentile | 10% | 25% | 50% (Median) |
75% | 90% |
|---|---|---|---|---|---|
| Hourly Wage | $ 19.14 | $ 24.44 | $ 32.06 | $ 42.60 | $ 53.93 |
| Annual Wage (2) | $ 39,810 | $ 50,840 | $ 66,690 | $ 88,600 | $ 112,170 |
Industries with the highest published employment and wages for Buyers and Purchasing Agents are provided. For a list of all industries with employment in Buyers and Purchasing Agents, see the Create Customized Tables function.
Industries with the highest levels of employment in Buyers and Purchasing Agents:
| Industry | Employment (1) | Percent of industry employment | Hourly mean wage | Annual mean wage (2) |
|---|---|---|---|---|
| Management of Companies and Enterprises | 41,510 | 1.71 | $ 38.81 | $ 80,720 |
| Federal Executive Branch (OEWS Designation) | 36,680 | 1.76 | $ 43.83 | $ 91,170 |
| Merchant Wholesalers, Durable Goods (4232, 4233, 4235, 4236, 4237, and 4239 only) | 16,770 | 1.22 | $ 31.71 | $ 65,960 |
| Local Government, excluding schools and hospitals (OEWS Designation) | 12,550 | 0.23 | $ 32.93 | $ 68,480 |
| Aerospace Product and Parts Manufacturing | 12,270 | 2.34 | $ 40.65 | $ 84,560 |
Industries with the highest concentration of employment in Buyers and Purchasing Agents:
| Industry | Employment (1) | Percent of industry employment | Hourly mean wage | Annual mean wage (2) |
|---|---|---|---|---|
| Aerospace Product and Parts Manufacturing | 12,270 | 2.34 | $ 40.65 | $ 84,560 |
| Navigational, Measuring, Electromedical, and Control Instruments Manufacturing | 7,810 | 1.86 | $ 37.73 | $ 78,470 |
| Book Stores and News Dealers | 1,000 | 1.78 | (8) | (8) |
| Federal Executive Branch (OEWS Designation) | 36,680 | 1.76 | $ 43.83 | $ 91,170 |
| Management of Companies and Enterprises | 41,510 | 1.71 | $ 38.81 | $ 80,720 |
Top paying industries for Buyers and Purchasing Agents:
| Industry | Employment (1) | Percent of industry employment | Hourly mean wage | Annual mean wage (2) |
|---|---|---|---|---|
| Pipeline Transportation of Crude Oil | 50 | 0.37 | $ 47.41 | $ 98,620 |
| Software Publishers | 1,010 | 0.21 | $ 46.24 | $ 96,190 |
| Oil and Gas Extraction | 1,640 | 1.32 | $ 45.41 | $ 94,440 |
| Federal Executive Branch (OEWS Designation) | 36,680 | 1.76 | $ 43.83 | $ 91,170 |
| Securities, Commodity Contracts, and Other Financial Investments and Related Activities | 520 | 0.06 | $ 42.14 | $ 87,650 |
States and areas with the highest published employment, location quotients, and wages for Buyers and Purchasing Agents are provided. For a list of all areas with employment in Buyers and Purchasing Agents, see the Create Customized Tables function.
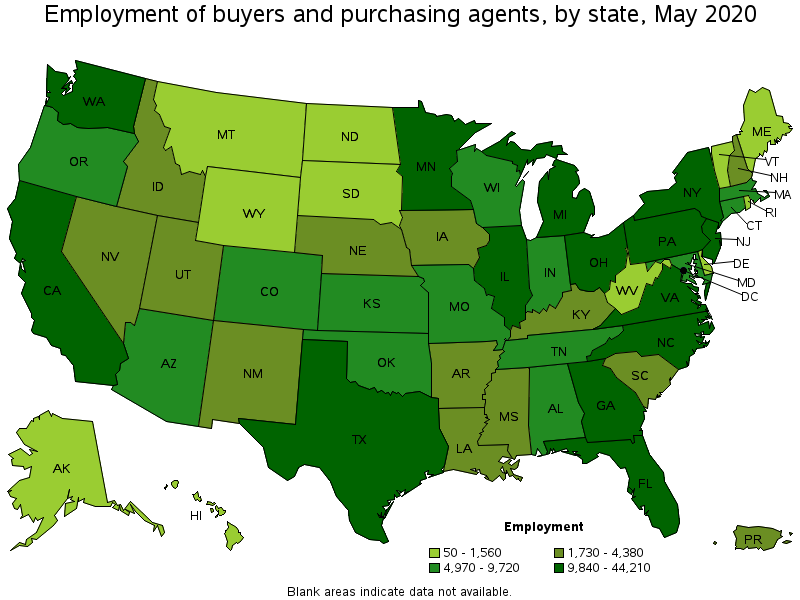
States with the highest employment level in Buyers and Purchasing Agents:
| State | Employment (1) | Employment per thousand jobs | Location quotient (9) | Hourly mean wage | Annual mean wage (2) |
|---|---|---|---|---|---|
| California | 44,210 | 2.69 | 0.89 | $ 36.78 | $ 76,490 |
| Texas | 36,490 | 3.01 | 1.00 | $ 36.54 | $ 76,010 |
| New York | 27,380 | 3.15 | 1.04 | $ 38.32 | $ 79,700 |
| Florida | 23,910 | 2.83 | 0.94 | $ 31.35 | $ 65,200 |
| Virginia | 17,450 | 4.71 | 1.56 | $ 40.10 | $ 83,400 |
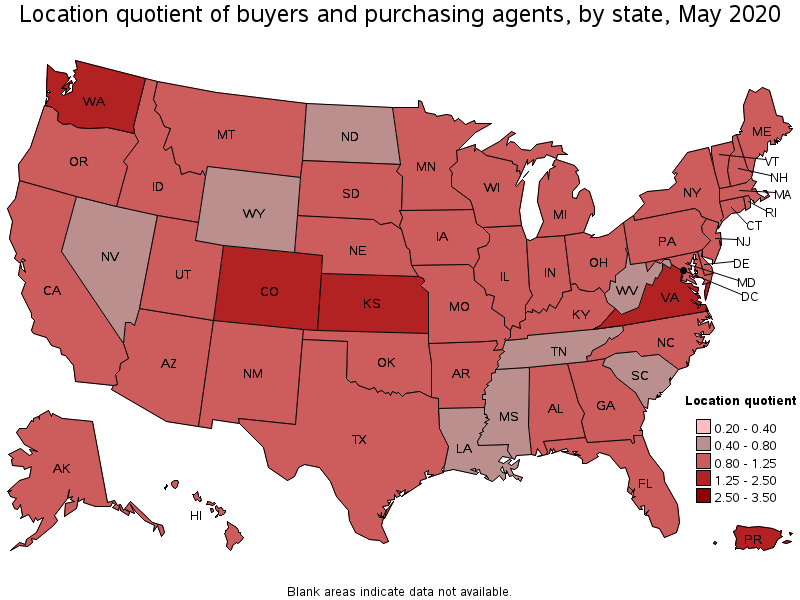
States with the highest concentration of jobs and location quotients in Buyers and Purchasing Agents:
| State | Employment (1) | Employment per thousand jobs | Location quotient (9) | Hourly mean wage | Annual mean wage (2) |
|---|---|---|---|---|---|
| Washington | 15,440 | 4.83 | 1.60 | $ 37.64 | $ 78,280 |
| Virginia | 17,450 | 4.71 | 1.56 | $ 40.10 | $ 83,400 |
| Kansas | 5,050 | 3.80 | 1.26 | $ 30.92 | $ 64,310 |
| Colorado | 9,720 | 3.77 | 1.25 | $ 34.82 | $ 72,410 |
| District of Columbia | 2,570 | 3.74 | 1.24 | $ 50.49 | $ 105,020 |
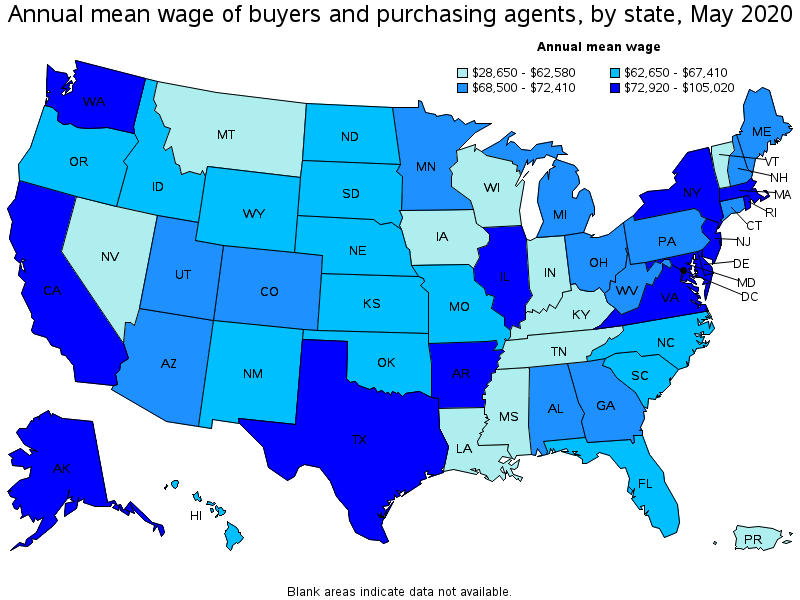
Top paying states for Buyers and Purchasing Agents:
| State | Employment (1) | Employment per thousand jobs | Location quotient (9) | Hourly mean wage | Annual mean wage (2) |
|---|---|---|---|---|---|
| District of Columbia | 2,570 | 3.74 | 1.24 | $ 50.49 | $ 105,020 |
| New Jersey | 11,200 | 2.96 | 0.98 | $ 41.78 | $ 86,890 |
| Virginia | 17,450 | 4.71 | 1.56 | $ 40.10 | $ 83,400 |
| Maryland | 9,370 | 3.71 | 1.23 | $ 39.64 | $ 82,450 |
| New York | 27,380 | 3.15 | 1.04 | $ 38.32 | $ 79,700 |
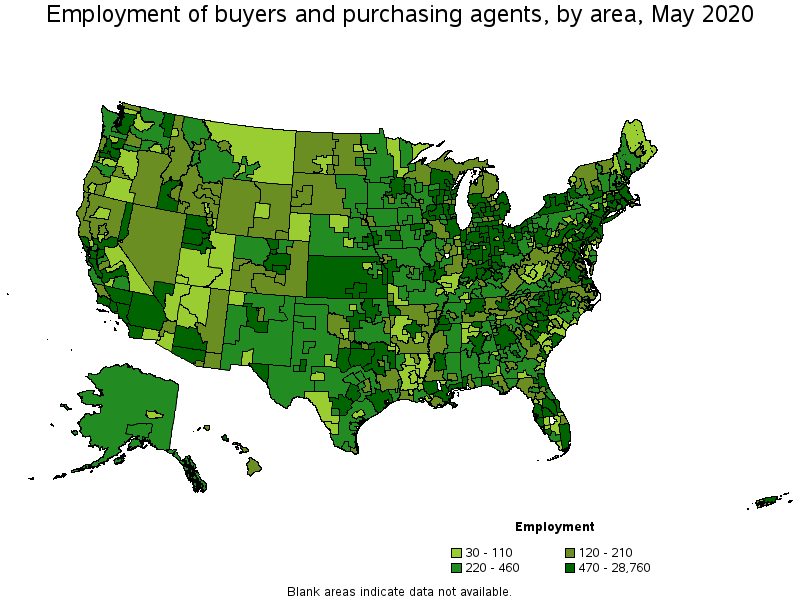
Metropolitan areas with the highest employment level in Buyers and Purchasing Agents:
| Metropolitan area | Employment (1) | Employment per thousand jobs | Location quotient (9) | Hourly mean wage | Annual mean wage (2) |
|---|---|---|---|---|---|
| New York-Newark-Jersey City, NY-NJ-PA | 28,760 | 3.26 | 1.08 | $ 40.77 | $ 84,800 |
| Los Angeles-Long Beach-Anaheim, CA | 17,460 | 3.00 | 0.99 | $ 36.20 | $ 75,300 |
| Washington-Arlington-Alexandria, DC-VA-MD-WV | 14,230 | 4.71 | 1.56 | $ 45.96 | $ 95,600 |
| Dallas-Fort Worth-Arlington, TX | 12,330 | 3.44 | 1.14 | $ 41.01 | $ 85,300 |
| Seattle-Tacoma-Bellevue, WA | 11,860 | 6.06 | 2.01 | $ 39.36 | $ 81,860 |
| Chicago-Naperville-Elgin, IL-IN-WI | 11,050 | 2.53 | 0.84 | $ 34.75 | $ 72,280 |
| Houston-The Woodlands-Sugar Land, TX | 10,310 | 3.47 | 1.15 | $ 38.06 | $ 79,170 |
| Philadelphia-Camden-Wilmington, PA-NJ-DE-MD | 8,730 | 3.24 | 1.07 | $ 38.40 | $ 79,870 |
| Atlanta-Sandy Springs-Roswell, GA | 8,600 | 3.26 | 1.08 | $ 35.41 | $ 73,640 |
| Boston-Cambridge-Nashua, MA-NH | 8,200 | 3.15 | 1.04 | $ 39.26 | $ 81,660 |
Metropolitan areas with the highest concentration of jobs and location quotients in Buyers and Purchasing Agents:
| Metropolitan area | Employment (1) | Employment per thousand jobs | Location quotient (9) | Hourly mean wage | Annual mean wage (2) |
|---|---|---|---|---|---|
| California-Lexington Park, MD | 680 | 14.96 | 4.96 | $ 47.16 | $ 98,100 |
| Huntsville, AL | 2,540 | 10.99 | 3.64 | $ 40.66 | $ 84,580 |
| Fayetteville-Springdale-Rogers, AR-MO | 2,020 | 8.17 | 2.71 | $ 46.75 | $ 97,240 |
| Warner Robins, GA | 520 | 7.14 | 2.36 | $ 39.83 | $ 82,850 |
| Dayton, OH | 2,270 | 6.34 | 2.10 | $ 40.32 | $ 83,860 |
| Seattle-Tacoma-Bellevue, WA | 11,860 | 6.06 | 2.01 | $ 39.36 | $ 81,860 |
| Midland, TX | 590 | 5.96 | 1.97 | $ 42.83 | $ 89,090 |
| Boulder, CO | 1,050 | 5.78 | 1.91 | $ 34.88 | $ 72,550 |
| Columbus, IN | 270 | 5.71 | 1.89 | $ 40.17 | $ 83,560 |
| Anniston-Oxford-Jacksonville, AL | 220 | 5.35 | 1.77 | $ 28.71 | $ 59,710 |
Top paying metropolitan areas for Buyers and Purchasing Agents:
| Metropolitan area | Employment (1) | Employment per thousand jobs | Location quotient (9) | Hourly mean wage | Annual mean wage (2) |
|---|---|---|---|---|---|
| California-Lexington Park, MD | 680 | 14.96 | 4.96 | $ 47.16 | $ 98,100 |
| Fayetteville-Springdale-Rogers, AR-MO | 2,020 | 8.17 | 2.71 | $ 46.75 | $ 97,240 |
| Washington-Arlington-Alexandria, DC-VA-MD-WV | 14,230 | 4.71 | 1.56 | $ 45.96 | $ 95,600 |
| San Jose-Sunnyvale-Santa Clara, CA | 3,930 | 3.56 | 1.18 | $ 45.73 | $ 95,120 |
| Midland, TX | 590 | 5.96 | 1.97 | $ 42.83 | $ 89,090 |
| Morgantown, WV | 190 | 3.05 | 1.01 | $ 42.28 | $ 87,950 |
| Vallejo-Fairfield, CA | 410 | 3.07 | 1.02 | $ 41.73 | $ 86,790 |
| Trenton, NJ | 700 | 3.03 | 1.00 | $ 41.68 | $ 86,700 |
| Dallas-Fort Worth-Arlington, TX | 12,330 | 3.44 | 1.14 | $ 41.01 | $ 85,300 |
| New York-Newark-Jersey City, NY-NJ-PA | 28,760 | 3.26 | 1.08 | $ 40.77 | $ 84,800 |
Nonmetropolitan areas with the highest employment in Buyers and Purchasing Agents:
| Nonmetropolitan area | Employment (1) | Employment per thousand jobs | Location quotient (9) | Hourly mean wage | Annual mean wage (2) |
|---|---|---|---|---|---|
| Kansas nonmetropolitan area | 1,080 | 2.84 | 0.94 | $ 26.52 | $ 55,160 |
| Piedmont North Carolina nonmetropolitan area | 950 | 3.87 | 1.28 | $ 27.76 | $ 57,730 |
| West Northwestern Ohio nonmetropolitan area | 760 | 3.17 | 1.05 | $ 29.02 | $ 60,360 |
| North Northeastern Ohio nonmetropolitan area (noncontiguous) | 750 | 2.40 | 0.80 | $ 29.94 | $ 62,270 |
| Southern Indiana nonmetropolitan area | 740 | 4.11 | 1.36 | $ 31.75 | $ 66,040 |
Nonmetropolitan areas with the highest concentration of jobs and location quotients in Buyers and Purchasing Agents:
| Nonmetropolitan area | Employment (1) | Employment per thousand jobs | Location quotient (9) | Hourly mean wage | Annual mean wage (2) |
|---|---|---|---|---|---|
| West Central-Southwest New Hampshire nonmetropolitan area | 460 | 4.64 | 1.54 | $ 31.48 | $ 65,480 |
| Southern Indiana nonmetropolitan area | 740 | 4.11 | 1.36 | $ 31.75 | $ 66,040 |
| Northeast Virginia nonmetropolitan area | 190 | 4.03 | 1.34 | $ 50.13 | $ 104,270 |
| Piedmont North Carolina nonmetropolitan area | 950 | 3.87 | 1.28 | $ 27.76 | $ 57,730 |
| East South Dakota nonmetropolitan area | 450 | 3.57 | 1.18 | $ 31.26 | $ 65,020 |
Top paying nonmetropolitan areas for Buyers and Purchasing Agents:
| Nonmetropolitan area | Employment (1) | Employment per thousand jobs | Location quotient (9) | Hourly mean wage | Annual mean wage (2) |
|---|---|---|---|---|---|
| Northeast Virginia nonmetropolitan area | 190 | 4.03 | 1.34 | $ 50.13 | $ 104,270 |
| Southwest Mississippi nonmetropolitan area | 120 | 1.73 | 0.57 | $ 37.07 | $ 77,110 |
| Southwest Maine nonmetropolitan area | 450 | 2.45 | 0.81 | $ 33.80 | $ 70,310 |
| Eastern Ohio nonmetropolitan area | 260 | 2.04 | 0.68 | $ 33.77 | $ 70,240 |
| Southwest Minnesota nonmetropolitan area | 330 | 2.87 | 0.95 | $ 33.59 | $ 69,860 |
These estimates are calculated with data collected from employers in all industry sectors, all metropolitan and nonmetropolitan areas, and all states and the District of Columbia. The top employment and wage figures are provided above. The complete list is available in the downloadable XLS files.
The percentile wage estimate is the value of a wage below which a certain percent of workers fall. The median wage is the 50th percentile wage estimate—50 percent of workers earn less than the median and 50 percent of workers earn more than the median. More about percentile wages.
(1) Estimates for detailed occupations do not sum to the totals because the totals include occupations not shown separately. Estimates do not include self-employed workers.
(2) Annual wages have been calculated by multiplying the hourly mean wage by a "year-round, full-time" hours figure of 2,080 hours; for those occupations where there is not an hourly wage published, the annual wage has been directly calculated from the reported survey data.
(3) The relative standard error (RSE) is a measure of the reliability of a survey statistic. The smaller the relative standard error, the more precise the estimate.
(8) Estimate not released.
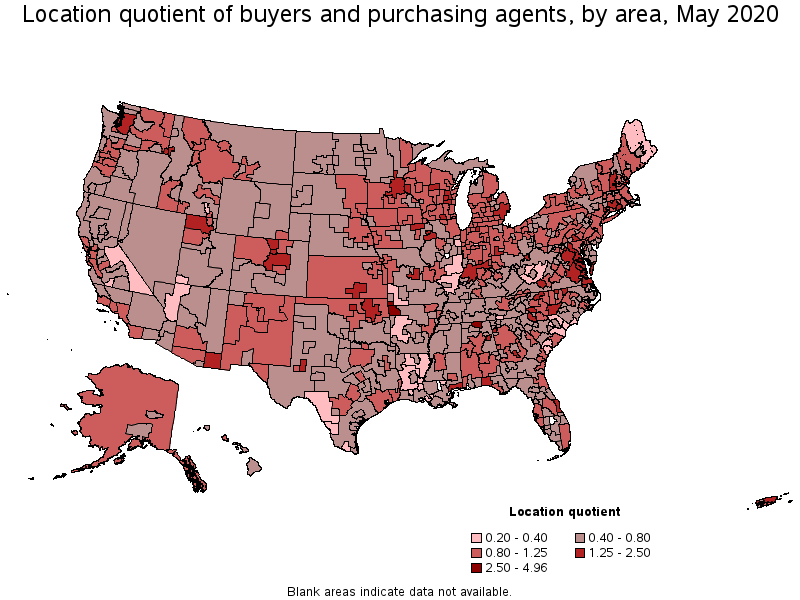
(9) The location quotient is the ratio of the area concentration of occupational employment to the national average concentration. A location quotient greater than one indicates the occupation has a higher share of employment than average, and a location quotient less than one indicates the occupation is less prevalent in the area than average.
Other OEWS estimates and related information:
May 2020 National Occupational Employment and Wage Estimates
May 2020 State Occupational Employment and Wage Estimates
May 2020 Metropolitan and Nonmetropolitan Area Occupational Employment and Wage Estimates
May 2020 National Industry-Specific Occupational Employment and Wage Estimates
Last Modified Date: March 31, 2021