
An official website of the United States government
An official website of the United States government
The .gov means it's official.
Federal government websites often end in .gov or .mil. Before sharing sensitive information,
make sure you're on a federal government site.
The site is secure.
The
https:// ensures that you are connecting to the official website and that any
information you provide is encrypted and transmitted securely.
Coordinate activities of staff, convention personnel, or clients to make arrangements for group meetings, events, or conventions.
Employment estimate and mean wage estimates for Meeting, Convention, and Event Planners:
| Employment (1) | Employment RSE (3) |
Mean hourly wage |
Mean annual wage (2) |
Wage RSE (3) |
|---|---|---|---|---|
| 109,800 | 1.7 % | $ 26.87 | $ 55,890 | 0.8 % |
Percentile wage estimates for Meeting, Convention, and Event Planners:
| Percentile | 10% | 25% | 50% (Median) |
75% | 90% |
|---|---|---|---|---|---|
| Hourly Wage | $ 14.06 | $ 18.49 | $ 24.79 | $ 32.33 | $ 42.48 |
| Annual Wage (2) | $ 29,240 | $ 38,460 | $ 51,560 | $ 67,250 | $ 88,360 |
Industries with the highest published employment and wages for Meeting, Convention, and Event Planners are provided. For a list of all industries with employment in Meeting, Convention, and Event Planners, see the Create Customized Tables function.
Industries with the highest levels of employment in Meeting, Convention, and Event Planners:
| Industry | Employment (1) | Percent of industry employment | Hourly mean wage | Annual mean wage (2) |
|---|---|---|---|---|
| Business, Professional, Labor, Political, and Similar Organizations | 9,140 | 2.20 | $ 29.15 | $ 60,620 |
| Colleges, Universities, and Professional Schools | 8,200 | 0.27 | $ 26.09 | $ 54,280 |
| Other Support Services | 7,680 | 2.57 | $ 29.31 | $ 60,970 |
| Traveler Accommodation | 6,320 | 0.42 | $ 24.95 | $ 51,890 |
| Management, Scientific, and Technical Consulting Services | 5,300 | 0.35 | $ 30.38 | $ 63,200 |
Industries with the highest concentration of employment in Meeting, Convention, and Event Planners:
| Industry | Employment (1) | Percent of industry employment | Hourly mean wage | Annual mean wage (2) |
|---|---|---|---|---|
| Promoters of Performing Arts, Sports, and Similar Events | 3,800 | 3.34 | $ 24.60 | $ 51,170 |
| Other Support Services | 7,680 | 2.57 | $ 29.31 | $ 60,970 |
| Business, Professional, Labor, Political, and Similar Organizations | 9,140 | 2.20 | $ 29.15 | $ 60,620 |
| Museums, Historical Sites, and Similar Institutions | 2,340 | 1.62 | $ 23.20 | $ 48,260 |
| Grantmaking and Giving Services | 2,090 | 1.45 | $ 28.23 | $ 58,730 |
Top paying industries for Meeting, Convention, and Event Planners:
| Industry | Employment (1) | Percent of industry employment | Hourly mean wage | Annual mean wage (2) |
|---|---|---|---|---|
| Software Publishers | 1,260 | 0.26 | $ 42.21 | $ 87,800 |
| Aerospace Product and Parts Manufacturing | 70 | 0.01 | $ 40.84 | $ 84,950 |
| Securities, Commodity Contracts, and Other Financial Investments and Related Activities | 940 | 0.10 | $ 36.73 | $ 76,400 |
| Navigational, Measuring, Electromedical, and Control Instruments Manufacturing | 190 | 0.04 | $ 35.17 | $ 73,150 |
| Other Information Services | 790 | 0.23 | $ 34.94 | $ 72,680 |
States and areas with the highest published employment, location quotients, and wages for Meeting, Convention, and Event Planners are provided. For a list of all areas with employment in Meeting, Convention, and Event Planners, see the Create Customized Tables function.
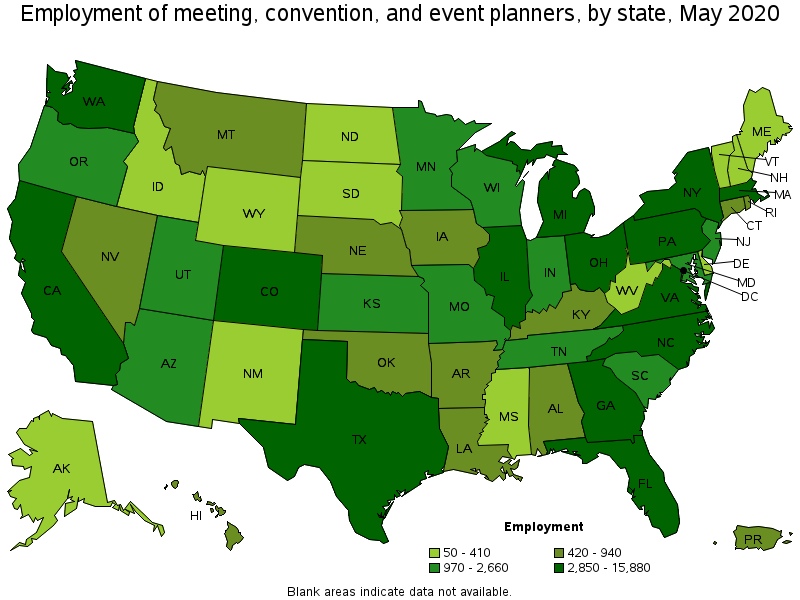
States with the highest employment level in Meeting, Convention, and Event Planners:
| State | Employment (1) | Employment per thousand jobs | Location quotient (9) | Hourly mean wage | Annual mean wage (2) |
|---|---|---|---|---|---|
| California | 15,880 | 0.97 | 1.22 | $ 29.79 | $ 61,950 |
| New York | 9,490 | 1.09 | 1.38 | $ 33.44 | $ 69,550 |
| Florida | 7,480 | 0.89 | 1.12 | $ 24.20 | $ 50,340 |
| Texas | 7,400 | 0.61 | 0.77 | $ 24.44 | $ 50,840 |
| Pennsylvania | 4,360 | 0.79 | 1.00 | $ 25.39 | $ 52,820 |
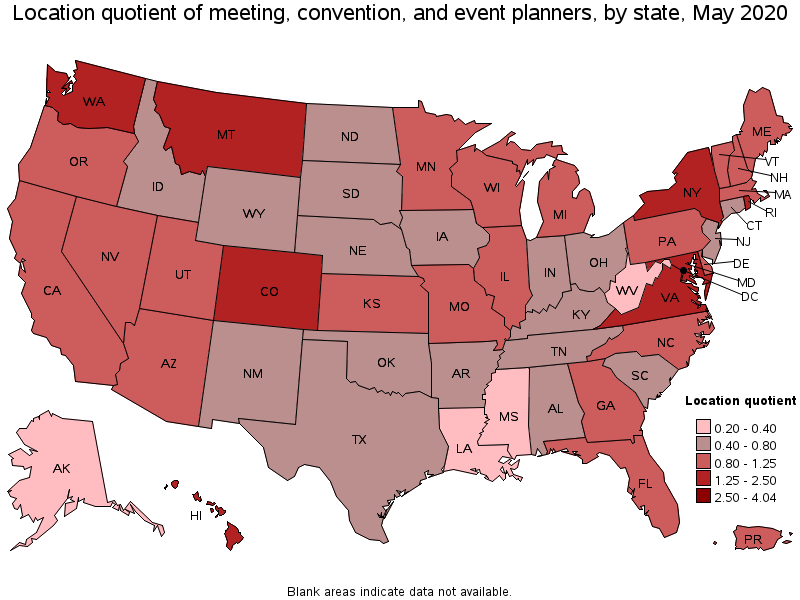
States with the highest concentration of jobs and location quotients in Meeting, Convention, and Event Planners:
| State | Employment (1) | Employment per thousand jobs | Location quotient (9) | Hourly mean wage | Annual mean wage (2) |
|---|---|---|---|---|---|
| District of Columbia | 2,190 | 3.19 | 4.04 | $ 32.38 | $ 67,340 |
| Colorado | 3,580 | 1.39 | 1.76 | $ 25.29 | $ 52,610 |
| Montana | 570 | 1.24 | 1.57 | $ 23.11 | $ 48,070 |
| Hawaii | 700 | 1.22 | 1.55 | $ 28.10 | $ 58,460 |
| Washington | 3,660 | 1.14 | 1.45 | $ 31.47 | $ 65,460 |
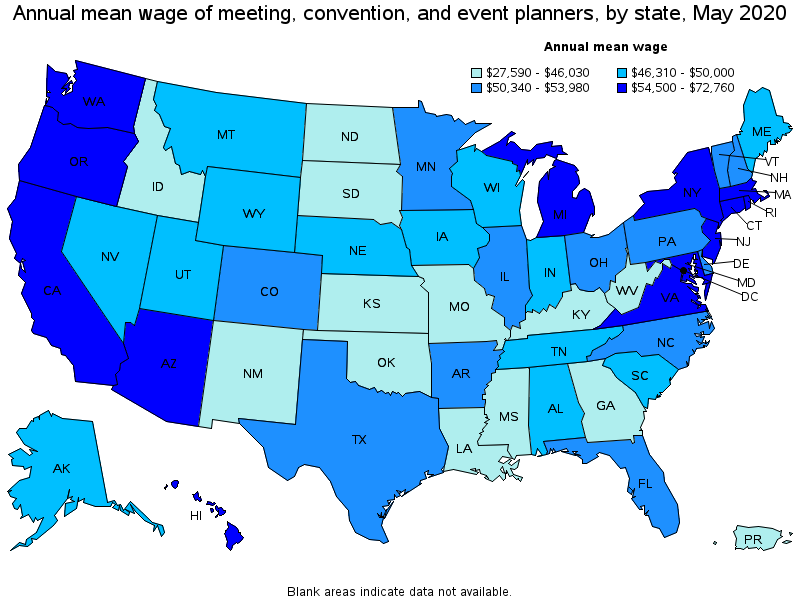
Top paying states for Meeting, Convention, and Event Planners:
| State | Employment (1) | Employment per thousand jobs | Location quotient (9) | Hourly mean wage | Annual mean wage (2) |
|---|---|---|---|---|---|
| New Jersey | 1,900 | 0.50 | 0.64 | $ 34.98 | $ 72,760 |
| New York | 9,490 | 1.09 | 1.38 | $ 33.44 | $ 69,550 |
| District of Columbia | 2,190 | 3.19 | 4.04 | $ 32.38 | $ 67,340 |
| Rhode Island | 440 | 0.98 | 1.25 | $ 32.21 | $ 67,010 |
| Washington | 3,660 | 1.14 | 1.45 | $ 31.47 | $ 65,460 |
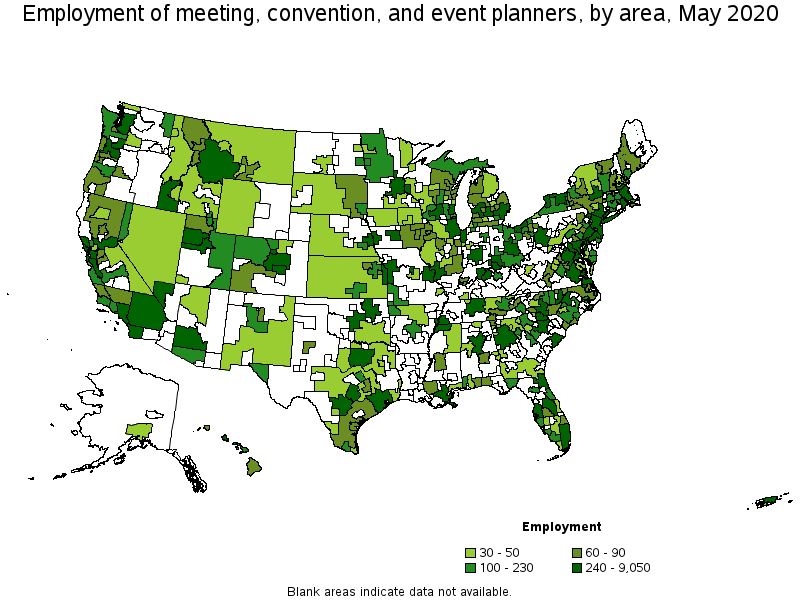
Metropolitan areas with the highest employment level in Meeting, Convention, and Event Planners:
| Metropolitan area | Employment (1) | Employment per thousand jobs | Location quotient (9) | Hourly mean wage | Annual mean wage (2) |
|---|---|---|---|---|---|
| New York-Newark-Jersey City, NY-NJ-PA | 9,050 | 1.02 | 1.30 | $ 35.95 | $ 74,770 |
| Los Angeles-Long Beach-Anaheim, CA | 6,780 | 1.16 | 1.47 | $ 29.49 | $ 61,340 |
| Washington-Arlington-Alexandria, DC-VA-MD-WV | 5,610 | 1.85 | 2.35 | $ 31.82 | $ 66,190 |
| Chicago-Naperville-Elgin, IL-IN-WI | 3,780 | 0.87 | 1.10 | $ 26.32 | $ 54,740 |
| San Francisco-Oakland-Hayward, CA | 3,180 | 1.37 | 1.73 | $ 34.27 | $ 71,280 |
| Seattle-Tacoma-Bellevue, WA | 2,740 | 1.40 | 1.77 | $ 34.94 | $ 72,680 |
| Dallas-Fort Worth-Arlington, TX | 2,630 | 0.73 | 0.93 | $ 25.24 | $ 52,490 |
| Miami-Fort Lauderdale-West Palm Beach, FL | 2,560 | 1.02 | 1.30 | $ 24.45 | $ 50,850 |
| Atlanta-Sandy Springs-Roswell, GA | 2,510 | 0.95 | 1.21 | $ 22.09 | $ 45,950 |
| Philadelphia-Camden-Wilmington, PA-NJ-DE-MD | 2,430 | 0.90 | 1.14 | $ 25.80 | $ 53,660 |
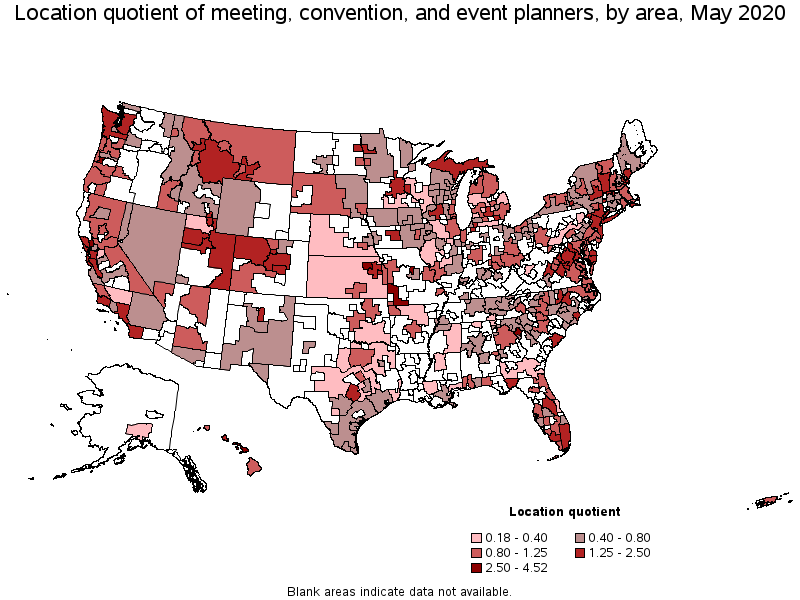
Metropolitan areas with the highest concentration of jobs and location quotients in Meeting, Convention, and Event Planners:
| Metropolitan area | Employment (1) | Employment per thousand jobs | Location quotient (9) | Hourly mean wage | Annual mean wage (2) |
|---|---|---|---|---|---|
| Columbia, MO | 310 | 3.56 | 4.52 | $ 11.91 | $ 24,770 |
| Manhattan, KS | 80 | 2.30 | 2.91 | $ 21.83 | $ 45,410 |
| Kahului-Wailuku-Lahaina, HI | 140 | 2.08 | 2.63 | $ 29.15 | $ 60,630 |
| Napa, CA | 140 | 1.98 | 2.51 | $ 30.21 | $ 62,830 |
| Corvallis, OR | 70 | 1.97 | 2.50 | $ 26.12 | $ 54,330 |
| Athens-Clarke County, GA | 170 | 1.97 | 2.50 | $ 20.50 | $ 42,640 |
| Washington-Arlington-Alexandria, DC-VA-MD-WV | 5,610 | 1.85 | 2.35 | $ 31.82 | $ 66,190 |
| Topeka, KS | 190 | 1.81 | 2.29 | $ 14.71 | $ 30,600 |
| Charlottesville, VA | 190 | 1.75 | 2.22 | $ 24.41 | $ 50,780 |
| Logan, UT-ID | 100 | 1.75 | 2.22 | $ 14.43 | $ 30,010 |
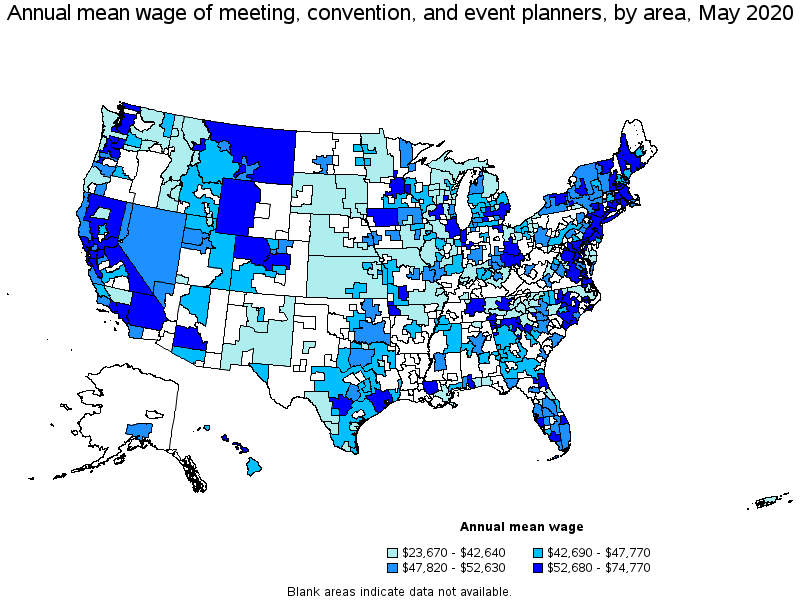
Top paying metropolitan areas for Meeting, Convention, and Event Planners:
| Metropolitan area | Employment (1) | Employment per thousand jobs | Location quotient (9) | Hourly mean wage | Annual mean wage (2) |
|---|---|---|---|---|---|
| New York-Newark-Jersey City, NY-NJ-PA | 9,050 | 1.02 | 1.30 | $ 35.95 | $ 74,770 |
| Seattle-Tacoma-Bellevue, WA | 2,740 | 1.40 | 1.77 | $ 34.94 | $ 72,680 |
| San Jose-Sunnyvale-Santa Clara, CA | 1,170 | 1.06 | 1.34 | $ 34.86 | $ 72,520 |
| San Francisco-Oakland-Hayward, CA | 3,180 | 1.37 | 1.73 | $ 34.27 | $ 71,280 |
| Port St. Lucie, FL | 70 | 0.51 | 0.65 | $ 33.99 | $ 70,710 |
| Bridgeport-Stamford-Norwalk, CT | 460 | 1.22 | 1.55 | $ 33.96 | $ 70,630 |
| Trenton, NJ | 130 | 0.56 | 0.70 | $ 32.29 | $ 67,150 |
| Washington-Arlington-Alexandria, DC-VA-MD-WV | 5,610 | 1.85 | 2.35 | $ 31.82 | $ 66,190 |
| Providence-Warwick, RI-MA | 470 | 0.89 | 1.13 | $ 31.81 | $ 66,170 |
| Boston-Cambridge-Nashua, MA-NH | 2,370 | 0.91 | 1.15 | $ 31.38 | $ 65,280 |
Nonmetropolitan areas with the highest employment in Meeting, Convention, and Event Planners:
| Nonmetropolitan area | Employment (1) | Employment per thousand jobs | Location quotient (9) | Hourly mean wage | Annual mean wage (2) |
|---|---|---|---|---|---|
| Southwest Montana nonmetropolitan area | 250 | 1.82 | 2.30 | $ 22.97 | $ 47,770 |
| Western Washington nonmetropolitan area | 190 | 1.62 | 2.05 | $ 20.24 | $ 42,090 |
| Northwest Colorado nonmetropolitan area | 160 | 1.43 | 1.81 | $ 26.14 | $ 54,360 |
| Southwest Missouri nonmetropolitan area | 150 | 2.13 | 2.70 | $ 22.13 | $ 46,020 |
| Upper Peninsula of Michigan nonmetropolitan area | 140 | 1.36 | 1.72 | $ 18.03 | $ 37,500 |
Nonmetropolitan areas with the highest concentration of jobs and location quotients in Meeting, Convention, and Event Planners:
| Nonmetropolitan area | Employment (1) | Employment per thousand jobs | Location quotient (9) | Hourly mean wage | Annual mean wage (2) |
|---|---|---|---|---|---|
| Southwest Missouri nonmetropolitan area | 150 | 2.13 | 2.70 | $ 22.13 | $ 46,020 |
| Southwest Montana nonmetropolitan area | 250 | 1.82 | 2.30 | $ 22.97 | $ 47,770 |
| Western Washington nonmetropolitan area | 190 | 1.62 | 2.05 | $ 20.24 | $ 42,090 |
| Massachusetts nonmetropolitan area | 90 | 1.57 | 1.99 | $ 23.68 | $ 49,240 |
| Eastern Utah nonmetropolitan area | 120 | 1.53 | 1.94 | $ 22.32 | $ 46,420 |
Top paying nonmetropolitan areas for Meeting, Convention, and Event Planners:
| Nonmetropolitan area | Employment (1) | Employment per thousand jobs | Location quotient (9) | Hourly mean wage | Annual mean wage (2) |
|---|---|---|---|---|---|
| Northwest Iowa nonmetropolitan area | 50 | 0.38 | 0.48 | $ 31.82 | $ 66,190 |
| Southern Ohio nonmetropolitan area | 130 | 0.88 | 1.11 | $ 30.01 | $ 62,430 |
| Upper Savannah South Carolina nonmetropolitan area | 30 | 0.40 | 0.51 | $ 29.03 | $ 60,370 |
| North Valley-Northern Mountains Region of California nonmetropolitan area | 80 | 0.85 | 1.07 | $ 28.12 | $ 58,480 |
| Eastern Sierra-Mother Lode Region of California nonmetropolitan area | 30 | 0.63 | 0.80 | $ 27.43 | $ 57,050 |
These estimates are calculated with data collected from employers in all industry sectors, all metropolitan and nonmetropolitan areas, and all states and the District of Columbia. The top employment and wage figures are provided above. The complete list is available in the downloadable XLS files.
The percentile wage estimate is the value of a wage below which a certain percent of workers fall. The median wage is the 50th percentile wage estimate—50 percent of workers earn less than the median and 50 percent of workers earn more than the median. More about percentile wages.
(1) Estimates for detailed occupations do not sum to the totals because the totals include occupations not shown separately. Estimates do not include self-employed workers.
(2) Annual wages have been calculated by multiplying the hourly mean wage by a "year-round, full-time" hours figure of 2,080 hours; for those occupations where there is not an hourly wage published, the annual wage has been directly calculated from the reported survey data.
(3) The relative standard error (RSE) is a measure of the reliability of a survey statistic. The smaller the relative standard error, the more precise the estimate.
(9) The location quotient is the ratio of the area concentration of occupational employment to the national average concentration. A location quotient greater than one indicates the occupation has a higher share of employment than average, and a location quotient less than one indicates the occupation is less prevalent in the area than average.
Other OEWS estimates and related information:
May 2020 National Occupational Employment and Wage Estimates
May 2020 State Occupational Employment and Wage Estimates
May 2020 Metropolitan and Nonmetropolitan Area Occupational Employment and Wage Estimates
May 2020 National Industry-Specific Occupational Employment and Wage Estimates
Last Modified Date: March 31, 2021